
Rationale and Objectives
To evaluate the trends, characteristics, and quality of systematic review and meta-analysis in general radiology journals.
Materials and Methods
We performed a PubMed search to identify systematic reviews and meta-analyses that had been carried out in the field of radiology between 2007 and 2015. The following data were extracted: journal, impact factor, type of research, year of publication, radiological subspecialty, imaging modalities used, number of authors, affiliated department of the first and corresponding authors, presence of a radiologist and a statistician among the authors, discordance between the first and corresponding authors, funding, country of first author, methodological quality, methods used for quality assessment, and statistics.
Results
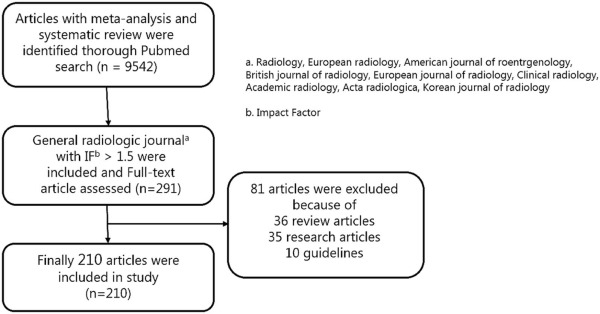
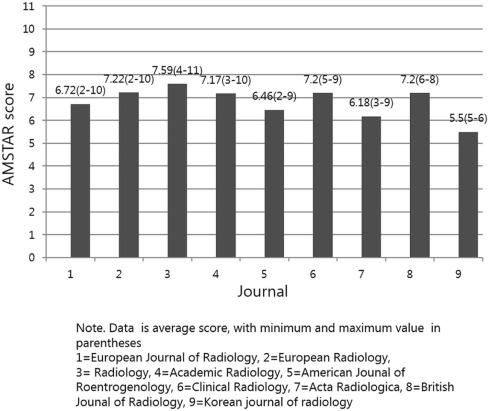
Ultimately, we included 210 articles from nine general radiology journals. The European Journal of Radiology was the most common journal represented (47 of 210; 22.4%). Meta-analyses ( n = 177; 84.3%) were published about five times more than systematic reviews without meta-analysis ( n = 33; 15.7%). Radiology of the gastrointestinal tract was the most commonly represented subspecialty ( n = 49, 23.3%). The first authors were most frequently located in China ( n = 64; 30.3%). In terms of modality, magnetic resonance imaging was used most often ( n = 59; 28.1%). The number of authors tended to progressively increase over time, and the ratio of discordance between the first and corresponding authors also increased significantly, as did the proportion of research that has received funding from an external source. The mean AMSTAR assessment score improved over time (5.87/11 in 2007–2009, 7.11/11 in 2010–2012, and 7.49/11 in 2013–2015). In this regard, the journal Radiology had the highest score (7.59/11).
Conclusions
The quantity and quality of radiological meta-analyses have significantly increased over the past 9 years; however, specific weak areas remain, providing the opportunity for quality improvement.
Introduction
To evaluate all of the information that has been gathered to date on a particular topic, researchers often perform a systematic review. In a systematic review, researchers identify and screen relevant research articles; they then review and analyze data from the screened research to evaluate the effects of therapeutic interventions or the accuracy of diagnostic tests . Meta-analysis is a kind of systematic review that uses statistical methods to integrate data from multiple primary studies. Recently, the need for systematic review and meta-analysis in radiological literature has increased because imaging modalities and technology have improved rapidly, and our understanding of evidence-based medicine has increased.
Systematic review and meta-analysis can increase the validity and reduce the bias of the primary studies by integrating the results of multiple studies . In this way, appropriately performed systematic reviews and meta-analyses provide better quality results. Nonetheless, several published systematic reviews and meta-analyses have used an inappropriate study design .
Get Radiology Tree app to read full this article<
Get Radiology Tree app to read full this article<
Get Radiology Tree app to read full this article<
Materials and Methods
Get Radiology Tree app to read full this article<
Search Strategy
Get Radiology Tree app to read full this article<
Get Radiology Tree app to read full this article<
Get Radiology Tree app to read full this article<
Data Extraction
Get Radiology Tree app to read full this article<
Get Radiology Tree app to read full this article<
Get Radiology Tree app to read full this article<
Quality Assessment of Methodology
Get Radiology Tree app to read full this article<
Statistical Analysis
Get Radiology Tree app to read full this article<
Get Radiology Tree app to read full this article<
Results
Results of Search
Get Radiology Tree app to read full this article<
Get Radiology Tree app to read full this article<
Get Radiology Tree app to read full this article<
Table 1
Number of Articles and Impact Factor of General Radiologic Journal with Meta-analysis and Systematic Review published between 2007 and 2015
Journal Impact Factor (2014) Five-year Impact Factor Number of Articles_European Journal of Radiology_ 2.369 2.411 47 (22.4)European Radiology 4.014 3.735 45 (21.4)Radiology 6.867 7.259 32 (15.2)Academic Radiology 1.751 1.898 24 (11.4)American Journal of Roentgenology 2.731 3.302 24 (11.4)Clinical Radiology 1.759 1.860 15 (7.1)Acta Radiologica 1.603 1.645 11 (5.2)British Journal of Radiology 2.026 1.976 10 (4.8)Korean Journal of Radiology 1.571 1.838 2 (1.1) Total 210
Note: Data are number of articles, with percentage in parentheses.
Get Radiology Tree app to read full this article<
Characteristics and Trends of Articles
Get Radiology Tree app to read full this article<
Table 2
Country of First Author in the Meta-analysis and Systematic Review of General Radiologic Journal Between 2007 and 2015
Period Total (210 articles) 2007–2009 (47 articles) 2010–2012 (72 articles) 2013–2015 (91 articles) China \* 4 (8.5) 24 (33.3) 36 (39.5) 64 (30.3) Netherland 11 (23.5) 14 (19.4) 14 (15.4) 39 (18.5) United States 10 (21.3) 13 (18.1) 9 (9.9) 32 (15.1) United Kingdom 6 (12.8) 9 (12.5) 4 (4.4) 19 (9.0) Australia 1 (2.1) 4 (5.6) 1 (1.1) 6 (2.9) Canada 3 (6.4) 1 (1.4) 2 (2.2) 6 (2.9) Italy 1 (2.1) 1 (1.4) 4 (4.4) 6 (2.9) France 3 (6.4) 0 (0) 2 (2.2) 5 (2.4) Germany 2 (4.3) 1 (1.4) 2 (2.2) 5 (2.4) Spain 1 (2.1) 1 (1.4) 2 (2.2) 4 (1.9) Denmark 1 (2.1) 1 (1.4) 1 (1.1) 3 (1.4) Korea 0 (0) 0 (0) 3 (3.3) 3 (1.4) Switzerland 1 (2.1) 0 (0) 3 (3.3) 4 (1.9) Austria 0 (0) 1 (1.4) 1 (1.1) 2 (1.0) Greece 1 (2.1) 1 (1.4) 0 (0) 2 (1.0) Singapore 0 (0) 0 (0) 2 (2.2) 2 (1.0) Sweden 0 (0) 0 (0) 2 (2.2) 2 (1.0) Belgium 1 (2.1) 0 (0) 0 (0) 1 (0.5) Iran 0 (0) 0 (0) 1 (1.1) 1 (0.5) Ireland 0 (0) 1 (1.4) 0 (0) 1 (0.5) Israel 1 (2.1) 0 (0) 0 (0) 1 (0.5) Japan 0 (0) 0 (0) 1 (1.1) 1 (0.5) Norway 0 (0) 0 (0) 1 (1.1) 1 (0.5) Total 47 (100) 72 (100) 91 (100) 210 (100)
Note: Data are number of articles, with percentage in parentheses.
Get Radiology Tree app to read full this article<
Table 3
Characteristics in the Meta-analysis and Systematic Review of General Radiologic Journal Between 2007 and 2015
Characteristic Period Total (210 Articles) 2007–2009 (47 Articles) 2010–2012 (72 Articles) 2013–2015 (91 Articles)Type of research Meta-analysis 35 (74.5) 62 (86.1) 80 (87.9) 177 (84.3) Systematic review 12 (25.5) 10 (13.9) 11 (12.1) 33 (15.7)Radiologic subspecialty Breast 5 (10.5) 7 (9.7) 9 (9.9) 21 (10.0) Cardiology 10 (21.3) 6 (8.3) 13 (14.3) 29 (13.8) Chest 3 (6.4) 4 (5.6) 8 (8.7) 15 (7.1) Gastrointestinal 7 (14.9) 21 (29.1) 21 (23.1) 49 (23.3) Genitourinary 6 (12.8) 9 (12.5) 13 (14.3) 28 (13.3) Head and neck 2 (4.3) 3 (4.2) 11 (12.1) 16 (7.6) Musculoskeletal 7 (14.9) 8 (11.1) 7 (7.7) 22 (10.5) Neuroradiology 1 (2.1) 4 (5.6) 3 (3.3) 8 (3.8) Pediatric 0 (0) 1 (1.4) 0 (0) 1 (0.5) Vascular and intervention 2 (4.3) 1 (1.4) 3 (3.3) 6 (3.0) Miscellaneous 4 (8.5) 8 (11.1) 3 (3.3) 15 (7.1)Imaging modalities Conventional radiography 2 (4.4) 0 (0) 2 (2.2) 4 (1.9) Fluoroscopy 0 (0) 1 (1.4) 1 (1.1) 2 (1.0) Sonography 1 (2.1) 4 (5.6) 11 (12.1) 16 (7.6) CT 15 (31.9) 15 (20.8) 19 (20.8) 49 (23.3) MRI \* 9 (19.1) 18 (25.0) 32 (35.2) 59 (28.1) Mammography 1 (2.1) 2 (2.8) 0 (0) 3 (1.4) Nuclear medicine † 5 (10.6) 16 (22.1) 14 (15.4) 35 (16.7) Combined ‡ 14 (29.8) 13 (18.1) 10 (11.0) 37 (17.6) Others § 0 (0) 3 (4.2) 2 (2.2) 5 (2.4)No. of authors <4 ¶ 14 (29.8) 12 (16.7) 13 (14.3) 39 (18.6) 4–7 31 (66.0) 52 (72.2) 58 (63.7) 141 (67.1) >7 ‡ 2 (4.3) 8 (11.1) 20 (22.0) 30 (14.3)Affiliation department of first author 142 Radiology 32 (68.0) 44 (61.1) 54 (59.3) 130 (61.9) Medicine or surgery 11 (23.4) 14 (19.4) 22 (24.2) 47 (22.4) Statistics \\ 2 (4.3) 2 (2.8) 3 (3.3) 7 (3.3) Nuclear medicine 2 (4.3) 10 (13.9) 11 (12.1) 23 (11.0) Radiation oncology 0 (0) 2 (2.8) 1 (1.1) 3 (1.4)Affiliation department of corresponding author Radiology 33 (70.2) 42 (58.3) 54 (59.3) 129 (61.4) Medicine or surgery 10 (21.3) 19 (26.4) 21 (23.1) 50 (23.8) Statistics 1 (2.1) 5 (6.9) 5 (5.5) 11 (5.2) Nuclear medicine 3 (6.4) 5 (6.9) 10 (11.0) 18 (8.6) Radiation oncology 0 (0) 1 (1.5) 1 (1.1) 2 (1.0)Proportion of specified author Radiologist 40 (85.1) 59 (81.9) 68 (74.7) 167 (79.5) Statistician 10 (21.2) 14 (19.4) 16 (17.6) 40 (19.0)Discordance between first author and corresponding author Yes ‡ 7 (14.9) 24 (33.3) 52 (57.1) 83 (39.5) No ¶ 40 (85.1) 48 (66.7) 39 (42.9) 127 (60.5)Funding Yes 11 (23.4) 23 (31.9) 28 (30.8) 62 (29.5) No 36 (76.6) 49 (68.1) 63 (69.2) 148 (70.5)
CT, computed tomography; MR, magnetic resonance; MRI, magnetic resonance imaging; PET, positron emission tomography; PET-CT, positron emission tomography-computed tomography; SPECT, single photon emission computed tomography.
Note: Data are number of articles, with percentage in parentheses.
Get Radiology Tree app to read full this article<
Get Radiology Tree app to read full this article<
Get Radiology Tree app to read full this article<
Get Radiology Tree app to read full this article<
Get Radiology Tree app to read full this article<
Get Radiology Tree app to read full this article<
Get Radiology Tree app to read full this article<
Get Radiology Tree app to read full this article<
Quality Assessment
Get Radiology Tree app to read full this article<
Table 4
Results of AMSTAR Assessment, Methods for Quality Assessment, and Statistical Analysis in the Meta-analysis and Systematic Review of General Radiologic Journal Between 2007 and 2015
Characteristic Period Total (210 Articles) 2007–2009 (47 Articles) 2010–2012 (72 Articles) 2013–2015 (91 Articles)AMSTAR assessment Average score \* 5.87 ± 1.47 † 7.11 ± 1.69 7.49 ± 1.45 7.00 ± 1.66Proportion of quality assessment Meta-analysis \* 25/35 (71.4) 56/62 (90.3) 77/80 (96.3) 158/177 (89.3) Systematic review 8/12 (66.7) 4/10 (40.0) 10/11 (90.9) 22/33 (66.7) Total \* 33/47 (70.2) 60/72 (83.3) 87/91 (95.6) 180/210 (85.7)Methods of quality assessment QUADAS 20 (42.6) 48 (66.7) 49 (53.8) 117 (55.6) QUADAS2 \* 0 (0) 1 (1.4) 34 (37.4) 35 (16.7) Recommendations of the Cochrane Methods Working Group on Systematic Review of Screening and Diagnostic Tests 1 (2.1) 4 (5.6) 0 (0) 5 (2.4) OCEBM ‡ level of evidence: diagnostic domain 3 (6.4) 1 (1.4) 2 (2.2) 6 (2.9) Own criteria 4 (8.5) 5 (6.8) 1 (1.1) 10 (4.8) Others 5 (10.6) 1 (1.4) 1 (1.1) 7 (3.3) None § 14 (29.8) 12 (16.7) 4 (4.4) 30 (14.3)Statistical analysis (meta-analysis) Univariate only 9 (25.7) 14 (22.6) 6 (7.5) 29 (16.4) Univariate and SROC 15 (42.8) 24 (38.7) 42 (52.4) 81 (45.7) Subtotal 24 (68.5) 38 (61.3) 48 (59.9) 110 (62.1) Bivariate only 3 (8.6) 7 (11.3) 9 (11.3) 19 (10.6) HSROC only 1 (2.9) 0 (0) 0 (0) 1 (0.6) Bivariate and HSROC 7 (20.0) 15 (24.2) 22 (27.5) 44 (24.9) Subtotal 11 (31.5) 22 (35.5) 31 (38.8) 64 (36.1) Bivariate/SROC 0 (0) 1 (1.6) 0 (0) 1 (0.6) Univariate/HSROC 0 (0) 1 (1.6) 1 (1.3) 2 (1.2)
AMSTAR, Assessing the Methodological Quality of Systematic Reviews; HSROC, hierarchical summary receiver operating characteristic; QUADAS, Quality Assessment of Diagnostic Accuracy Studies; SROC, summary receiver operating characteristic.
Note: Data are number of articles, with percentage in parentheses.
Get Radiology Tree app to read full this article<
Get Radiology Tree app to read full this article<
Get Radiology Tree app to read full this article<
Get Radiology Tree app to read full this article<
Get Radiology Tree app to read full this article<
Get Radiology Tree app to read full this article<
![Figure 2, Percentage of fulfillment of each AMSTAR item at each stage: Item 4 (Was the status of publication [i.e. grey literature] used as an inclusion criterion?) and item 5 (Was a list of studies [included and excluded] provided?) had the lowest proportion of “yes” or “not applicable” answers. The remaining nine items tended to improve over time in terms of their percentage of “yes” or “not applicable” answers.](https://storage.googleapis.com/dl.dentistrykey.com/clinical/CharacteristicsTrendsandQualityofSystematicReviewandMetaAnalysisinGeneralRadiologybetween2007and2015/1_1s20S1076633217301216.jpg)
Get Radiology Tree app to read full this article<
Get Radiology Tree app to read full this article<
Get Radiology Tree app to read full this article<
Get Radiology Tree app to read full this article<
Get Radiology Tree app to read full this article<
Discussion
Get Radiology Tree app to read full this article<
Get Radiology Tree app to read full this article<
Get Radiology Tree app to read full this article<
Get Radiology Tree app to read full this article<
Get Radiology Tree app to read full this article<
Get Radiology Tree app to read full this article<
Get Radiology Tree app to read full this article<
Get Radiology Tree app to read full this article<
Get Radiology Tree app to read full this article<
Get Radiology Tree app to read full this article<
Get Radiology Tree app to read full this article<
Get Radiology Tree app to read full this article<
Get Radiology Tree app to read full this article<
Get Radiology Tree app to read full this article<
Get Radiology Tree app to read full this article<
Conclusions
Get Radiology Tree app to read full this article<
Supplementary Data
Get Radiology Tree app to read full this article<
Appendix S1
Get Radiology Tree app to read full this article<
Get Radiology Tree app to read full this article<
Get Radiology Tree app to read full this article<
Get Radiology Tree app to read full this article<
References
1. Tunis A.S., McInnes M.D.F., Hanna R., et. al.: Association of study quality with completeness of reporting: have completeness of reporting and quality of systematic reviews and meta-analyses in major radiology journals changed since publication of the PRISMA statement?. Radiology 2013; 269: pp. 413-426.
2. Kim K.W., Lee J., Choi S.H., et. al.: Systematic review and meta-analysis of studies evaluating diagnostic test accuracy: a practical review for clinical researchers-part I. General guidance and tips. Korean J Radiol 2015; 16: pp. 1175-1187.
3. Lee J., Kim K.W., Choi S.H., et. al.: Systematic review and meta-analysis of studies evaluating diagnostic test accuracy: a practical review for clinical researchers-part II. Statistical methods of meta-analysis. Korean J Radiol 2015; 16: pp. 1188-1196.
4. Delaney A., Bagshaw S.M., Ferland A., et. al.: A systematic evaluation of the quality of meta-analyses in the critical care literature. Crit Care 2005; 9: pp. R575-R582.
5. Delaney A., Bagshaw S.M., Ferland A., et. al.: The quality of reports of critical care meta-analyses in the Cochrane Database of Systematic Reviews: an independent appraisal. Crit Care Med 2007; 35: pp. 589-594.
6. Luukkonen T.: Bibliometrics and evaluation of research performance. Ann Med 1990; 22: pp. 145-150.
7. Hong S.J., Yoon D.Y., Cho Y.K., et. al.: Characteristics and quality of radiologic randomized controlled trials: a bibliometric analysis between 1995 and 2014. AJR Am J Roentgenol 2016; 206: pp. 917-923.
8. van der Pol C.B., McInnes M.D.F., Petrcich W., et. al.: Is quality and completeness of reporting of systematic reviews and meta-analyses published in high impact radiology journals associated with citation rates?. PLoS ONE 2015; 10: e0119892
9. McGrath T.A., McInnes M.D.F., Korevaar D.A., et. al.: Meta-analyses of diagnostic accuracy in imaging journals: analysis of pooling techniques and their effect on summary estimates of diagnostic accuracy. Radiology 2016; 152229:
10. Cronin P., Rawson J.V.: Review of research reporting guidelines for radiology researchers. Acad Radiol 2016; 23: pp. 537-558.
11. Guyatt G., Rennie D., Meade M., et. al.: Users’ guides to the medical literature: a manual for evidence-based clinical Practice.3rd ed.2014.McGraw-Hill MedicalNew York Chapter in a book
12. Rosenkrantz A.B., Pinnamaneni N., Babb J.S., et. al.: Most common publication types in radiology journals: what is the level of evidence?. Acad Radiol 2016; 23: pp. 628-633.
13. Lim K.J., Yoon D.Y., Yun E.J., et. al.: Characteristics and trends of radiology research: a survey of original articles published in AJR and Radiology between 2001 and 2010. Radiology 2012; 264: pp. 796-802.
14. Fang F.C., Casadevall A.: NIH peer review reform–change we need, or lipstick on a pig?. Infect Immun 2009; 77: pp. 929-932.
15. Ye X.-F., Yu D.-H., He J.: The rise in meta-analyses from China. Epidemiology 2013; 24: pp. 335-336.
16. Ray C.E., Gupta R., Blackwell J.: Changes in the American interventional radiology literature: comparison over a 10-year time period. Cardiovasc Intervent Radiol 2006; 29: pp. 599-604.
17. Stein M.D., Rubenstein L., Wachtel T.J.: Who pays for published research?. JAMA 1993; 269: pp. 781-782.
18. Cronin P., Rawson J.V., Heilbrun M.E., et. al.: How to critically appraise the clinical literature. Acad Radiol 2014; 21: pp. 1117-1128.