
Rationale and Objectives
This novel study aims to investigate texture parameters in distinguishing healthy breast tissue and breast cancer in breast magnetic resonance imaging (MRI). A specific aim was to identify possible differences in the texture characteristics of histological types (lobular and ductal) of invasive breast cancer and to determine the value of these differences for computer-assisted lesion classification.
Materials and Methods
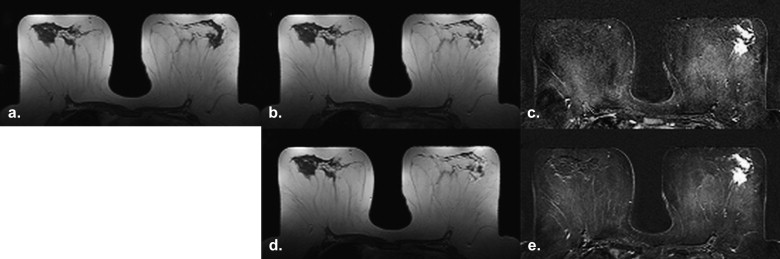
Twenty patients (mean age 50.6 ± SD 10.6; range 37–70 years), with histopathologically proven invasive breast cancer (10 lobular and 10 ductal) were included in this preliminary study. The median MRI lesion size was 25 mm (range, 7–60 mm). The selected T1-weighted precontrast, post-contrast, and subtracted images were analyzed and classified with texture analysis (TA) software MaZda and additional statistical tests were used for testing the parameters separability.
Results
All classification methods employed were able to differentiate between cancer and healthy breast tissue and also invasive lobular and ductal carcinoma with classification accuracy varying between 80% and 100%, depending on the used imaging series and the type of region of interest. We found several parameters to be significantly different between the regions of interest studied. The co-occurrence matrix based parameters proved to be superior to other texture parameters used.
Conclusions
The results of this study indicate that MRI TA differentiates breast cancer from normal tissue and may be able to distinguish between two histological types of breast cancer providing more accurate characterization of breast lesions thereby offering a new tool for radiological analysis of breast MRI.
Breast magnetic resonance imaging (MRI) has gained great importance as a valuable adjunct to both mammography and ultrasound in the detection of primary and recurrent breast cancer over the past 10 years . Breast MRI has excellent sensitivity for the detection of invasive breast cancer. Reported sensitivities are often greater than 90% for invasive cancers using dynamic contrast-enhanced MRI (DCE-MRI) . However, the reported specificities have displayed a high range, varying from 20% to 100% ( ).
The most common pathologic types of invasive breast cancer are invasive lobular carcinoma (ILC), which accounts for 10%–15% of all diagnosed breast carcinomas, and invasive ductal carcinoma (IDC) accounting up to 80% of all breast cancers. The dominating microscopic type IDC “not otherwise specified” is defined as one with no specific pattern in at least 50% of its area. Classic ILC, on the other hand, is defined as one composed of noncohesive cells individually dispersed or arranged in single file linear pattern in a fibrous stroma .
Get Radiology Tree app to read full this article<
Get Radiology Tree app to read full this article<
Get Radiology Tree app to read full this article<
Get Radiology Tree app to read full this article<
Material and methods
Patients
Get Radiology Tree app to read full this article<
Get Radiology Tree app to read full this article<
Table 1
Patient Data: Breast Magnetic Resonance Imaging and Histopathological Findings
Patient no. Age (y) Histology Tumor size ∗ first/second slice (mm) P1 62 IDC 22/26 P2 65 IDC 14/13 P3 45 IDC 21/18 P4 67 IDC 17/19 P5 40 IDC 56/57 P6 46 IDC 8/9 P7 37 IDC 12/11 P8 46 IDC 13/13 P9 62 IDC 35/36 P10 38 IDC 14/15 P11 60 ILC 40/41 P12 44 ILC 7/7 P13 43 ILC 34/37 P14 37 ILC 54/52 P15 48 ILC 60/55 P16 43 ILC 25/28 P17 53 ILC 13/12 P18 58 ILC 32/33 P19 70 ILC 26/30 P20 48 ILC 25/30
IDC, invasive ductal carcinoma; ILC, invasive lobular carcinoma.
Get Radiology Tree app to read full this article<
Get Radiology Tree app to read full this article<
MRI Acquisition
Get Radiology Tree app to read full this article<
Get Radiology Tree app to read full this article<
Texture Analysis and Feature Selection
Image selection
Get Radiology Tree app to read full this article<
Get Radiology Tree app to read full this article<
Regions of interest definition
Get Radiology Tree app to read full this article<
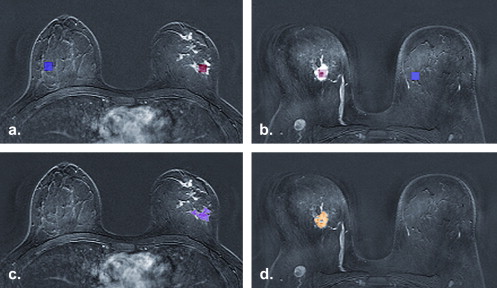
Get Radiology Tree app to read full this article<
Texture features
Get Radiology Tree app to read full this article<
Table 2
Texture Parameters Used in Analysis
Histogram Mean, variance, skewness, kurtosis, percentiles 1%, 10%, 50%, 90%, and 99% Absolute gradient (GrM) Mean, variance, skewness, kurtosis and percentage of pixels with nonzero gradient Co-occurrence matrix (COM) Angular second moment, contrast, correlation, sum of squares, inverse difference moment, sum average, sum variance, sum entropy, entropy, difference variance and difference entropy Run-length matrix (RLM) Run-length nonuniformity, gray-level nonuniformity, long-run emphasis, short run emphasis, and fraction of image in runs Autoregressive model (ARM) Theta: model parameter vector, 4 parameters; Sigma: standard deviation of the driving noise Wavelet Energy of the wavelet coefficients in subbands
Get Radiology Tree app to read full this article<
Get Radiology Tree app to read full this article<
Get Radiology Tree app to read full this article<
Tissue Classification
Get Radiology Tree app to read full this article<
Other Statistical Analyses
Get Radiology Tree app to read full this article<
Results
Tissue Classifications
Get Radiology Tree app to read full this article<
Table 3
Classification Results of Texture Analysis between Tumor Area (std-ROI and Irregular-ROI) and Healthy Reference Area (std-ref ROI) and between Ductal and Lobular Carcinoma (Irregular-ROI IDC vs. Irregular-ROI ILC)
Imaging Sequence Analyzed ROIs PCA LDA NDA Precontrast std-ROI vs. std-ref ROI 6/400 / 400 / 40 irregular-ROI vs. std-ref ROI 4/400 / 400 / 40 Contrast first std-ROI vs. std-ref ROI 1/40 1/40 2/40 irregular-ROI vs. std-ref ROI 4/400 / 400 / 40 Subtraction first std-ROI vs. std-ref ROI 5/400 / 400 / 40 irregular-ROI vs. std-ref ROI0 / 400 / 400 / 40 Contrast last std-ROI vs. std-ref ROI 8/400 / 400 / 40 irregular-ROI vs. std-ref ROI 4/400 / 400 / 40 Subtraction last std-ROI vs. std-ref ROI 1/400 / 400 / 40 irregular-ROI vs. std-ref ROI0 / 400 / 400 / 40 Precontrast irregular-ROI IDC vs. irregular-ROI ILC 7/400 / 40 2/40 Contrast first irregular-ROI IDC vs. irregular-ROI ILC 9/400 / 400 / 40 Subtraction first irregular-ROI IDC vs. irregular-ROI ILC 7/400 / 400 / 40 Contrast last irregular-ROI IDC vs. irregular-ROI ILC 8/400 / 40 2/40 Subtraction last irregular-ROI IDC vs. irregular-ROI ILC 5/40 5/400 / 40
IDC, invasive ductal carcinoma; ILC, invasive lobular carcinoma; PCA, principal component analysis; LDA, linear discriminant analysis; NDA, nonlinear discriminant analysis.
The number of misclassified samples per all analyzed samples is calculated for all imaging sequences. Classification is based on 1-NN for features of principal component analysis (PCA) and linear discriminant analysis (LDA) and artificial neural network for nonlinear discriminant analysis (NDA) features. The best classification results are in bold face.
Get Radiology Tree app to read full this article<
Get Radiology Tree app to read full this article<
Statistical Tests
Cancer tissue versus healthy reference tissue
Get Radiology Tree app to read full this article<
Table 4
The Numbers of Parameters having Statistically Significant Differences ( P < .05) Analyzed with Wilcoxon Test for every Tested Imaging Sequence in each Parameter Group between Healthy Tissue and Cancer Tissue are presented in Columns
Texture Parameter Groups Precontrast Contrast First Subtraction First Contrast Last Subtraction Last std-ROI vs.
std-ref ROI Histogram ( n = 11) 9 0 7 0 8 GrM ( n = 5) 0 0 2 1 2 COM ( n = 220) 20 60 139 70 83 RLM ( n = 20) 2 8 12 15 3 ARM ( n = 5) 1 0 3 1 3 Wavelet ( n = 16) 4 2 10 6 7Total ( n = 277)367017393106 irregular-ROI vs.
std-ref ROI Histogram ( n = 11) 9 0 7 0 9 GrM ( n = 5) 0 1 1 0 0 COM ( n = 220) 75 42 76 64 61 RLM ( n = 20) 5 7 6 12 6 ARM ( n = 5) 1 2 4 2 2 Wavelet ( n = 16) 10 4 9 6 7Total ( n = 277)100561038485
ARM, autoregressive model; COM, co-occurrence matrix; GrM, gradient matrix; RLM, run-length matrix; n , number parameters on each group.
The total number of evaluated texture parameters is 277. The total number of parameters having statistically significant differences is in bold face.
Get Radiology Tree app to read full this article<
Get Radiology Tree app to read full this article<
Invasive ductal carcinoma vs. invasive lobular carcinoma
Get Radiology Tree app to read full this article<
Table 5
The Numbers of Parameters having Statistically Significant Differences ( P < .05) Analyzed with Mann-Whitney U Test for every Tested Imaging Sequence in Each Parameter Group between IDC and ILC are Presented in Columns
Texture Parameter Groups Pre Contrast Contrast First Subtraction First Contrast Last Subtraction Last irregular-ROI IDC vs. irregular-ROI ILC Histogram ( n = 11) 1 0 1 0 0 GrM ( n = 5) 0 0 0 1 0 COM ( n = 220) 4 10 50 38 19 RLM ( n = 20) 0 0 0 0 0 ARM (5) 0 0 0 1 0 Wavelet ( n = 16) 0 0 2 1 1Total ( n = 277)510534120
ARM, autoregressive model; COM, co-occurrence matrix; GrM, gradient matrix; RLM, run-length matrix; n , number parameters on each group.
The total number of evaluated texture parameters is 277. The total number of parameters having statistically significant differences is in bold face.
Get Radiology Tree app to read full this article<
Get Radiology Tree app to read full this article<
Discussion
Get Radiology Tree app to read full this article<
Get Radiology Tree app to read full this article<
Get Radiology Tree app to read full this article<
Get Radiology Tree app to read full this article<
Get Radiology Tree app to read full this article<
Get Radiology Tree app to read full this article<
Get Radiology Tree app to read full this article<
Get Radiology Tree app to read full this article<
Get Radiology Tree app to read full this article<
Get Radiology Tree app to read full this article<
References
1. Morris E.: Diagnostic breast MR imaging: current status and future directions. Radiol Clin N Am 2007; 45: pp. 863-880.
2. Hlawatsch A., Teifke A., Schmidt M., et. al.: Preoperative assessment of breast cancer: sonography versus MR imaging. Am J Roentgenol 2002; 179: pp. 1492-1501.
3. Fischer U., Kopka L., Grabbe E.: Breast carcinoma: effect of preoperative contrast-enhanced MR imaging on the therapeutic approach. Radiology 1999; 213: pp. 881-888.
4. Orel S.G., Schnall M.D.: MR imaging of the breast for the detection, diagnosis, and staging of breast cancer. Radiology 2001; 220: pp. 13-30.
5. Heywang-Koebrunner S.H., Bick U., Bradley W.G.J., et. al.: International investigation of breast MRI: results of a multicentre study (11 sites) concerning diagnostic parameters for contrast-enhanced MRI based on 519 histopathologically correlated lesions. Eur Radiol 2001; 11: pp. 531-546.
6. Warren R.M.L., Pointon L., Thompson D., et. al.: Reading protocol for dynamic contrast-enhanced MR images of the breast: sensitivity and specificity analysis. Radiology 2005; 236: pp. 779-788.
7. Tavassoli F.A.Devilee P.World Health Organization Classification of tumors. Pathology and Genetics of Tumors of the Breast and Female Genital Organs.2003.IARC PressLyon:
8. Nunes L.W., Schnall M.D., Orel S.G., et. al.: Breast MR imaging: interpretation model. Radiology 1997; 202: pp. 833-841.
9. Levrini G., Mori C.A., Vacondio R., et. al.: MRI patterns of invasive lobular cancer: T1 and T2 features. Radiol Med 2008; 113: pp. 1110-1125.
10. Qayyum A., Birdwell R.L., Daniel B.L., et. al.: MR imaging features of infiltrating lobular carcinoma of the breast: histopathologic correlation. AJR Am J Roentgenol 2002; 178: pp. 1227-1232.
11. Weinstein S.P., Orel S.G., Heller R., et. al.: MR imaging of the breast in patients with invasive lobular carcinoma. AJR Am J Roentgenol 2001; 176: pp. 399-406.
12. Jansen S.A., Fan X., Karczmar G.S., et. al.: Differentiation between benign and malignant breast lesions detected by bilateral dynamic contrast-enhanced MRI: a sensitivity and specificity study. Med Phys 2008; 35: pp. 3102-3109.
13. Kuhl C.K., Mielcareck P., Klaschik S., et. al.: Dynamic breast MR imaging: are signal intensity time course data useful for differential diagnosis of enhancing lesions?. Radiology 1999; 211: pp. 101-110.
14. Turnbull L.W.: Dynamic contrast-enhanced MRI in the diagnosis and management of breast cancer. NMR Biomed 2009; 22: pp. 28-39.
15. Tuceryan M., Jain A.K.: Texture analysis.Chen C.H.Pau L.F.Wang P.S.P.The handbook of pattern recognition and computer vision.1998.New Jersey: World Scientific Publishing Copp. 207-248.
16. Castellano G., Bonilha L., Li L.M., et. al.: Texture analysis of medical images. Clin Radiol 2004; 59: pp. 1061-1069.
17. Gupta R., Undrill P.E.: The use of texture analysis to delineate suspicious masses in mammography. Phys Med Biol 1995; 40: pp. 835-855.
18. Bader W., Böhmer S., van Leeuwen P., et. al.: Does texture analysis improve breast ultrasound precision?. Ultrasound Obstet Gynecol 2000; 15: pp. 311-316.
19. Karahaliou A.N., Boniatis I.S., Skiadopoulos S.G., et. al.: Breast cancer diagnosis: analyzing texture of tissue surrounding microcalcifications. IEEE Trans Inf Technol Biomed 2008; 12: pp. 731-738.
20. Gibbs P., Turnbull L.W.: Textural analysis of contrast-enhanced MR images of the breast. Magn Reson Med 2003; 50: pp. 92-98.
21. James D., Clymer B.D., Schmalbrock P.: Texture detection of simulated microcalcification susceptibility effects in magnetic resonance imaging of breasts. J Magn Reson Imaging 2001; 13: pp. 876-881.
22. Chen W., Giger M.L., Li H., et. al.: Volumetric texture analysis of breast lesions on contrast-enhanced magnetic resonance image. Magn Reson Med 2007; 58: pp. 562-571.
23. Woods B.J., Clymer B.D., Kurc T., et. al.: Malignant-lesion segmentation using 4D co- occurrence texture analysis applied to dynamic contrast-enhanced magnetic resonance breast image data. J Magn Reson Imaging 2007; 25: pp. 495-501.
24. Hajek M.Dezortova M.Materka A.Lerski R.Texture analysis for magnetic resonance imaging.2006.Med4publishingPrague:
25. Haralick R.M.: Statistical and structural approach to textures. Proc IEEE 1979; 67: pp. 786-804.
26. Yeh E.D., Slanetz P.J., Edmister W.B., et. al.: Invasive lobular carcinoma: spectrum of enhancement and morphology on magnetic resonance imaging. Breast J 2003; 9: pp. 13-18.
27. Kaiser W.A., Zeitler E.: MR Imaging of the breast: fast imaging sequences with and without Gd-DTPA-preliminary observations. Radiology 1989; 170: pp. 681-686.
28. Kuhl C.K., Bieling H.B., Gieseke J., et. al.: Healthy premenopausal breast parenchyma in dynamic contrast-enhanced MR imaging of the breast: normal contrast medium enhancement and cyclical-phase dependency. Radiology 1997; 203: pp. 137-144.
29. Heywang-Köbrunner S.H., Viehweg P., Heinig A., et. al.: Contrast-enhanced MRI of the breast: accuracy, value, controversies, solutions. Eur J Radiol 1997; 24: pp. 94-108. Review
30. Cohen E.K., Leonhardt C.M., Shumak R.S., et. al.: B. Magnetic resonance imaging in potential postsurgical recurrence of breast cancer: pitfalls and limitations. Can Assoc Radiol J 1996; 47: pp. 171-176.