
Rationale and Objectives
To evaluate the properties of plaque by the use of magnetic resonance imaging (MRI), it is necessary to use a material with stable signal intensity (eg, muscle or submandibular gland) as a reference. However, there may be differences between individuals. Therefore, we used a small phantom set on the circumference of the neck as a reference. The signal intensity ratio (SIR) methods using the phantom as a reference were reviewed for discrimination of the properties of plaque in the carotid artery.
Materials and Methods
Three phantoms (phantom 1: water; phantom 2: 5 μmol gadopentetate dimeglumine; and phantom 3: 2.5 μmol gadopentetate dimeglumine) were set around the neck. SIR was calculated for each region of interest and compared according to pathological grade.
Results
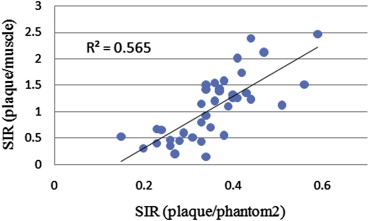
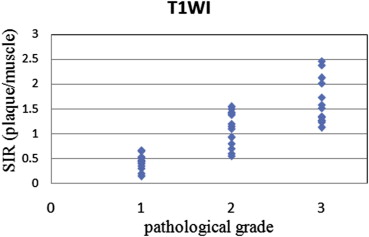
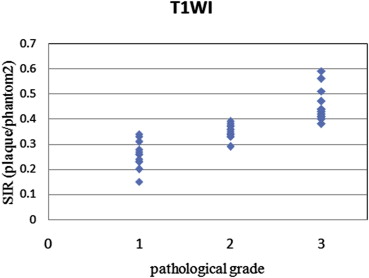
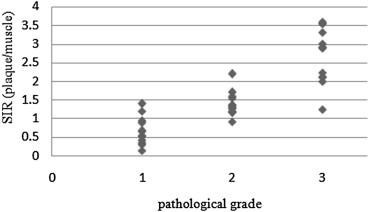
The method using a phantom as a reference reduced the standard deviations of tissue ratios to 0.16 from 0.27 in comparison with the method using muscle and showed a close correlation with pathological grade. In addition, the agreement rates with pathological grade and grades from each SIR using signal intensity of the phantom as a reference were higher than using signal intensity of the muscle as a reference to 0.86 from 0.63 for two-dimensional images and to 0.86 from 0.71 for three-dimensional images.
Conclusions
The method described here reduced error compared to the method using muscle as a reference, and the results were closely correlated with pathological grade.
Atherosclerotic carotid disease is a major cause of cerebral ischemia . It is generally accepted that mildly stenotic plaques with a thin or ruptured fibrous cap, large lipid core, and hemorrhage are more susceptible to rupture than are plaques with a thick cap, high degree of fibrosis, and calcification. Plaque lesions characterized by a lipid-rich necrotic core, by the presence of a thinned fibrous cap, or by intraplaque hemorrhage are regarded as high-risk unstable plaques that are likely to rupture and lead to cerebral ischemia . In 1995, Stary et al defined different atherosclerotic subtypes to allow pathological identification of plaques most likely to cause symptoms. The stepwise progression of atheroma, with or without symptoms, in its later accelerated phase is often associated with intraplaque hemorrhage, thus providing further evidence for the importance of this form of complex plaque in atherosclerotic disease . Therefore, it is important to evaluate not only stenosis rate but also the properties of vulnerable plaque.
Magnetic resonance imaging (MRI) provides a means of noninvasively characterizing and monitoring carotid atherosclerotic lesions over time. The sequences are optimized for vessel wall imaging of the carotid artery for two-dimensional (2D) black-blood (BB) imaging using double inversion recovery preparations and for three-dimensional (3D) BB imaging with 3D fast spin echo (FSE) with variable refocusing pulse using small flip angle . High-risk plaques (soft and intraplaque hemorrhage) show high signal intensity on fat suppression T1-weighted images (T1WI) and/or fat suppression T2-weighted images (T2WI) . To evaluate the properties of plaque, it is necessary to perform normalization relative to a material with stable signal intensity, because the signal intensity on MRI changes with the signal gain.
Get Radiology Tree app to read full this article<
Materials and methods
Get Radiology Tree app to read full this article<
Patients
Get Radiology Tree app to read full this article<
Phantoms
Get Radiology Tree app to read full this article<
Pathological Grade Classification
Get Radiology Tree app to read full this article<
Get Radiology Tree app to read full this article<
MRI Protocol
Get Radiology Tree app to read full this article<
Image Analysis
Get Radiology Tree app to read full this article<
Get Radiology Tree app to read full this article<
Get Radiology Tree app to read full this article<
SIR(plaque/muscle)=signalintensityofplaque/signalintensityofmuscle SIR
(
plaque
/
muscle
)
=
signal
intensity
of
plaque
/
signal
intensity
of
muscle
SIR(plaque/phantom2)=signalintensityofplaque/signalintensityof5μmolGd−DTPAphantom SIR
(
plaque
/
phantom
2
)
=
signal
intensity
of
plaque
/
signal
intensity
of
5
μmol
Gd
-
DTPA
phantom
Get Radiology Tree app to read full this article<
Get Radiology Tree app to read full this article<
Get Radiology Tree app to read full this article<
![Figure 1, Images of T1-weighted carotid artery wall and three phantoms: (A) phantom 1 (water), (B) phantom 2 (5 μmol gadopentetate dimeglumine [Gd-DTPA]), and (C) phantom 3 (2.5 μmol Gd-DTPA).](https://storage.googleapis.com/dl.dentistrykey.com/clinical/CharacterizationofCarotidArteryPlaqueComponentsonMagneticResonanceImagingUsingSignalIntensityofthePhantomasaReference/0_1s20S1076633213004054.jpg)
Get Radiology Tree app to read full this article<
Get Radiology Tree app to read full this article<
Table 1
Grade Classification Using Signal Intensity Ratio (SIR)
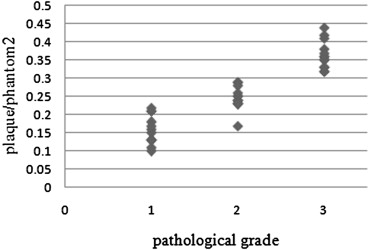
2D-Spin Echo BB T1WI 3D T1WI SIR(plaque/muscle) SIR(plaque/phantom 2) SIR (plaque/muscle) SIR (plaque/phantom 2) Grade 3 SIR>1.25 SIR>0.4 SIR>2 SIR>0.3 Grade 2 1.25 > SIR>0.5 0.4 > SIR>0.3 2 > SIR>2 0.3 > SIR>0.2 Grade 1 0.5 > SIR 0.3 > SIR 1 > SIR 0.2 > SIR
2D, two-dimensional; 3D, three-dimensional; BB, black-blood; T1WI, T1-weighted imaging.
Get Radiology Tree app to read full this article<
Get Radiology Tree app to read full this article<
Results
Get Radiology Tree app to read full this article<
![Figure 2, Standard deviations (SDs) of tissue ratios (muscle/submandibular [s.] gland, water/phantom 2, and phantom 2/phantom 3) in 52 patients. The SDs of tissue ratios were (muscle/s. gland) = 0.272, (plaque/phantom 2) = 0.161, and (phantom 3/phantom 2) = 0.165.](https://storage.googleapis.com/dl.dentistrykey.com/clinical/CharacterizationofCarotidArteryPlaqueComponentsonMagneticResonanceImagingUsingSignalIntensityofthePhantomasaReference/1_1s20S1076633213004054.jpg)
![Figure 3, Standard deviations (SDs) of tissue ratios (muscle/phantom 2) on T1-weighted imaging (T1WI), (submandibular [S] gland/phantom 1) on T2WI, and (phantom 3/phantom 2) on T2WI in 52 patients. The SDs of tissue ratios were (muscle/phantom 2) on T1WI = 0.192, (S gland/phantom 1) on T2WI = 0.284, and (phantom 3/phantom 2) on T2WI = 0.074.](https://storage.googleapis.com/dl.dentistrykey.com/clinical/CharacterizationofCarotidArteryPlaqueComponentsonMagneticResonanceImagingUsingSignalIntensityofthePhantomasaReference/2_1s20S1076633213004054.jpg)
Get Radiology Tree app to read full this article<
Get Radiology Tree app to read full this article<
Get Radiology Tree app to read full this article<
Get Radiology Tree app to read full this article<
Get Radiology Tree app to read full this article<
Get Radiology Tree app to read full this article<
Get Radiology Tree app to read full this article<
Get Radiology Tree app to read full this article<
Table 2
Agreement Rates with Grades from Each Signal Intensity Ratio (SIR) and Pathological Grade
2D-Spin Echo BB T1WI 3D T1WI SIR (plaque/phantom 2) SIR (plaque/muscle) SIR (plaque/phantom 2) SIR (plaque/muscle) 0.86 0.63 0.86 0.71
2D, two-dimensional; 3D, three-dimensional; BB, black-blood; T1WI, T1-weighted imaging.
Get Radiology Tree app to read full this article<
Discussion
Get Radiology Tree app to read full this article<
Get Radiology Tree app to read full this article<
Get Radiology Tree app to read full this article<
Get Radiology Tree app to read full this article<
Get Radiology Tree app to read full this article<
Get Radiology Tree app to read full this article<
Get Radiology Tree app to read full this article<
Get Radiology Tree app to read full this article<
Get Radiology Tree app to read full this article<
Get Radiology Tree app to read full this article<
Get Radiology Tree app to read full this article<
Conclusions
Get Radiology Tree app to read full this article<
Get Radiology Tree app to read full this article<
Get Radiology Tree app to read full this article<
References
1. Mohamed O.H., Zwenneke F., Thomas T.W., et. al.: Carotid plaque composition and cerebral infarction: MR imaging study. AJNR Am J Neuroradiol 2005; 26: pp. 1044-1049.
2. Falk E., Shah P.K., Fuster V.: Coronary plaque disruption. Circulation 1995; 92: pp. 657-671.
3. Stary H.C., Chandler A.B., Dinsmore R.E., et. al.: A definition of advanced types of atherosclerotic lesions and a histological classification of atherosclerosis. A report from the Committee on Vascular Lesions of the Council on Arteriosclerosis, American Heart Association. Circulation 1995; 92: pp. 1355-1374.
4. Cai J.M., Hatsukami T.S., Ferguson M.S., et. al.: Classification of human carotid atherosclerotic lesions with in vivo multicontrast magnetic resonance imaging. Circulation 2002; 106: pp. 1368-1373.
5. Watanabe Y., Nagayama M.: MR plaque imaging of the carotid artery. Neuroradiology 2010; 52: pp. 252-274.
6. Saam T., Ferguson M.S., Yarnykh V.L., et. al.: Quantitative evaluation of carotid plaque composition by in vivo MRI. Arterioscler Thromb Vasc Biol 2005; 25: pp. 234-239.
7. David C.Z., Anthony T.V., Ota H., et. al.: An optimized 3D spoiled gradient recalled echo pulse sequence for hemorrhage assessment using inversion recovery and multiple echoes (3D SHINE) for carotid plaque imaging. Magn Reson Med 2010; pp. 1341-1351.
8. Esposito L., Saam T., Heider P., et. al.: MRI plaque imaging reveals high-risk carotid plaques especially in diabetic patients irrespective of the degree of stenosis. BMS Med Imaging 2010; 10: pp. 27.
9. Moody A.R., Murphy R.E., Morgan P.S., et. al.: Characterization of complicated carotid plaque with magnetic resonance direct thrombus imaging in patients with cerebral ischemia. Circulation 2003; 24: pp. 3047-3052.
10. Teng Z., Sadat U., Ji G., et. al.: Lumen irregularity dominates the relationship between mechanical stress condition, fibrous-cap thickness, and lumen curvature in carotid atherosclerotic plaque. J Biomech 2011; 133:
11. Beaussier H., Naggara O., Calvet D., et. al.: Mechanical and structural characteristics of carotid plaques by combined analysis with echotracking system and MR imaging. JACC 2011; 4: pp. 468-477.
12. Kwee R.M., Oostenbrugge R.J., Mess W.H., et. al.: Carotid plaques in transient ischemic attack and stroke patients. Investig Radiol 2010; 45: pp. 803-809.
13. Noguchi T., Yamada N., Higashi M., et. al.: High-intensity signals in carotid plaques on T1-weighted magnetic resonance imaging predict coronary events in patients with coronary artery disease. JACC 2011; 58: pp. 416-422.
14. Yuan C., Mitsumori L.M., Beach K.W., et. al.: Carotid atherosclerotic plaque: noninvasive MR characterization of vulnerable lesions. Radiology 2001; 221: pp. 285-299.
15. Toussaint J.F., LaMuraglia G.M., Southern J.F., et. al.: Magnetic resonance images lipid, fibrous, calcified, hemorrhagic, and thrombotic components of human atherosclerosis in vivo. Circulation 1996; 94: pp. 932-938.
16. Yuan C., Mitsumori L.M., Ferguson M.S., et. al.: In vivo accuracy of multispectral magnetic resonance imaging for identifying lipid-rich necrotic cores and intraplaque hemorrhage in advanced human carotid plaques. Circulation 2001; 23: pp. 2051-2056.
17. Hennig J., Weigel M., Scheffler K.: Multiecho sequences with variable refocusing flip angles: optimization of signal behavior using smooth transitions between pseudo steady state (TRAPS). Magn Reson Med 2003; 49: pp. 527-535.
18. Busse R.F., Hariharan H., Vu A., et. al.: Fast spin echo sequences with very long echo trains: design of variable refocusing flip angle schedules and generation of clinical T2 contrast. Magn Reson Med 2006; 55: pp. 1030-1037.
19. Chu B., Kampshulte A., Ferguson M.S., et. al.: Hemorrhage in the atherosclerotic carotid plaque: a high-resolution MRI study. Stroke 2004; pp. 1079-1084.
20. Yamada N., Higashi M., Otsubo R., et. al.: Association between signal hyperintensity on T1-weighted MR imaging of carotid plaques and ipsilateral ischemic events. AJNR Am J Neuroradiol 2007; 28: pp. 287-292.
21. Kurosaki Y., Yoshida K., Endo H., et. al.: Association between carotid atherosclerosis plaque with high signal intensity on T1-weighted imaging and subsequent ipsilateral ischemic events. Neurosurgery 2011; 68: pp. 62-67.
22. Arai D., Yamaguchi S., Murakami M., et. al.: Characteristics of carotid plaque findings on ultrasonography and black blood magnetic resonance imaging in comparison with pathological findings. Acta Neurochir Suppl 2011; 112: pp. 15-19.
23. Zainon R., Ronaldson J.P., Janmal T., et. al.: Spectral CT of carotid atherosclerotic plaque: comparison with histology. Eur Radiol 2012; 22: pp. 2581-2588.
24. Gaens M.E., Backes W.H., Rozel S., et. al.: Dynamic contrast-enhanced MR imaging of carotid atherosclerotic plaque: model selection, reproducibility, and validation. Radiology 2012; 266: pp. 271-279.
25. Keenan N.G., Grasso A., Locca D., et. al.: Comparison of 2D and multislab 3D magnetic resonance techniques for measuring carotid wall volumes. J Magn Reson Imaging 2008; 28: pp. 1476-1482.
26. Zhu D.C., Anthony T.V., Ota H., et. al.: An optimized 3D spoiled gradient recalled echo pulse sequence for hemorrhage assessment using inversion recovery and multiple echoed (3D SHINE) for carotid plaque imaging. Magn Reson Med 2010; 64: pp. 1341-1351.
27. Balu N., Yarnykh V.L., Chu B., et. al.: Carotid plaque assessment using fast 3D isotropic resolution black-blood MRI. Magn Reson Med 2011; 65: pp. 627-637.