
Rational and Objectives
This study aims to investigate the performance of a whole-body, photon-counting detector (PCD) computed tomography (CT) system in differentiating urinary stone composition.
Materials and Methods
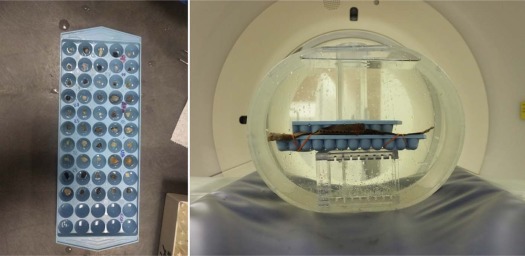
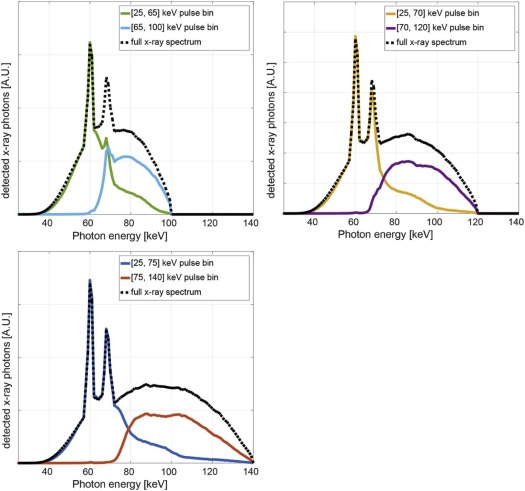
Eighty-seven human urinary stones with pure mineral composition were placed in four anthropomorphic water phantoms (35–50 cm lateral dimension) and scanned on a PCD-CT system at 100, 120, and 140 kV. For each phantom size, tube current was selected to match CTDI vol (volume CT dose index) to our clinical practice. Energy thresholds at [25, 65], [25, 70], and [25, 75] keV for 100, 120, and 140 kV, respectively, were used to generate dual-energy images. Each stone was automatically segmented using in-house software; CT number ratios were calculated and used to differentiate stone types in a receiver operating characteristic (ROC) analysis. A comparison with second- and third-generation dual-source, dual-energy CT scanners with conventional energy integrating detectors (EIDs) was performed under matching conditions.
Results
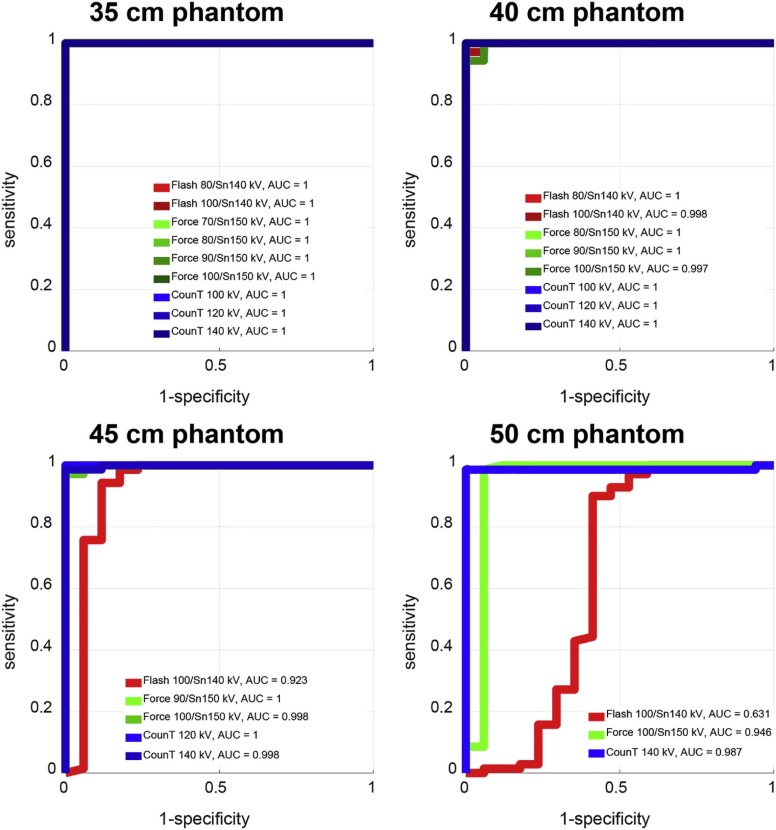
For all investigated settings and smaller phantoms, perfect separation between uric acid and non–uric acid stones was achieved (area under the ROC curve [AUC] = 1). For smaller phantoms, performance in differentiation of calcium oxalate and apatite stones was also similar between the three scanners: for the 35-cm phantom size, AUC values of 0.76, 0.79, and 0.80 were recorded for the second- and third-generation EID-CT and for the PCD-CT, respectively. For larger phantoms, PCD-CT and the third-generation EID-CT outperformed the second-generation EID-CT for both differentiation tasks: for a 50-cm phantom size and a uric acid/non–uric acid differentiating task, AUC values of 0.63, 0.95, and 0.99 were recorded for the second- and third-generation EID-CT and for the PCD-CT, respectively.
Conclusion
PCD-CT provides comparable performance to state-of-the-art EID-CT in differentiating urinary stone composition.
Introduction
Conventional x-ray computed tomography (CT) systems rely on energy integrating detectors (EIDs), which generate an output signal that is proportional to the amount of energy deposited by the detected x-ray. Therefore, EID-CT systems inherently penalize the contribution of low-energy x-ray photons, which are the photons that carry the most contrast information for biological tissues and contrast media.
In recent years, a number of preclinical photon-counting detector (PCD) CT systems were introduced . Unlike EID-CT, PCD-CT systems directly convert each detected x-ray photon into individual pulses with amplitudes proportional to the energy of the incoming photon. Each individual pulse is counted separately through the use of fast electronics. The equal contribution of each detected photon regardless of their energy , combined with a reduced influence of electronic noise, results in improved contrast-to-noise ratio for PCD-CT when compared to EID-CT techniques . Additionally, PCD-CT can provide acquisitions with full field-of-view (FOV), fully registered data, stability against motion artifacts, no cross scatter from a second x-ray tube, and the ability to configure more than two energy thresholds. Finally, all measurements provide multienergy information, enabling the application of dual-energy or multienergy postprocessing algorithms for every scan.
Get Radiology Tree app to read full this article<
Get Radiology Tree app to read full this article<
Materials and Methods
Get Radiology Tree app to read full this article<
Stone Samples
Get Radiology Tree app to read full this article<
Get Radiology Tree app to read full this article<
PCD-CT Data Acquisition and Reconstruction
Get Radiology Tree app to read full this article<
Get Radiology Tree app to read full this article<
Get Radiology Tree app to read full this article<
TABLE 1
Acquisition Parameters for Photon-counting Detector Computed Tomography Scans
Tube Potential (kVp) 100 120 140 Phantom sizes scanned (cm) 35, 40 35, 40, 45 35, 40, 45, 50 Energy thresholds (keV) 25, 65 25, 70 25, 75 Detector collimation (mm) 32 × 0.5 Rotation time (s) 0.5 Helical pitch 0.6
Get Radiology Tree app to read full this article<
Get Radiology Tree app to read full this article<
Image Processing and Classification Analysis
Get Radiology Tree app to read full this article<
Get Radiology Tree app to read full this article<
Comparison with State-of-the-art dual-source, dual-energy CT
Get Radiology Tree app to read full this article<
Results
Dose and Image Quality for PCD-CT System
Get Radiology Tree app to read full this article<
TABLE 2
CTDI vol for Each of the Phantom Sizes Investigated
LAT Phantom Size (cm) CTDI vol (mGy) 35 13.5 40 19.9 45 33.4 50 45.0
CT, computed tomography; CTDI vol , volume CT dose index.
CTDI vol was matched among all three CT systems investigated.
Get Radiology Tree app to read full this article<
Differentiation of Kidney Stones
Get Radiology Tree app to read full this article<
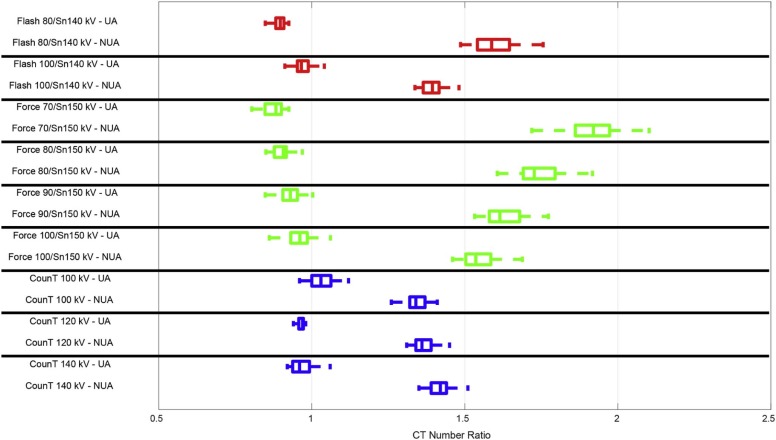
TABLE 3
Absolute Difference (ΔCTR) Between Mean CTR for Uric Acid ( n = 17) vs Non–Uric Acid ( n = 70) Stones
CT System Tube Potential (kV) Phantom Size (cm) 35 40 45 50 EID-CT1 80/Sn140 0.69 0.62 100/Sn140 0.42 0.30 0.23 0.05 EID-CT2 70/Sn150 1.03 80/Sn150 0.83 0.78 90/Sn150 0.70 0.64 0.62 100/Sn150 0.58 0.50 0.52 0.43 PCD-CT 100 0.30 0.30 120 0.39 0.35 0.35 140 0.44 0.41 0.37 0.35
As phantom size increased, not all tube potential pairs could be used.
Get Radiology Tree app to read full this article<
Get Radiology Tree app to read full this article<
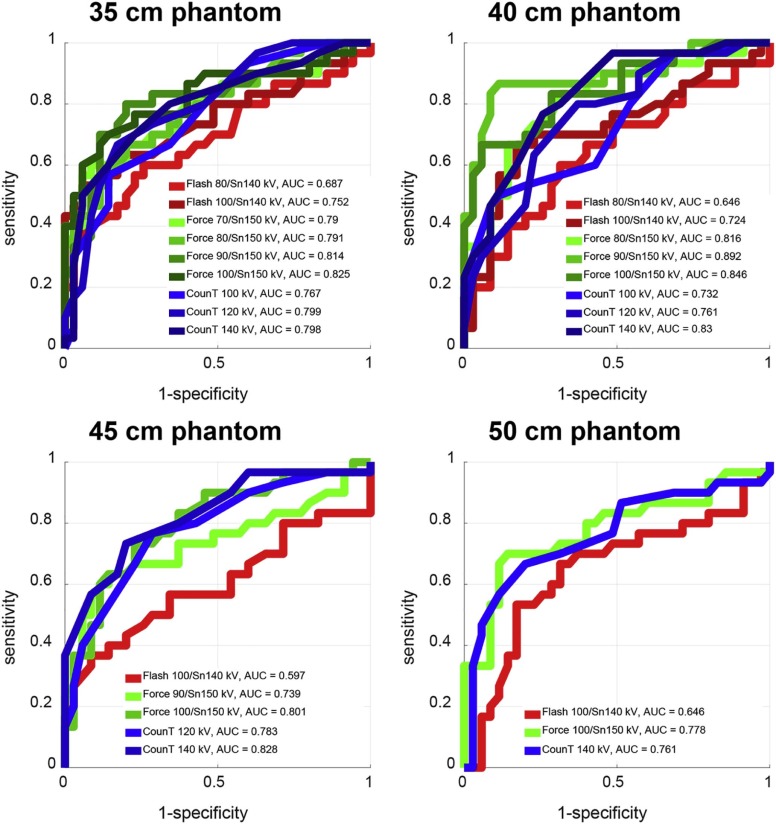
TABLE 4
Absolute Difference (ΔCTR) Between Mean CTR for Calcium Oxalate ( n = 35) vs Apatite ( n = 30) Stones
CT System Tube Potential (kV) Phantom Size (cm) 35 40 45 50 EID-CT1 80/Sn140 0.05 0.03 \* \* 100/Sn140 0.04 0.03 0.01 0.01 EID-CT2 70/Sn150 0.11 \* \* \* 80/Sn150 0.08 0.10 \* \* 90/Sn150 0.08 0.09 0.07 \* 100/Sn150 0.04 0.08 0.08 0.08 PCD-CT 100 0.02 0.03 \* \* 120 0.04 0.03 0.04 \* 140 0.03 0.05 0.05 0.03
Get Radiology Tree app to read full this article<
Get Radiology Tree app to read full this article<
Discussion
Get Radiology Tree app to read full this article<
Get Radiology Tree app to read full this article<
Get Radiology Tree app to read full this article<
Get Radiology Tree app to read full this article<
Get Radiology Tree app to read full this article<
Get Radiology Tree app to read full this article<
Get Radiology Tree app to read full this article<
Get Radiology Tree app to read full this article<
References
1. Shikhaliev P.M.: Computed tomography with energy-resolved detection: a feasibility study. Phys Med Biol 2008; 53: pp. 1475.
2. Taguchi K., Iwanczyk J.S.: Vision 20/20: single photon counting x-ray detectors in medical imaging. Med Phys 2013; 40: pp. 100901.
3. Altman A., Carmi R.: TU-E-210A-03: a double-layer detector, dual-energy CT—principles, advantages and applications. Med Phys 2009; 36: pp. 2750.
4. Giersch J., Niederlöhner D., Anton G.: The influence of energy weighting on X-ray imaging quality. Nucl Instrum Methods Phys Res A 2004; 531: pp. 68-74.
5. Schmidt T.G.: Optimal “image-based” weighting for energy-resolved CT. Med Phys 2009; 36: pp. 3018-3027.
6. Gutjahr R., Halaweish A.F., Yu Z., et. al.: Human imaging with photon counting–based computed tomography at clinical dose levels: contrast-to-noise ratio and cadaver studies. Invest Radiol 2016; 51: pp. 421-429.
7. Kappler S., Glasser F., Janssen S., et. al.: A research prototype system for quantum-counting clinical CT. Proc SPIE 2010; 7622: pp. 76221Z.
8. Kappler S., Henning A., Krauss B., et. al.: Multi-energy performance of a research prototype CT scanner with small-pixel counting detector. Proc SPIE 2013; 8668: pp. 86680O.
9. Yu Z., Leng S., Jorgensen S.M., et. al.: Evaluation of conventional imaging performance in a research whole-body CT system with a photon-counting detector array. Phys Med Biol 2016; 61: pp. 1572.
10. Marcus R., Fletcher J., Sheedy S., et. al.: Photon-counting-detector CT for the evaluation of non-contrast enhanced abdominal imaging in patients.Radiological Society of North America 2016 scientific assembly and annual meeting, November 27–December 2, 2016, Chicago IL.2016.
11. Pourmorteza A., Symons R., Sandfort V., et. al.: Abdominal imaging with contrast-enhanced photon-counting CT: first human experience. Radiology 2016; 279: pp. 239-245.
12. Vrtiska T.J., Takahashi N., Fletcher J.G., et. al.: Genitourinary applications of dual-energy CT. AJR Am J Roentgenol 2010; 194: pp. 1434-1442.
13. Zarse C.A., McAteer J.A., Sommer A.J., et. al.: Nondestructive analysis of urinary calculi using micro computed tomography. BMC Urol 2004; 4: pp. 1.
14. Yu Z., Leng S., Li Z., et. al.: How low can we go in radiation dose for the data-completion scan on a research whole-body photon-counting computed tomography system. J Comput Assist Tomogr 2016; 40: pp. 663-670.
15. Duan X., Wang J., Qu M., et. al.: Kidney stone volume estimation from computerized tomography images using a model based method of correcting for the point spread function. J Urol 2012; 188: pp. 989-995.
16. Duan X., Li Z., Yu L., et. al.: Characterization of urinary stone composition by use of third-generation dual-source dual-energy CT with increased spectral separation. AJR Am J Roentgenol 2015; 205: pp. 1203.
17. Marcus R., Fletcher J., Vrtiska T., et. al.: Detection and characterization of urinary stones using photon-counting-detector CT in a clinical setting.Radiological Society of North America 2016 scientific assembly and annual meeting, November 27–December 2, 2016, Chicago IL.2016.