
Rationale and Objectives
To investigate the contribution of chemical shift magnetic resonance imaging for assessment of the margins of solid breast masses by benefiting from India ink artifact.
Methods and Materials
Eighty-eight masses in 64 patients were evaluated in T1- and T2-weighted images, dynamic contrast and chemical shift studies according to Breast Imaging Reporting and Data System magnetic resonance lexicon. Subtraction images were automatically obtained by chemical shift imaging and dynamic studies. Each sequence was scored using a scale of 1 to 5 according to its ability to demonstrate margins separate from surrounding parenchyma. Breast parenchyma was evaluated as fatty and dense. The results were compared with the histopathologic results.
Results
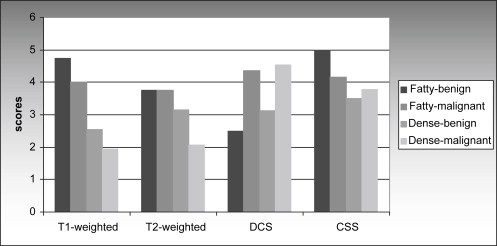
Twenty-eight (31.8%) of the lesions were localized in fatty breast, and the remaining 60 (68.2%) lesions were localized in dense breast. There were 34 (38.6%) benign and 54 (61.4%) malignant masses. In fatty breast, chemical shift subtraction and T1-weighted images were valuable both for the demonstration and differentiation of benign lesions ( P < .05). None of the sequence was valuable for both the demonstration and differentiation of malignant lesions in fatty breasts ( P > .05). In dense breasts, chemical shift subtraction and dynamic contrast subtraction images were valuable for both the demonstration and differentiation of benign and malignant lesions. Additional to these sequences, T2-weighted images was also valuable for benign lesions ( P < .05).
Conclusion
Chemical shift subtraction can contribute to routine dynamic contrast subtraction in morphologic analysis particularly for the evaluation of margins of benign lesions in fatty breasts. It can also help in morphologic analysis of masses in dense breast.
Magnetic resonance imaging (MRI) has become an important modality in the breast imaging practice. MRI has a higher sensitivity of detection of breast cancer than mammography and ultrasonography (US) . But approximately, 8%–10% of invasive breast cancers cannot be detected. Along with the technical factors, varying degrees of contrast enhancement of different lesions and excessive enhancement of glandular tissue may be the causes of missed cancers . Both morphologic and enhancement characteristics are used for the evaluation of the lesions . Subtraction method is used for better evaluation of morphology and enhancement characteristics of the lesions.
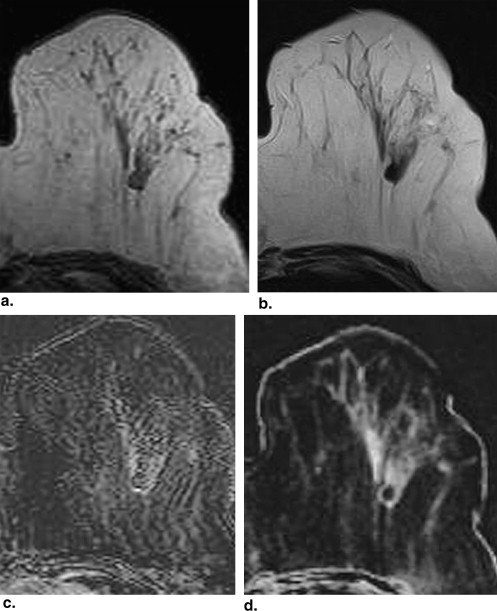
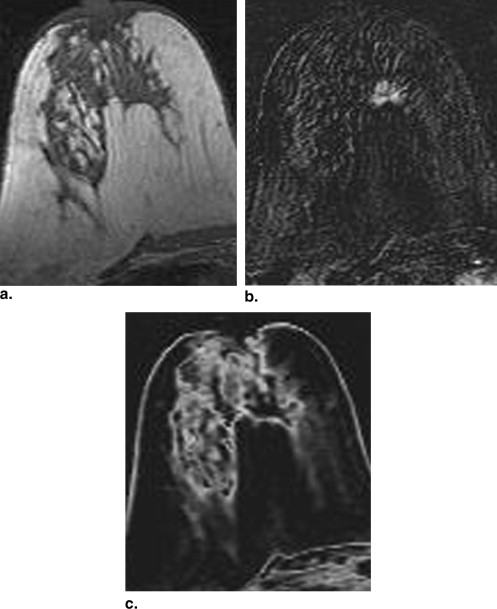
Chemical-shift MRI is based on the fact that hydrogen atoms of water and fat molecules have different precession frequencies . Chemical shift subtraction (CSS) technique is obtained by subtracting in-phase images from out-phase images. CSS, which gives information about the fat content of the lesion and surrounding structures, has been successfully used in the differentiation of fat-containing adenomas of adrenal gland . Chemical shift imaging includes two types of margin artifacts: chemical shift artifact and India ink artifact. Chemical shift artifact, also known as misregistration artifact, occurs as a result of misregistration of signal across the frequency-encoding direction because of signals failing to part from desired spatial frequency encoding due to different resonance frequencies in water and fat. India ink artifact is seen due to water and fat protons existing in the same voxel. In voxels localized in close proximity to water-fat interfaces, water and fat protons exist at similar ratios, and because those spins exhibit a 180° opposed direction in out-phase, signal loss occurs (phase cancellation). In out-phase image, interface areas appear black as if drawn by India ink because of signal loss. This is known as India ink artifact, or fat water artifact or black lining artifact . Because of the India ink artifact, the margin of a mass containing no fat appears as black at the mass-surrounding fat interface on out-phase image ( Fig. 1 ). On the subtraction image obtained from subtraction of out-phase image from in-phase image, mass is seen as black and margin is seen bright making it more obvious from surrounding structures ( Fig. 1 ).
 Open full size image
Figure 1
Chemical shift imaging. (a) In-phase. (b) Out-phase images. India ink artifact is seen as a black line on the interface areas of fat-water. (c) Subtraction image. Interface areas of fat-water are seen as a well-defined bright line. Breast is fatty.
Get Radiology Tree app to read full this article<
Get Radiology Tree app to read full this article<
Materials and methods
Patients
Get Radiology Tree app to read full this article<
MRI Technique
Get Radiology Tree app to read full this article<
Get Radiology Tree app to read full this article<
Analysis of the Images
Get Radiology Tree app to read full this article<
Get Radiology Tree app to read full this article<
Histopathologic Correlation
Get Radiology Tree app to read full this article<
Statistical Analysis
Get Radiology Tree app to read full this article<
Results
Get Radiology Tree app to read full this article<
Get Radiology Tree app to read full this article<
Table 1
Histopathology of Lesions ( n = 88)
Benign ( n = 34) Fibroadenoma 21 Fibrocystic changes 5 Intraductal papilloma 2 Focal fibrosis 2 Fat necrosis 2 Reactive lymphoid hyperplasia 1 Mastitis 1 Malignant ( n = 54) Invasive ductal carcinoma 45 Invasive lobular carcinoma 4 Invasive carcinoma with ductal and lobular features 2 Medullar carcinoma 1 Papillary carcinoma 1 Tubular carcinoma 1 Total ( n = 88)
Get Radiology Tree app to read full this article<
Get Radiology Tree app to read full this article<
Table 2
Distribution of Final Radiologic Diagnosis of Lesions ( n = 88) on each Sequence
Fatty and Dense Breast T1-weighted T2-weighted DCS CSS Benign Malignant Inadequate Benign Malignant Inadequate Benign Malignant Inadequate Benign Malignant Inadequate Benign 15 2 17 19 3 12 12 6 16 22 3 9 Malignant 2 21 31 3 19 32 3 46 5 5 35 14P value <.001 <.001 .496 <.001 .005 .028 <.001 <.001 <.001 <.001 <.001 .963 Fatty Breast T1-weighted T2-weighted DCS CSS Benign Malignant Inadequate Benign Malignant Inadequate Benign Malignant Inadequate Benign Malignant Inadequate Benign 5 2 1 4 2 2 0 3 5 5 3 0 Malignant 2 14 4 3 12 5 1 16 3 2 14 4P value .009 .044 1.00 .142 .209 1.00 1.00 .068 .022 .009 .199 .294 Dense Breast T1-weighted T2-weighted DCS CSS Benign Malignant Inadequate Benign Malignant Inadequate Benign Malignant Inadequate Benign Malignant Inadequate Benign 10 0 16 15 1 10 12 3 11 17 0 9 Malignant 0 7 27 0 7 27 2 30 2 3 21 10P value <.001 .015 .127 <.001 .121 .001 <.001 <.001 <.001 <.001 <.001 .667
DCS: dynamic contrast subtraction; CSS: chemical shift subtraction.
Get Radiology Tree app to read full this article<
Get Radiology Tree app to read full this article<
Get Radiology Tree app to read full this article<
Get Radiology Tree app to read full this article<
Get Radiology Tree app to read full this article<
Get Radiology Tree app to read full this article<
Get Radiology Tree app to read full this article<
Get Radiology Tree app to read full this article<
Get Radiology Tree app to read full this article<
Get Radiology Tree app to read full this article<
Get Radiology Tree app to read full this article<
Discussion
Get Radiology Tree app to read full this article<
Get Radiology Tree app to read full this article<
Get Radiology Tree app to read full this article<
Get Radiology Tree app to read full this article<
Get Radiology Tree app to read full this article<
Get Radiology Tree app to read full this article<
Get Radiology Tree app to read full this article<
References
1. Erguvan-Dogan B., Whitman G.J., Kushwaha A.C., et. al.: BI-RADS-MRI: a primer. AJR Am J Roentgenol 2006; 187: pp. 152-160.
2. Tozaki M., Fukuda K.: High-spatial-resolution MRI of non-masslike breast lesions: interpretation model based on BI-RADS MRI descriptors. AJR Am J Roentgenol 2006; 187: pp. 330-337.
3. Ghai S., Muradali D., Bukhanov K., et. al.: Nonenhancing breast malignancies on MRI: sonographic and pathologic correlation. AJR Am J Roentgenol 2005; 185: pp. 481-487.
4. Rausch D.R., Hendrick R.E.: How to optimize clinical breast MR imaging practices and techniques on your 1.5-T system. Radiographics 2006; 26: pp. 1469-1484.
5. Gilles R., Guinebretiere J.M., Lucidarme O., et. al.: Nonpalpable breast tumors: diagnosis with contrast-enhanced subtraction dynamic MR imaging. Radiology 1994; 191: pp. 625-631.
6. Boetes C., Strijk S.P., Holland R., et. al.: False-negative MR imaging of malignant breast tumors. Eur Radiol 1997; 7: pp. 1231-1234.
7. Teifke A., Hlawatsch A., Beier T., et. al.: Undetected malignancies of the breast: dynamic contrast-enhanced MR imaging at 1.0 T. Radiology 2002; 224: pp. 881-888.
8. Hood M.N., Ho V.B., Smirniotopoulos J.G., et. al.: Chemical shift: the artifact and clinical tool revisited. Radiographics 1999; 19: pp. 357-371.
9. Gabriel H., Pizzitola V., McComb E.N., et. al.: Adrenal lesions with heterogeneous suppression on chemical shift imaging: clinical implications. J Magn Reson Imaging 2004; 19: pp. 308-316.
10. Gabriel H., Pizzitola V., McComb E.N., et. al.: Fat in liver metastasis from renal cell carcinoma detected by chemical shift MR imaging. J Magn Reson Imaging 2004; 19: pp. 308-316.
11. Yu J.S., Rofsky N.M.: Dynamic subtraction MR imaging of the liver: advantages and pitfalls. AJR Am J Roentgenol 2003; 180: pp. 1351-1357.
12. Savci G., Yazici Z., Sahin N., et. al.: Value of chemical shift subtraction MRI in characterization of adrenal masses. AJR Am J Roentgenol 2006; 186: pp. 130-135.
13. Israel G.M., Hindman N., Hecht E., et. al.: The use of opposed-phase chemical shift MRI in the diagnosis of renal angiomyolipomas. AJR Am J Roentgenol 2005; 184: pp. 1868-1872.
14. American College of Radiology: Breast imaging reporting and data system atlas (BI-RADS atlas).2003.American College of RadiologyReston, VA
15. Nunes L.W., Schnall M.D., Orel S.G., et. al.: Correlation of lesion appearance and histologic findings for the nodes of a breast MR imaging interpretation model. RadioGraphics 1999; 19: pp. 79-92.
16. Stavros A.T.: Ultrasound of solid breast nodules: distinguishing benign from malignant.Stavros A.T.Breast ultrasound.2004.Lippincott Williams & WilkinsPhiladelphia, PA:pp. 445-527.
17. Hong A.S., Rosen E.L., Soo M.S., Baker J.A.: BI-RADS for sonography: positive and negative predictive values of sonographic features. AJR Am J Roentgenol 2005; 184: pp. 1260-1265.
18. Stavros A.T., Thickman D., Rapp C.L., et. al.: Solid breast nodules: use of sonography to distinguish between benign and malignant lesions. Radiology 1995; 196: pp. 123-134.
19. Reichenbach J.R., Hopfe J., Rauscher A., et. al.: Subtraction of in-phase and opposed-phase images in dynamic MR mammography. J Magn Reson Imaging 2005; 21: pp. 565-575.