
Rationale and Objectives
Chest computed tomographic (CT) scans are the most effective examinations for detecting lung cancer at an early stage. In chest CT examinations, it is important to consider the reduction of radiation dose, particularly to the mammary gland. The objective of this study was to assess breast doses and effective doses on chest CT examinations between three-dimensional and z -axis automatic tube current modulation (ATCM) techniques.
Materials and Methods
Absorbed dose to the breast, lung, mediastinum, and skin was evaluated with an anthropomorphic phantom and radiophotoluminescence glass dosimeters using two different CT scanners. The dosimeters were placed inside and outside the phantom. The phantom was scanned using three-dimensional and z -axis ATCM techniques after scanning localizer radiographs from the horizontal and vertical directions. After scanning, each organ dose was calculated. Moreover, the dose-length product recorded in the dose reports was examined, and each effective dose was calculated.
Results
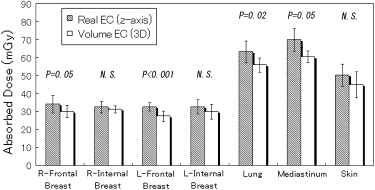
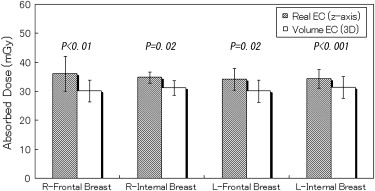
Compared with z -axis ATCM, three-dimensional ATCM reduced breast dose by 0.7% to 18.6% and effective dose by 4.9% to 10.2%. In particular, three-dimensional ATCM reduced frontal breast dose. For other organs, three-dimensional ATCM reduced absorbed doses by 3.4% to 13.6% compared to z -axis ATCM.
Conclusion
Three-dimensional ATCM can reduce absorbed doses to the breast and other organs, in addition to reducing effective dose, compared to z -axis ATCM.
Computed tomographic (CT) scans are the most effective examinations for detecting lung cancer at an early stage . With increased numbers of detector rows and faster gantry rotation times, the time required to scan the entire chest has been reduced to less than 5 seconds . Although multidetector-row computed tomography has been associated with higher radiation dose than conventional computed tomography, the introduction of automatic tube current modulation (ATCM) has facilitated the effective reduction of patient radiation dose while maintaining optimal image quality .
In this technique, tube current is automatically adjusted in the x and y planes (angular ATCM), the z plane ( z -axis ATCM), or both (three-dimensional ATCM) by inputting an appropriate noise value . Previous studies have shown that three-dimensional ATCM is the most effective in reducing patient radiation dose and could reduce the absorbed dose, particularly in the anterior and posterior parts of the body . Later, we envisioned the breast as one of the organs located in the anterior or posterior part of the body. The recently recommended tissue weighting factor for the breast reported in an International Commission on Radiological Protection (ICRP) publication is higher than that previously recommended in an earlier ICRP publication . This implies that overexposure to the breast should be avoided, and three-dimensional ATCM can be used to achieve this objective.
Get Radiology Tree app to read full this article<
Materials and methods
CT Scanners
Get Radiology Tree app to read full this article<
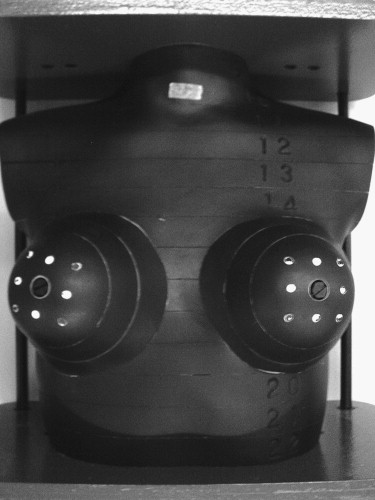
Phantom
Get Radiology Tree app to read full this article<
Get Radiology Tree app to read full this article<
Dose Calibration
Get Radiology Tree app to read full this article<
Measurement of Organ Dose
Get Radiology Tree app to read full this article<
Table 1
Parameters Used for Dose Measurement on Chest Computed Tomography
Parameter LightSpeed VCT ∗ Aquilion 64 † Collimation (mm) 40 32 Tube voltage (kV) 120 120 Pitch 0.984:1 0.828:1 Scan length (cm) 30.0 30.0 Scan time (s) 4.4 6.7 Tube current (mA), range 10–700 10–600 Noise value (Hounsfield units) 10.0 10.0 Gantry rotation time (s) 0.5 0.5 Section thickness (mm) 2.5 3.0 Reconstruction kernel Standard FC13
Get Radiology Tree app to read full this article<
Get Radiology Tree app to read full this article<
Get Radiology Tree app to read full this article<
Get Radiology Tree app to read full this article<
Effective Dose Estimation
Get Radiology Tree app to read full this article<
Get Radiology Tree app to read full this article<
effective dose=k×DLP, effective dose
=
k
×
DLP,
where k is a weighting factor (in milliSieverts per milligrays per centimeter) that is a function of body region; 0.014 was used as the weighting factor according to the ICRP .
Get Radiology Tree app to read full this article<
Statistical Analysis
Get Radiology Tree app to read full this article<
Results
Organ Doses on Two Different Scanners
Get Radiology Tree app to read full this article<
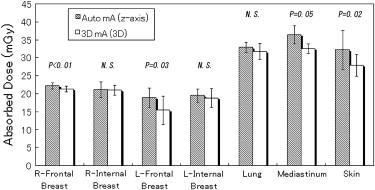
Table 2
Coefficients of Variation (positioned with head first)
Coefficient of Variation (%) Organ Auto mA ( z -Axis ATCM) ∗ 3D mA (Three-Dimensional ATCM) ∗ Real EC ( z -Axis ATCM) † Volume EC (Three-Dimensional ATCM) † Right frontal breast 3.8 3.6 14.5 11.7 Right internal breast 10.1 6.9 9.7 6.3 Left frontal breast 14.4 25.8 7.5 10.7 Left internal breast 9.8 14.2 12.3 13.5 Lung 4.2 7.0 9.6 7.1 Mediastinum 7.0 4.2 9.0 5.4 Skin 16.8 11.0 12.3 16.1
ATCM, automatic tube current modulation.
Get Radiology Tree app to read full this article<
Get Radiology Tree app to read full this article<
Get Radiology Tree app to read full this article<
Get Radiology Tree app to read full this article<
Get Radiology Tree app to read full this article<
Breast Dose (feet first)
Get Radiology Tree app to read full this article<
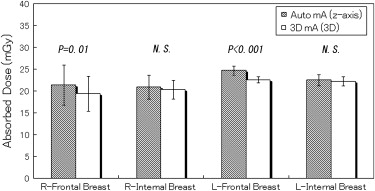
Table 3
Coefficients of Variation (positioned with feet first)
Coefficient of Variation (%) Organ Auto mA ( z -Axis ATCM) ∗ 3D mA (Three-Dimensional ATCM) ∗ Real EC ( z -Axis ATCM) † Volume EC (Three-Dimensional ATCM) † Right frontal breast 21.6 20.8 12.7 16.5 Right internal breast 13.1 10.5 8.0 5.3 Left frontal breast 4.2 3.2 12.7 11.1 Left internal breast 5.7 4.8 12.0 9.5
ATCM, automatic tube current modulation.
Get Radiology Tree app to read full this article<
Get Radiology Tree app to read full this article<
Get Radiology Tree app to read full this article<
Get Radiology Tree app to read full this article<
Get Radiology Tree app to read full this article<
Effective Dose
Get Radiology Tree app to read full this article<
Discussion
Get Radiology Tree app to read full this article<
Get Radiology Tree app to read full this article<
Get Radiology Tree app to read full this article<
Get Radiology Tree app to read full this article<
Get Radiology Tree app to read full this article<
Get Radiology Tree app to read full this article<
References
1. Kaneko M., Kusumoto M., Kobayashi T., et. al.: Computed tomography screening for lung carcinoma in Japan. Cancer 2000; 89: pp. 2485-2488.
2. Hanai K., Horiuchi T., Sekiguchi J., et. al.: Computer-simulation technique for low dose computed tomographic screening. J Comput Assist Tomogr 2006; 30: pp. 955-961.
3. Roggenland D., Peters S.A., Lemburg S.P., et. al.: CT angiography in suspected pulmonary embolism: impact of patient characteristics and different venous lines on vessel enhancement and image quality. AJR Am J Roentgenol 2008; 190: pp. W351-W359.
4. Thornton F.J., Paulson E.K., Yoshizumi T.T., et. al.: Single versus multi-detector row CT: comparison of radiation doses and dose profiles. Acad Radiol 2003; 10: pp. 379-385.
5. Dawson P.: Patient dose in multislice CT: why is it increasing and does it matter?. Br J Radiol 2004; 77: pp. S10-S13.
6. Kalra M.K., Maher M.M., Toth T.L., et. al.: Strategies for CT radiation dose optimization. Radiology 2004; 230: pp. 619-628.
7. Kalra M.K., Maher M.M., Toth T.L., et. al.: Techniques and applications of automatic tube current modulation for CT. Radiology 2004; 233: pp. 649-657.
8. Matsubara K., Koshida K., Suzuki M., et. al.: Comparison between 3-D and z-axis automatic tube current modulation technique in multidetector-row CT. Radiat Prot Dosim 2008; 128: pp. 106-111.
9. Mulkens T.H., Bellinck P., Baeyaert M., et. al.: Use of an automatic exposure control mechanism for dose optimization in multi-detector row CT examinations: clinical evaluation. Radiology 2005; 237: pp. 213-223.
10. International Commission on Radiological Protection. The 2007 recommendations of the International Commission on Radiological Protection. ICRP publication no. 103.2007.PergamonOxford, UK
11. The Phantom Laboratory. The RANDO® phantom, RAN100 and RAN110. Available at: http://www.phantomlab.com/pdf/RAN100_110DS.pdf . Accessed August 31, 2008.
12. International Commission on Radiation Unit and Measurements. Tissue substitutes in radiation dosimetry and measurement. ICRU report no. 44.1989.International Commission on Radiation Unit and MeasurementsBethesda, MD
13. Bongartz G, Golding SJ, Jurik AG, et al. 2004 CT quality criteria. Available at: http://www.msct.eu/CT_Quality_Criteria.htm . Accessed August 31, 2008.
14. International Commission on Radiological Protection. Managing patient dose in multi-detector computed tomography (MDCT). ICRP publication no. 102.2007.PergamonOxford, UK
15. International Commission on Radiological Protection. 1990 recommendations of the International Commission on Radiological Protection. ICRP publication no. 60.1991.PergamonOxford, UK