
Rationale and Objectives
Computed tomographic angiography is the standard in routine follow-up after endovascular aneurysm repair, causing radiation exposure; thus, dose-saving strategies should be applied. The aim of this study was to evaluate the novel sinogram-affirmed iterative reconstruction (SAFIRE) algorithm in terms of clinical usability and potential reduction of radiation exposure.
Materials and Methods
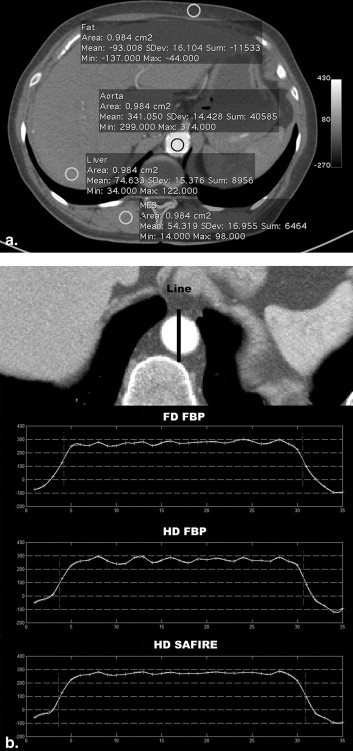
Forty-six patients underwent computed tomographic angiographic follow-up after endovascular aneurysm repair. Data were acquired using a dual-source computed tomographic scanner running both x-ray tubes at the same voltage (120 kV). Raw data were reconstructed using projections of both tubes with filtered back projection (FBP) and of only one tube with FBP and SAFIRE, corresponding to synthetic acquisition with half the radiation dose of the clinical routine radiation dose. Image sets were objectively compared regarding signal-to-noise ratio and edge sharpness. Two radiologists independently assessed a set of subjective criteria, including diagnostic usability, depiction of contrasted vessels, and image noise.
Results
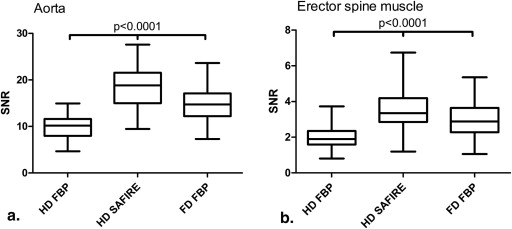
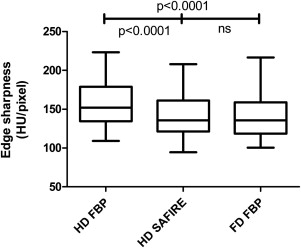
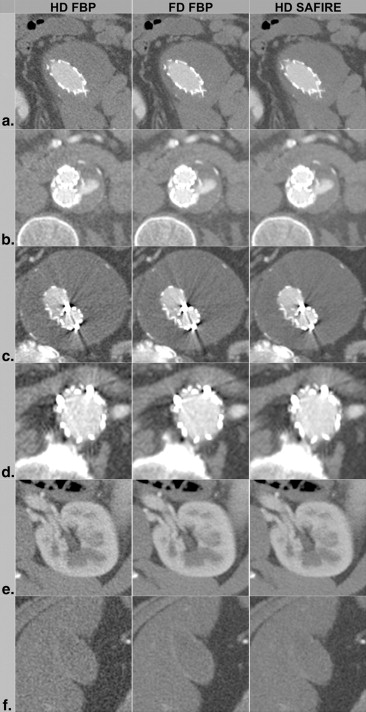
Half-dose (HD) SAFIRE images showed significantly higher signal-to-noise ratios compared to full-dose FBP images ( P < .001), while having equal edge sharpness ( P = .56). Most of the subjectively assessed parameters, such as diagnostic usability and depiction of contrasted vessels, were rated similar for HD SAFIRE and full-dose FBP images. Full-dose FBP images depicted fine anatomic structures more clearly ( P < .05), while HD SAFIRE data sets showed less noise ( P < .01). HD FBP images performed worse on all criteria ( P < .001). Interrater agreement was good (κ = 0.74–0.80).
Conclusions
Using the SAFIRE algorithm, the radiation dose of high-contrast abdominal computed tomographic angiography is reducible from routine clinical levels by up to 50% while maintaining good image quality and diagnostic accuracy.
Endovascular aneurysm repair (EVAR) of infrarenal abdominal aortic aneurysm has become an attractive alternative to open surgery. However, this method can result in a variety of complications, including endoleak, graft migration, graft wire fracture, graft thrombosis, graft stenosis, graft kinking, and graft infections . Consequently, long-term follow-up is mandatory to identify and treat complications. Among other imaging modalities, contrast-enhanced computed tomographic (CT) angiography (CTA) has become the gold standard because of its availability, cost-effectiveness, objectivity, and high sensitivity . Routine follow-up includes CT examinations recommended at 1, 3, 6, and 12 months after the procedure, and yearly thereafter, resulting in a substantial cumulative radiation dose burden with an attributable lifetime cancer risk . To keep patients’ radiation dose as low as reasonably achievable and to minimize cumulative radiation exposure, several dose-saving strategies have proven beneficial, such as lowering the x-ray tube voltage, modulating and adapting the tube current, increasing the iodine concentration of the contrast media , and, more recently, optimizing postprocessing algorithms.
With respect to the latter approach, efforts have been made to improve image quality computationally. Iterative reconstruction techniques have been promising candidates for many years but were limited by computing power and consequent unreasonably long reconstruction times . Compared to traditional filtered back projection (FBP) reconstruction, in which spatial resolution is directly correlated with image noise , iterative reconstruction is able to decouple spatial resolution and image noise to a certain extent. Although resolution and edge sharpness are maintained, image noise in low-contrast areas is reduced . Several studies have demonstrated the benefit of iterative reconstruction in different body regions using iterative reconstruction in image space . A new development in this field is the so-called sinogram-affirmed iterative reconstruction (SAFIRE) technique (Siemens Healthcare, Forchheim, Germany) for CT raw data, which uses a refined noise-modeling technique supported by the raw data (sinogram data), with the aims of reducing noise and maintaining image sharpness. SAFIRE estimates the local noise content in each image pixel by analyzing the raw data contributing to this pixel and removes it from the current image data set.
Get Radiology Tree app to read full this article<
Materials and methods
Patients
Get Radiology Tree app to read full this article<
Table 1
Patient and CT Angiographic Acquisition Characteristics ( n = 46)
Variable Value Men 45 Age (y) 69.2 ± 10.0 (46–89) CT angiographic number after EVAR 2 (1–8) Interval between EVAR and CT angiography (d) 113 (1–2274) Anterior-posterior cross-section ∗ (cm) 28.7 ± 3.3 Lateral cross-section (cm) ∗ 35.2 ± 2.9 Scan parameters Tube voltage (kV) 120/120 Effective tube current–time product (mAs) 212.2 ± 68.8 CTDI (mGy) 17.9 ± 5.6 Scan length (mm) 535.7 ± 113.6 DLP (mGy · cm) 1008.8 ± 492.9 Pitch 1.1 Collimation (mm) 2 × 64 × 0.6 ED (mSv) 15.1 ± 7.4
CT, computed tomographic; CTDI, computed tomographic dose index; DLP, dose-length product; ED, effective radiation dose; EVAR, endovascular aneurysm repair.
Data are expressed as mean ± standard deviation (range) or as median (range).
Get Radiology Tree app to read full this article<
Get Radiology Tree app to read full this article<
CT Image Acquisition
Get Radiology Tree app to read full this article<
Image Reconstruction
Get Radiology Tree app to read full this article<
Get Radiology Tree app to read full this article<
Get Radiology Tree app to read full this article<
SAFIRE
Get Radiology Tree app to read full this article<
Quantitative and Qualitative Image Assessment
Get Radiology Tree app to read full this article<
Get Radiology Tree app to read full this article<
Get Radiology Tree app to read full this article<
Get Radiology Tree app to read full this article<
Radiation Dose Estimates
Get Radiology Tree app to read full this article<
Statistical Analysis
Get Radiology Tree app to read full this article<
Results
Image Noise, CT Numbers, and Edge Sharpness
Get Radiology Tree app to read full this article<
Table 2
Mean CT Number, Mean Image Noise, and SNR
ROI FD FBP HD FBP HD SAFIRE CT Number (HU) Image Noise (HU) SNR CT Number (HU) Image Noise (HU) SNR CT Number (HU) Image Noise (HU) SNR Aorta 272.76 ± 40.48 19.29 ± 3.50 14.62 ± 3.39 271.73 ± 40.72 28.31 ± 5.41 9.95 ± 2.36 271.91 ± 40.91 15.34 ± 2.70 18.32 ± 4.33 Muscle 51.66 ± 9.66 18.88 ± 4.34 2.91 ± 0.96 50.15 ± 9.80 27.42 ± 6.79 1.95 ± 0.65 50.02 ± 9.62 15.35 ± 3.64 3.47 ± 1.17 Fat −104.26 ± 5.93 15.22 ± 2.52 −7.03 ± 1.18 −103.83 ± 6.17 20.95 ± 4.01 −5.12 ± 0.93 −103.54 ± 5.97 11.87 ± 2.67 −9.12 ± 1.95 Liver 69.27 ± 10.13 17.20 ± 2.97 4.14 ± 0.91 67.29 ± 10.05 25.96 ± 5.40 2.70 ± 0.69 67.27 ± 9.67 14.03 ± 3.19 5.00 ± 1.25
CT, computed tomographic; FBP, filtered back projection; FD, full dose; HD, half dose; HU, Hounsfield units; ROI, region of interest; SAFIRE, sinogram-affirmed iterative reconstruction; SNR, signal-to-noise ratio.
Data are expressed as mean ± standard deviation.
Get Radiology Tree app to read full this article<
Get Radiology Tree app to read full this article<
Get Radiology Tree app to read full this article<
Subjective Quality
Get Radiology Tree app to read full this article<
Table 3
Subjective Image Quality Assessment ( n = 46)
n FD FBP HD FBP HD SAFIRE Common hepatic artery 46 3.95 ± 0.23 2.77 ± 0.42 3.96 ± 0.20 Lumbar artery 45 3.56 ± 0.73 2.26 ± 0.85 3.57 ± 0.73 Spleen artery 46 3.95 ± 0.23 2.72 ± 0.54 3.98 ± 0.15 Superior mesenteric artery 46 3.93 ± 0.29 2.80 ± 0.42 3.93 ± 0.29 Renal parenchyma 46 3.84 ± 0.42 2.58 ± 0.60 3.80 ± 0.48 Renal cysts 25 3.64 ± 0.59 2.36 ± 0.74 3.64 ± 0.59 Gallbladder wall 39 3.21 ± 0.72 1.53 ± 0.55 2.68 ± 0.72 Diverticula 14 3.79 ± 0.49 2.50 ± 0.73 3.82 ± 0.47 Blooming of the EVAR 46 2.64 ± 0.52 1.54 ± 0.52 2.87 ± 0.56 Noise 46 3.04 ± 0.41 1.53 ± 0.52 3.78 ± 0.51 Diagnostic usability 46 3.84 ± 0.50 1.98 ± 0.74 3.82 ± 0.51
EVAR, endovascular aneurysm repair; FBP, filtered back projection; FD, full dose; HD, half dose; SAFIRE, sinogram-affirmed iterative reconstruction.
Data are expressed as mean ± standard deviation. Subjective image quality parameters were rated on a scale ranging from 1 to 4 (1 = not diagnostic; 2 = moderate image quality, slightly affecting diagnostic accuracy; 3 = good image quality, not affecting diagnostic accuracy; 4 = excellent image quality).
Table 4
Statistical Analysis of Subjective Image Quality
Friedman FD FBP vs HD SAFIRE HD FBP vs HD SAFIRE FD FBP vs HD FBP Common hepatic artery <.001 NS <.01 <.01 Lumbar artery <.001 NS <.01 <.01 Spleen artery <.001 NS <.01 <.01 Superior mesenteric artery <.001 NS <.01 <.01 Renal parenchyma <.001 NS <.01 <.01 Renal cysts <.001 NS <.01 <.01 Gallbladder wall <.001 <.05 <.01 <.01 Diverticula <.001 NS <.01 <.01 Blooming of the EVAR <.001 NS <.01 <.01 Noise <.001 <.01 <.01 <.01 Diagnostic usability <.001 NS <.01 <.01
EVAR, endovascular aneurysm repair; FBP, filtered back projection; FD, full dose; HD, half dose; SAFIRE, sinogram-affirmed iterative reconstruction.
All P values are Bonferroni corrected.
Get Radiology Tree app to read full this article<
Dose Estimations
Get Radiology Tree app to read full this article<
Discussion
Get Radiology Tree app to read full this article<
Get Radiology Tree app to read full this article<
Get Radiology Tree app to read full this article<
Get Radiology Tree app to read full this article<
Get Radiology Tree app to read full this article<
Get Radiology Tree app to read full this article<
Get Radiology Tree app to read full this article<
Get Radiology Tree app to read full this article<
Get Radiology Tree app to read full this article<
Conclusions
Get Radiology Tree app to read full this article<
References
1. Mita T., Arita T., Matsunaga N., et. al.: Complications of endovascular repair for thoracic and abdominal aortic aneurysm: an imaging spectrum. Radiographics 2000; 20: pp. 1263-1278.
2. Liaw J.V., Clark M., Gibbs R., et. al.: Update: complications and management of infrarenal EVAR. Eur J Radiol 2009; 71: pp. 541-551.
3. Vallabhaneni S.R., Harris P.L.: Lessons learnt from the EUROSTAR registry on endovascular repair of abdominal aortic aneurysm repair. Eur J Radiol 2001; 39: pp. 34-41.
4. White H.A., Macdonald S.: Estimating risk associated with radiation exposure during follow-up after endovascular aortic repair (EVAR). J Cardiovasc Surg (Torino) 2010; 51: pp. 95-104.
5. Iezzi R., Cotroneo A.R., Giammarino A., et. al.: Low-dose multidetector-row CT-angiography of abdominal aortic aneurysm after endovascular repair. Eur J Radiol 2011; 79: pp. 21-28.
6. Dougeni E., Faulkner K., Panayiotakis G.: A review of patient dose and optimisation methods in adult and paediatric CT scanning. Eur J Radiol 2012; 81: pp. e665-e883.
7. Papadakis A.E., Perisinakis K., Oikonomou I., et. al.: Automatic exposure control in pediatric and adult computed tomography examinations: can we estimate organ and effective dose from mean mAs reduction?. Invest Radiol 2011; 46: pp. 654-662.
8. Winklehner A., Goetti R., Baumueller S., et. al.: Automated attenuation-based tube potential selection for thoracoabdominal computed tomography angiography: improved dose effectiveness. Invest Radiol 2011; 46: pp. 767-773.
9. Alkadhi H., Schindera S.T.: State of the art low-dose CT angiography of the body. Eur J Radiol 2011; 80: pp. 36-40.
10. Ghetti C., Ortenzia O., Serreli G.: CT iterative reconstruction in image space: a phantom study. Phys Med 2012; 28: pp. 161-165.
11. Ziegler A., Kohler T., Proksa R.: Noise and resolution in images reconstructed with FBP and OSC algorithms for CT. Med Phys 2007; 34: pp. 585-598.
12. Brooks R.A., Di Chiro G.: Theory of image reconstruction in computed tomography. Radiology 1975; 117: pp. 561-572.
13. May M.S., Wust W., Brand M., et. al.: Dose reduction in abdominal computed tomography: intraindividual comparison of image quality of full-dose standard and half-dose iterative reconstructions with dual-source computed tomography. Invest Radiol 2011; 46: pp. 465-470.
14. Lee S.J., Park S.H., Kim A.Y., et. al.: A prospective comparison of standard-dose CT enterography and 50% reduced-dose CT enterography with and without noise reduction for evaluating Crohn disease. AJR Am J Roentgenol 2011; 197: pp. 50-57.
15. Pontana F., Duhamel A., Pagniez J., et. al.: Chest computed tomography using iterative reconstruction vs filtered back projection (part 2): image quality of low-dose CT examinations in 80 patients. Eur Radiol 2011; 21: pp. 636-643.
16. Pontana F., Pagniez J., Flohr T., et. al.: Chest computed tomography using iterative reconstruction vs filtered back projection (part 1): evaluation of image noise reduction in 32 patients. Eur Radiol 2011; 21: pp. 627-635.
17. Moscariello A., Takx R.A., Schoepf U.J., et. al.: Coronary CT angiography: image quality, diagnostic accuracy, and potential for radiation dose reduction using a novel iterative image reconstruction technique-comparison with traditional filtered back projection. Eur Radiol 2011; 21: pp. 2130-2138.
18. Wang R., Schoepf U.J., Wu R., et. al.: Image quality and radiation dose of low dose coronary CT angiography in obese patients: sinogram affirmed iterative reconstruction versus filtered back projection. Eur J Radiol 2012; 21: pp. 3141-3145.
19. Winklehner A., Karlo C., Puippe G., et. al.: Raw data-based iterative reconstruction in body CTA: evaluation of radiation dose saving potential. Eur Radiol 2011; 21: pp. 2521-2526.
20. Kalra M.K., Woisetschlager M., Dahlstrom N., et. al.: Radiation dose reduction with sinogram affirmed iterative reconstruction technique for abdominal computed tomography. J Comput Assist Tomogr 2012; 36: pp. 339-346.
21. Christner J.A., Kofler J.M., McCollough C.H.: Estimating effective dose for CT using dose-length product compared with using organ doses: consequences of adopting International Commission on Radiological Protection publication 103 or dual-energy scanning. AJR Am J Roentgenol 2010; 194: pp. 881-889.