
Rationale and Objectives
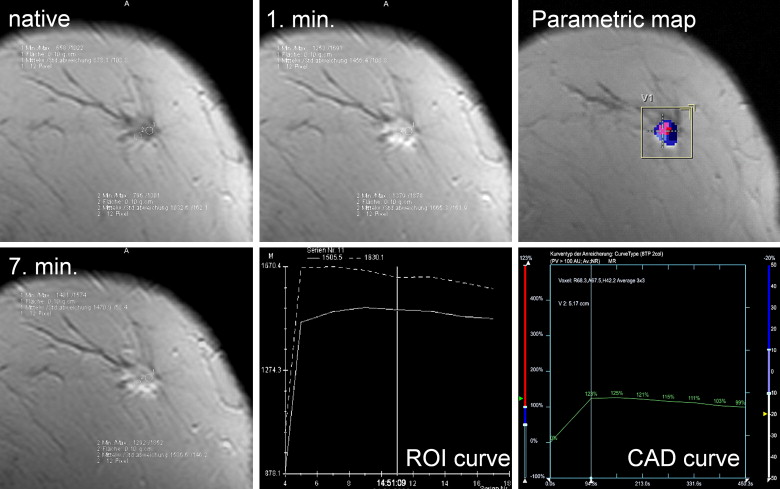
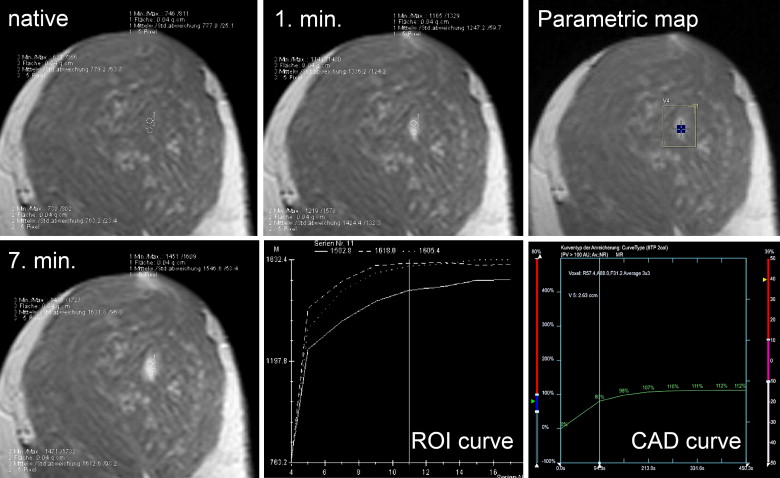
Enhancement characteristics after administration of a contrast agent are regarded as a major criterion for differential diagnosis in magnetic resonance mammography (MRM). However, no consensus exists about the best measurement method to assess contrast enhancement kinetics. This systematic investigation was performed to compare visual estimation with manual region of interest (ROI) and computer-aided diagnosis (CAD) analysis for time curve measurements in MRM.
Materials and Methods
A total of 329 patients undergoing surgery after MRM (1.5 T) were analyzed prospectively. Dynamic data were measured using visual estimation, including ROI as well as CAD methods, and classified depending on initial signal increase and delayed enhancement.
Results
Pathology revealed 469 lesions (279 malignant, 190 benign). Kappa agreement between the methods ranged from 0.78 to 0.81. Diagnostic accuracies of 74.4% (visual), 75.7% (ROI), and 76.6% (CAD) were found without statistical significant differences.
Conclusions
According to our results, curve type measurements are useful as a diagnostic criterion in breast lesions irrespective of the method used.
Magnetic resonance mammography (MRM) is regarded as the most sensitive method for detection of breast cancer . To differentiate between benign and malignant lesions, repetitive measurements after bolus injection of contrast agents are performed. Several investigations have confirmed the initial report on this matter in 1989 . Additionally, successful attempts for a more sophisticated assessment of tumor enhancement characteristics using fast sequences or pharmacokinetic modeling of signal intensity time changes have been described. These techniques could also be combined, leading to good sensitivities and specificities. However, overlapping enhancement characteristics between benign and malignant lesions remain . For an increased diagnostic value of MRM, several morphologic criteria have been implemented into clinical routine . To standardize the process of reading a study, clinical scoring systems as well as a Breast Imaging and Reporting Data System (BIRADS) lexicon integrating morphological and kinetic criteria have been published . For this purpose, dynamic measurements using both a high temporal and spatial resolution seem to be feasible to assess both kinetic and morphological information. With restrictions, time curves can be regarded as quantitative data, which can be used as an objective basis for diagnosis. The most frequently used method to assess these data under clinical conditions is the placement of several regions of interest (ROI) in the strongest enhancing part of a lesion. This approach is described as time consuming and may lead to mistakes because of the inhomogeneity of lesions analyzed . There have been reports about visual assessment of curve types with good diagnostic results . This method is much faster compared to the ROI method, but has not been validated in systematic comparisons yet. In the last years, computer-assisted diagnosis (CAD) systems have been introduced . These systems offer the opportunity of semiautomatic time curve analysis and are believed to shorten and standardize the process of reading a study. Initial results in small patient groups found a comparable diagnostic value of CAD compared to ROI analysis . Furthermore, CAD analysis requires a dedicated workstation and dynamic data have to be computed before the radiologist is able to read a study. Shortening enhancement analysis is of special importance as enhancement characteristics are regarded as only one major diagnostic criterion among others to differentiate enhancing lesions .
Therefore, it is important to identify the best method to be used for contrast enhancement assessment in a clinical setting. This prospective investigation was performed to systematically identify and compare the diagnostic accuracy of visual, ROI, and CAD methods for time curve measurements in the same patient collective.
Methods and materials
Patients
Get Radiology Tree app to read full this article<
Magnetic Resonance Imaging Scanner and Imaging Technique
Get Radiology Tree app to read full this article<
Time Curve Categorization
Get Radiology Tree app to read full this article<
Get Radiology Tree app to read full this article<
Data Analysis
Get Radiology Tree app to read full this article<
Get Radiology Tree app to read full this article<
Get Radiology Tree app to read full this article<
Statistical Analysis
Get Radiology Tree app to read full this article<
Results
Lesions
Get Radiology Tree app to read full this article<
Visual Analysis
Get Radiology Tree app to read full this article<
Table 1
Visual Evaluation of Contrast Enhancement, Results
<50% 50–100%, Continuous 50–100% Plateau 50–100%, Washout >100%, Continuous >100%, Plateau >100%, Washout Total Benign 98 44 21 7 5 7 8 190 51.6% 23.2% 11.1% 3.7% 2.6% 3.7% 4.2% 100% Malignant 34 35 52 64 8 16 70 279 12.2% 12.5% 18.6% 22.9% 2.9% 5.7% 25.1% 100% Total 132 79 73 71 13 23 78 469 28.1% 16.8% 15.6% 15.1% 2.8% 4.9% 16.6% 100%
Get Radiology Tree app to read full this article<
ROI Analysis ( Table 2 )
Get Radiology Tree app to read full this article<
Table 2
Region of Interest Evaluation of Contrast Enhancement, Results
<50% 50–100%, Continuous 50–100% Plateau 50–100%, Washout >100%, Continuous >100%, Plateau >100%, Washout Total Benign 91 45 19 12 9 7 7 190 47.9% 23.7% 10.0% 6.3% 4.7% 3.7% 3.7% 100% Malignant 34 34 47 56 1 16 91 279 12.2% 12.2% 16.8% 20.1% 0.4% 5.7% 32.6% 100% Total 125 79 66 68 10 23 98 469 26.7% 16.8% 14.1% 14.5% 2.1% 4.9% 20.9% 100%
Get Radiology Tree app to read full this article<
CAD Analysis ( Table 3 )
Get Radiology Tree app to read full this article<
Table 3
Computer-Assisted Diagnosis Evaluation of Contrast Enhancement, Results
<50% 50–100%, Continuous 50–100% Plateau 50–100%, Washout >100%, Continuous >100%, Plateau >100%, Washout Total Benign 101 30 10 18 8 13 10 190 53.2% 15.8% 5.3% 9.5% 4.2% 6.8% 5.3% 100% Malignant 38 19 33 44 2 27 116 279 13.6% 6.8% 11.8% 15.8% 0.7% 9.7% 41.6% 100% Total 139 49 43 62 10 40 126 469 29.6% 10.4% 9.3% 13.2% 2.1% 8.5% 26.9% 100%
Get Radiology Tree app to read full this article<
Diagnostic Parameters of Curve Type Assessment and Inter-method Agreement ( Table 4 )
Get Radiology Tree app to read full this article<
Table 4
Diagnostic Parameters (Sensitivity, Specificity, PPV, NPV, Accuracy), and 95% CI of the Measurement Methods Analyzed
Visual ROI CAD Sensitivity 72.4% 75.3% 78.8% 95% CI 66.8–77.6% 69.8–80.2% 74.6–83.5% Specificity 77.4% 76.3% 73.2% 95% CI 70.8–83.1% 69.6–82.2% 66.3–79.3% PPV 82.5% 82.4% 81.2% 95% CI 77.1–87.0% 77.1–86.8% 76.0–85.7% NPV 65.6% 67.8% 70.2% 95% CI 59.0–71.8% 61.1–74.0% 63.3–76.5% Accuracy 74.4% 75.7% 76.6% 95% CI 70.5–78.3% 71.8–79.6% 72.8–80.4%
PPV: positive predictive value; NPV: negative predictive value; CI: confidence interval.
Get Radiology Tree app to read full this article<
Get Radiology Tree app to read full this article<
Discussion
Dynamic Data Analysis
Get Radiology Tree app to read full this article<
Get Radiology Tree app to read full this article<
Get Radiology Tree app to read full this article<
Get Radiology Tree app to read full this article<
Get Radiology Tree app to read full this article<
Conclusion
Get Radiology Tree app to read full this article<
References
1. Kuhl C.: The current status of breast MR imaging. Part I. Choice of technique, image interpretation, diagnostic accuracy, and transfer to clinical practice. Radiology 2007; 244: pp. 356-378.
2. Mann R.M., Kuhl C.K., Kinkel K., et. al.: Breast MRI: guidelines from the European Society of Breast Imaging. Eur Radiol 2008; 18: pp. 1307-1318.
3. Heywang-Kobrunner S.H., Bick U., Bradley W.G., et. al.: International investigation of breast MRI: results of a multicentre study (11 sites) concerning diagnostic parameters for contrast-enhanced MRI based on 519 histopathologically correlated lesions. Eur Radiol 2001; 11: pp. 531-546.
4. Kaiser W.A., Zeitler E.: MR imaging of the breast: fast imaging sequences with and without Gd-DTPA. Preliminary observations. Radiology 1989; 170: pp. 681-686.
5. Kuhl C.K., Mielcareck P., Klaschik S., et. al.: Dynamic breast MR imaging: are signal intensity time course data useful for differential diagnosis of enhancing lesions?. Radiology 1999; 211: pp. 101-110.
6. Mussurakis S., Buckley D.L., Drew P.J., et. al.: Dynamic MR imaging of the breast combined with analysis of contrast agent kinetics in the differentiation of primary breast tumours. Clin Radiol 1997; 52: pp. 516-526.
7. Brix G., Schreiber W., Hoffmann U., Guckel F., Hawighorst H., Knopp M.V.: [Methodological approaches to quantitative evaluation of microcirculation in tissues with dynamic magnetic resonance tomography]. Radiologe 1997; 37: pp. 470-480.
8. Gibbs P., Liney G.P., Lowry M., et. al.: Differentiation of benign and malignant sub-1 cm breast lesions using dynamic contrast enhanced MRI. Breast 2004; 13: pp. 115-121.
9. Siegmann K.C., Muller-Schimpfle M., Schick F., et. al.: MR imaging-detected breast lesions: histopathologic correlation of lesion characteristics and signal intensity data. AJR Am J Roentgenol 2002; 178: pp. 1403-1409.
10. Vincensini D., Dedieu V., Eliat P.A., et. al.: Magnetic resonance imaging measurements of vascular permeability and extracellular volume fraction of breast tumors by dynamic Gd-DTPA-enhanced relaxometry. Magn Reson Imaging 2007; 25: pp. 293-302.
11. Fischer U., von Heyden D., Vosshenrich R., et. al.: [Signal characteristics of malignant and benign lesions in dynamic 2D-MRT of the breast]. Rofo 1993; 158: pp. 287-292.
12. Liberman L., Morris E.A., Lee M.J., et. al.: Breast lesions detected on MR imaging: features and positive predictive value. AJR Am J Roentgenol 2002; 179: pp. 171-178.
13. Malich A., Fischer D.R., Wurdinger S., et. al.: Potential MRI interpretation model: differentiation of benign from malignant breast masses. AJR Am J Roentgenol 2005; 185: pp. 964-970.
14. Mussurakis S., Gibbs P., Horsman A.: Peripheral enhancement and spatial contrast uptake heterogeneity of primary breast tumors: quantitative assessment with dynamic MRI. J Comput Assist Tomogr 1998; 22: pp. 35-46.
15. Penn A., Thompson S., Brem R., et. al.: Morphologic blooming in breast MRI as a characterization of margin for discriminating benign from malignant lesions. Acad Radiol 2006; 13: pp. 1344-1354.
16. Warren R.M., Thompson D., Pointon L.J., et. al.: Evaluation of a prospective scoring system designed for a multicenter breast MR imaging screening study. Radiology 2006; 239: pp. 677-685.
17. Fischer D.R., Baltzer P., Malich A., et. al.: Is the “blooming sign” a promising additional tool to determine malignancy in MR mammography?. Eur Radiol 2004; 14: pp. 394-401.
18. Baum F., Fischer U., Vosshenrich R., et. al.: Classification of hypervascularized lesions in CE MR imaging of the breast. Eur Radiol 2002; 12: pp. 1087-1092.
19. Ikeda D.M., Hylton N.M., Kuhl C.K., et. al.: MRI breast imaging reporting and data system atlas.2003.American College of RadiologyReston, Va
20. Mussurakis S., Buckley D.L., Horsman A.: Dynamic MRI of invasive breast cancer: assessment of three region-of-interest analysis methods. J Comput Assist Tomogr 1997; 21: pp. 431-438.
21. Fischer D.R., Wurdinger S., Boettcher J., et. al.: Further signs in the evaluation of magnetic resonance mammography: a retrospective study. Invest Radiol 2005; 40: pp. 430-435.
22. Liberman L., Mason G., Morris E.A., et. al.: Does size matter? Positive predictive value of MRI-detected breast lesions as a function of lesion size. AJR Am J Roentgenol 2006; 186: pp. 426-430.
23. Pediconi F., Catalano C., Venditti F., et. al.: Color-coded automated signal intensity curves for detection and characterization of breast lesions: preliminary evaluation of a new software package for integrated magnetic resonance-based breast imaging. Invest Radiol 2005; 40: pp. 448-457.
24. Hauth E.A., Stockamp C., Maderwald S., et. al.: Evaluation of the three-time-point method for diagnosis of breast lesions in contrast-enhanced MR mammography. Clin Imaging 2006; 30: pp. 160-165.
25. Williams T.C., DeMartini W.B., Partridge S.C., Peacock S., Lehman C.D.: Breast MR imaging: computer-aided evaluation program for discriminating benign from malignant lesions. Radiology 2007; 244: pp. 94-103.
26. Chen W., Giger M.L., Bick U., et. al.: Automatic identification and classification of characteristic kinetic curves of breast lesions on DCE-MRI. Med Phys 2006; 33: pp. 2878-2887.
27. Goto M., Ito H., Akazawa K., et. al.: Diagnosis of breast tumors by contrast-enhanced MR imaging: comparison between the diagnostic performance of dynamic enhancement patterns and morphologic features. J Magn Reson Imaging 2007; 25: pp. 104-112.
28. Kuhl C.K., Schild H.H., Morakkabati N.: Dynamic bilateral contrast-enhanced MR imaging of the breast: trade-off between spatial and temporal resolution. Radiology 2005; 236: pp. 789-800.
29. Pabst T., Kenn W., Kaiser W.A., et. al.: Understanding why contrast enhancement in dynamic MRI is not reproducible: illustration with a simple phantom. Breast J 2001; 7: pp. 166-170.
30. Port R.E., Knopp M.V., Brix G.: Dynamic contrast-enhanced MRI using Gd-DTPA: interindividual variability of the arterial input function and consequences for the assessment of kinetics in tumors. Magn Reson Med 2001; 45: pp. 1030-1038.