
Quantitative imaging (QI) is increasingly applied in modern radiology practice, assisting in the clinical assessment of many patients and providing a source of biomarkers for a spectrum of diseases. QI is commonly used to inform patient diagnosis or prognosis, determine the choice of therapy, or monitor therapy response. Because most radiologists will likely implement some QI tools to meet the patient care needs of their referring clinicians, it is important for all radiologists to become familiar with the strengths and limitations of QI. The Association of University Radiologists Radiology Research Alliance Quantitative Imaging Task Force has explored the clinical application of QI and summarizes its work in this review. We provide an overview of the clinical use of QI by discussing QI tools that are currently used in clinical practice, clinical applications of these tools, approaches to reporting of QI, and challenges to implementing QI. It is hoped that these insights will help radiologists recognize the tangible benefits of QI to their patients, their referring clinicians, and their own radiology practice.
Quantitative imaging (QI) is becoming an increasingly common tool in modern radiology practice, advancing from research trials to clinical reading rooms. Today, methods that quantify imaging features assist in the clinical assessment of many patients, serving as biomarkers for disease states as diverse as brain ischemia, interstitial lung disease, and colorectal cancer. Because the potential impact of QI on patient care and on clinical outcomes is so great, the Radiological Society of North America has committed considerable resources to standardizing QI, most recently with the Quantitative Imaging Biomarkers Alliance (QIBA). The Association of University Radiologists’ leadership, QIBA participants, and many others in the radiology community view QI as important to the future of radiology. Because it is anticipated that most practicing radiologists will eventually implement some QI tools to meet the specific patient care needs of their referring clinicians, it is important for radiologists of all subspecialties and practice types to become familiar with the various strengths and limitations of QI.
What is QI? According to QIBA :
“Quantitative imaging is the extraction of quantifiable features from medical images for the assessment of normal or the severity, degree of change, or status of a disease, injury, or chronic condition relative to normal. Quantitative imaging includes the development, standardization, and optimization of anatomical, functional, and molecular imaging acquisition protocols, data analyses, display methods, and reporting structures. These features permit the validation of accurately and precisely obtained image-derived metrics with anatomically and physiologically relevant parameters, including treatment response and outcome, and the use of such metrics in research and patient care.”
Although this definition is comprehensive, several practical aspects of QI must be highlighted: accuracy, precision, and clinical validity. When performing measurements, we must be certain that what we are measuring has a clinical correlate, a reference standard against which our measurement has been derived. In this regard, the accuracy of a measurement describes how close the measurement is to a correct answer and thus indicates whether our QI measurement fundamentally “works.” Precision is also important, particularly given the role of QI in performing serial evaluation over time. A useful QI metric should provide the same value when measured in the same way multiple times. Precision (repeatability and reproducibility) allows us to discriminate measurement error from biologic change. Finally, QI tools that demonstrate good accuracy and reliability must ultimately have clinical validity; the results must be relevant to our practice, impacting patient care and improving outcomes.
QI has the greatest impact on patient care when the results help to: 1) inform the diagnosis or prognosis of a particular disease; 2) determine the choice of a particular therapy; or 3) monitor the course of therapy. To make a diagnosis using QI, a general consensus of normal versus abnormal QI values must be established. Similarly, monitoring the response to therapy with QI requires consensus on the amount of change that is considered both statistically and clinically significant. This article will present an overview of the clinical use of QI by presenting QI tools that are currently used in clinical practice, clinical applications of these tools, approaches to reporting that add value to clinical care, and challenges to implementing QI in a clinical radiology practice.
Tools for performing QI
Image Acquisition
Get Radiology Tree app to read full this article<
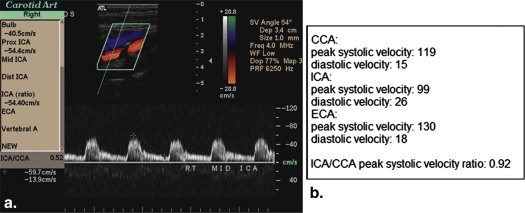
Ultrasound
Get Radiology Tree app to read full this article<
Get Radiology Tree app to read full this article<
CT
Get Radiology Tree app to read full this article<
Get Radiology Tree app to read full this article<
Get Radiology Tree app to read full this article<
MRI
Get Radiology Tree app to read full this article<
Get Radiology Tree app to read full this article<
Dynamic Contrast-Enhanced Imaging
Get Radiology Tree app to read full this article<
General Nuclear Medicine and PET
Get Radiology Tree app to read full this article<
Quality Assurance
Get Radiology Tree app to read full this article<
Get Radiology Tree app to read full this article<
Lesion Measurement
Get Radiology Tree app to read full this article<
Get Radiology Tree app to read full this article<
Get Radiology Tree app to read full this article<
Clinical applications of QI
Get Radiology Tree app to read full this article<
Table 1
Common Clinical Applications of Quantitative Imaging
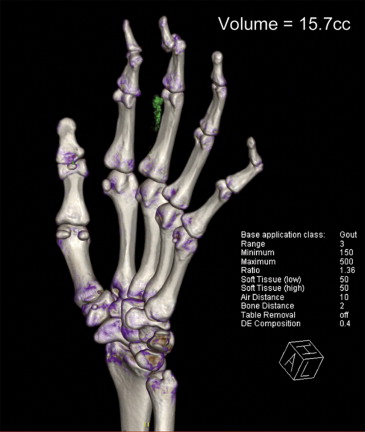
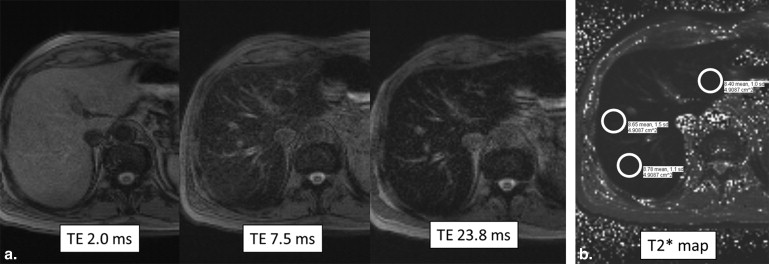
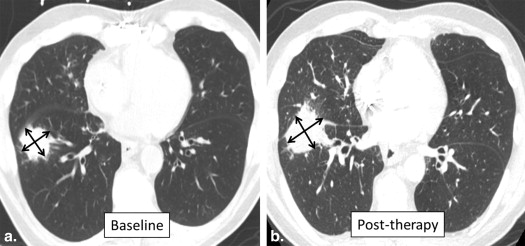
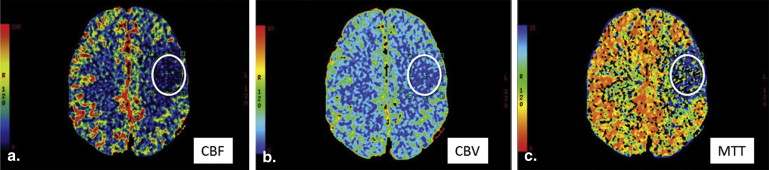
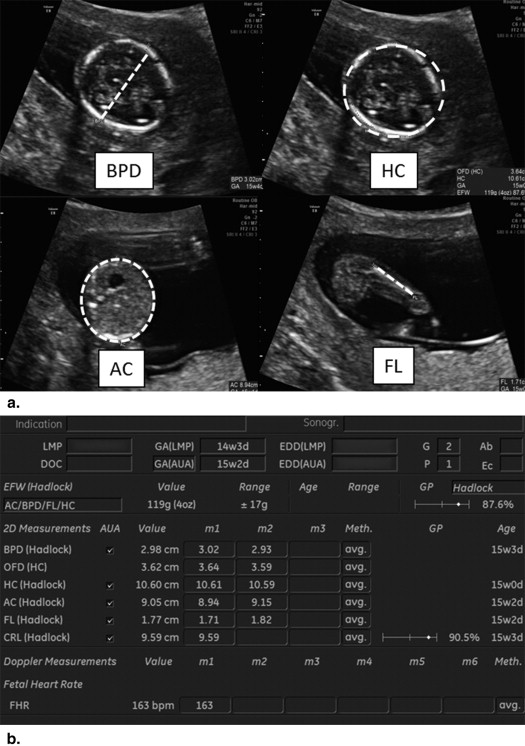
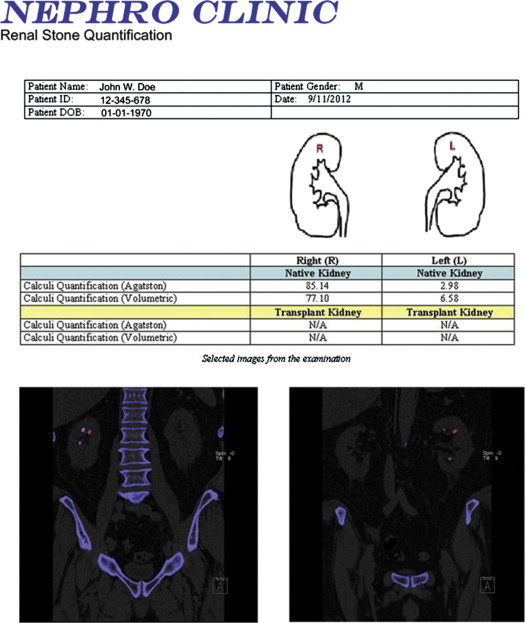
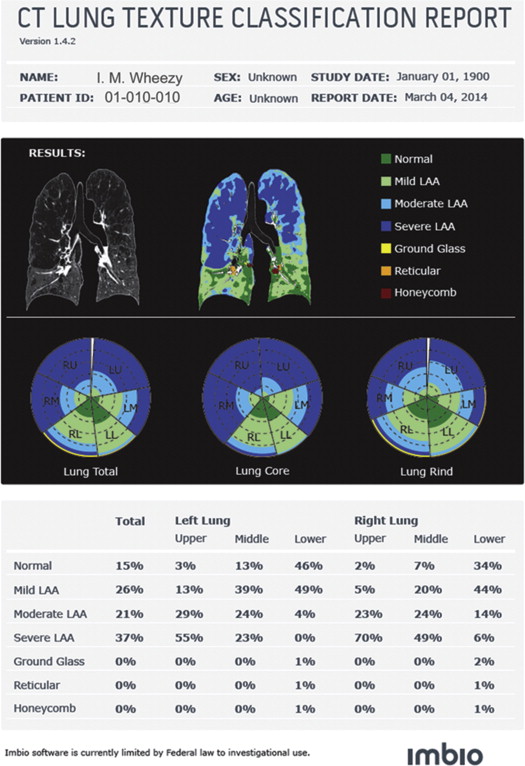
Modality Measurement Clinical ApplicationTissue Dimensions Static US, CT, MRI Tumor and nodal dimensions Tumor staging MRI Articular cartilage thickness, volume, and surface area Osteoarthritis US Fetal dimensions Fetal health Dynamic CT Tracheal dimensions Tracheomalacia MRI Cardiac ventricular volumes and ejection fractures Congestive heart failure, coronary artery disease, cardiomyopathy Gated nuclear blood pool scintigraphy Left ventricular volumes and ejection fraction Congestive heart failure, coronary artery disease Dynamic hepatobiliary scintigraphy Gallbladder ejection fraction Chronic cholecystitis Gastric emptying scintigraphy Gastric emptying time GastroparesisTissue Characterization Measurements of pixel values within ROI CT Lipid content of adrenal lesions Differentiation of adenoma and metastasis CT Lung attenuation Emphysema Dynamic time- resolved ROI values CT Parenchymal perfusion Stroke DCE MRI Tumor perfusion Tumor characterization Chemical/metabolic DE CT Chemical composition Renal stones DE CT Uric acid crystals Gout CT Coronary calcium Coronary artery disease DW MRI ADC values Tumor characterization MR T2* mapping for liver iron Hemochromatosis Chemical shift MRI Bone marrow composition Leukemia, lymphoma MR Spectroscopy Neurodegenerative disorders DXA BMD Osteoporosis Renal scintigraphy Split renal function Renal insufficiency PET SUV Tumor characterization PET SUV Cardiac perfusion Thyroid scintigraphy Radioactive iodine uptake Grave diseaseVascular Flow US Flow velocity Stenosis US Resistive index and acceleration time Stenosis MRI Phase-contrast flow quantification StenosisCombinations CT RECIST criteria Tumor response CT Choi criteria Tumor response
ADC, apparent diffusion coefficient; BMD, bone mineral density; CT, computed tomography; DCE, dynamic contrast-enhanced; DE, dual-energy; DW, diffusion-weighted; DXA, dual-energy X-ray absorptiometry; MR, magnetic resonance; MRI, MR imaging; PET, positron emission tomography; RECIST, Response Evaluation Criteria in Solid Tumors; ROI, region of interest; SUV, standardized uptake value; US, ultrasound.
Get Radiology Tree app to read full this article<
Abdominal Imaging, Including Oncologic Imaging
Get Radiology Tree app to read full this article<
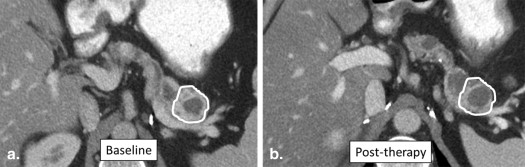
![Figure 5, A 64-year-old woman with metastatic ovarian cancer. (a) Baseline computed tomography (CT) and fused positron emission tomography (PET) images show an anterior abdominal wall metastasis with marked increased metabolic activity (maximum standardized uptake value [SUVmax] 11.7). (b) Follow-up CT and fused PET/CT images obtained after 3 months of treatment with paclitaxel shows similar size of the lesion, although there has been substantial interval decrease in metabolic activity (SUV max 3.7). This interval decrease in SUV is consistent with response to therapy, which is not readily apparent based on evaluation of lesion size alone.](https://storage.googleapis.com/dl.dentistrykey.com/clinical/ClinicalUtilityofQuantitativeImaging/4_1s20S1076633214003353.jpg)
Get Radiology Tree app to read full this article<
Get Radiology Tree app to read full this article<
Get Radiology Tree app to read full this article<
Get Radiology Tree app to read full this article<
Get Radiology Tree app to read full this article<
Neuroimaging
Get Radiology Tree app to read full this article<
Get Radiology Tree app to read full this article<
Get Radiology Tree app to read full this article<
Get Radiology Tree app to read full this article<
Cardiac Imaging
Get Radiology Tree app to read full this article<
Get Radiology Tree app to read full this article<
Musculoskeletal Imaging
Get Radiology Tree app to read full this article<
Get Radiology Tree app to read full this article<
Obstetric Imaging
Get Radiology Tree app to read full this article<
Get Radiology Tree app to read full this article<
Reporting of QI studies
Get Radiology Tree app to read full this article<
Get Radiology Tree app to read full this article<
Get Radiology Tree app to read full this article<
Get Radiology Tree app to read full this article<
Get Radiology Tree app to read full this article<
Get Radiology Tree app to read full this article<
Challenges to QI in clinical practice
Get Radiology Tree app to read full this article<
Radiologists
Get Radiology Tree app to read full this article<
Get Radiology Tree app to read full this article<
Get Radiology Tree app to read full this article<
Patients
Get Radiology Tree app to read full this article<
Clinicians
Get Radiology Tree app to read full this article<
Get Radiology Tree app to read full this article<
Get Radiology Tree app to read full this article<
Manufacturers
Get Radiology Tree app to read full this article<
Conclusion
Get Radiology Tree app to read full this article<
Get Radiology Tree app to read full this article<
Acknowledgments
Get Radiology Tree app to read full this article<
References
1. Radiological Society of North America. Quantitative Imaging Biomarkers Alliance. Available at: http://www.rsna.org/QIBA.aspx . Accessed on January 12, 2014.
2. Taylor K.J., Burns P.N.: Duplex Doppler scanning in the pelvis and abdomen. Ultrasound Med Biol 1985; 11: pp. 643-658.
3. Pearce W.H., Astleford P.: What’s new in vascular ultrasound. Surg Clin North Am 2004; 84: pp. 1113-1126. vii
4. Ardalan M.R., Tarzamani M.K., Shoja M.M.: A correlation between direct and indirect Doppler ultrasonographic measures in transplant renal artery stenosis. Transplant Proc 2007; 39: pp. 1436-1438.
5. Kruskal J.B., Newman P.A., Sammons L.G., et. al.: Optimizing Doppler and color flow US: application to hepatic sonography. Radiographics 2004; 24: pp. 657-675.
6. Kurland B.F., Gerstner E.R., Mountz J.M., et. al.: Promise and pitfalls of quantitative imaging in oncology clinical trials. Magn Reson Imaging 2012; 30: pp. 1301-1312.
7. Davenport M.S., Neville A.M., Ellis J.H., et. al.: Diagnosis of renal angiomyolipoma with hounsfield unit thresholds: effect of size of region of interest and nephrographic phase imaging. Radiology 2011; 260: pp. 158-165.
8. Rosenkrantz AB, Matza BW, Portnoy E, Melamed J, Taneja SS, Wehrli NE. Impact of size of region-of-interest on differentiation of renal cell carcinoma and renal cysts on multi-phase CT: preliminary findings. Eur J Radiol 2014; 83(2):239–244.
9. Coursey C.A., Nelson R.C., Boll D.T., et. al.: Dual-energy multidetector CT: how does it work, what can it tell us, and when can we use it in abdominopelvic imaging?. Radiographics 2010; 30: pp. 1037-1055.
10. Boll D.T., Patil N.A., Paulson E.K., et. al.: Renal stone assessment with dual-energy multidetector CT and advanced postprocessing techniques: improved characterization of renal stone composition–pilot study. Radiology 2009; 250: pp. 813-820.
11. Chandarana H., Lim R.P., Jensen J.H., et. al.: Hepatic iron deposition in patients with liver disease: preliminary experience with breath-hold multiecho T2*-weighted sequence. AJR Am J Roentgenol 2009; 193: pp. 1261-1267.
12. Koh D.M., Collins D.J.: Diffusion-weighted MRI in the body: applications and challenges in oncology. AJR Am J Roentgenol 2007; 188: pp. 1622-1635.
13. Vargas H.A., Akin O., Franiel T., et. al.: Diffusion-weighted endorectal MR imaging at 3 T for prostate cancer: tumor detection and assessment of aggressiveness. Radiology 2011; 259: pp. 775-784.
14. Dimou S., Battisti R.A., Hermens D.F., et. al.: A systematic review of functional magnetic resonance imaging and diffusion tensor imaging modalities used in presurgical planning of brain tumour resection. Neurosurgical review 2013; 36: pp. 205-214. discussion 14
15. Currie S., Hadjivassiliou M., Craven I.J., et. al.: Magnetic resonance spectroscopy of the brain. Postgraduate medical journal 2013; 89: pp. 94-106.
16. Sakuma H., Takeda K., Higgins C.B.: Fast magnetic resonance imaging of the heart. Eur J Radiol 1999; 29: pp. 101-113.
17. Egbert N.D., Caoili E.M., Cohan R.H., et. al.: Differentiation of papillary renal cell carcinoma subtypes on CT and MRI. AJR Am J Roentgenol 2013; 201: pp. 347-355.
18. Ho V.B., Allen S.F., Hood M.N., et. al.: Renal masses: quantitative assessment of enhancement with dynamic MR imaging. Radiology 2002; 224: pp. 695-700.
19. Morkenborg J., Pedersen M., Jensen F.T., et. al.: Quantitative assessment of Gd-DTPA contrast agent from signal enhancement: an in-vitro study. Magn Reson Imaging 2003; 21: pp. 637-643.
20. Kuhl C.K., Mielcareck P., Klaschik S., et. al.: Dynamic breast MR imaging: are signal intensity time course data useful for differential diagnosis of enhancing lesions?. Radiology 1999; 211: pp. 101-110.
21. Larsson C., Kleppesto M., Rasmussen I., et. al.: Sampling requirements in DCE-MRI based analysis of high grade gliomas: simulations and clinical results. J Magn Reson Imaging 2013; 37: pp. 818-829.
22. Hoh C.K.: Clinical use of FDG PET. Nucl Med Biol 2007; 34: pp. 737-742.
23. Graham M.M., Peterson L.M., Hayward R.M.: Comparison of simplified quantitative analyses of FDG uptake. Nucl Med Biol 2000; 27: pp. 647-655.
24. Vriens D., de Geus-Oei L.F., van Laarhoven H.W., et. al.: Evaluation of different normalization procedures for the calculation of the standardized uptake value in therapy response monitoring studies. Nuclear medicine communications 2009; 30: pp. 550-557.
25. Chen K., Chen X.: Positron emission tomography imaging of cancer biology: current status and future prospects. Semin Oncol 2011; 38: pp. 70-86.
26. Vallabhajosula S., Solnes L., Vallabhajosula B.: A broad overview of positron emission tomography radiopharmaceuticals and clinical applications: what is new?. Semin Nucl Med 2011; 41: pp. 246-264.
27. Gayed I., Vu T., Iyer R., et. al.: The role of 18F-FDG PET in staging and early prediction of response to therapy of recurrent gastrointestinal stromal tumors. J Nucl Med 2004; 45: pp. 17-21.
28. Tahari AK, Alluri KC, Quon H, Koch W, Wahl RL, Subramaniam RM. FDG PET/CT imaging of oropharyngeal squamous cell carcinoma: characteristics of human papillomavirus-positive and -negative tumors. Clinical nuclear medicine 2014; 39(3):225–31.
29. Buckler A.J., Mozley P.D., Schwartz L., et. al.: Volumetric CT in lung cancer: an example for the qualification of imaging as a biomarker. Acad Radiol 2010; 17: pp. 107-115.
30. Kumar V., Gu Y., Basu S., et. al.: Radiomics: the process and the challenges. Magn Reson Imaging 2012; 30: pp. 1234-1248.
31. McCollough C.H., Bruesewitz M.R., McNitt-Gray M.F., et. al.: The phantom portion of the American College of Radiology (ACR) computed tomography (CT) accreditation program: practical tips, artifact examples, and pitfalls to avoid. Medical physics 2004; 31: pp. 2423-2442.
32. CT Volumetry Technical Committee. CT Tumor Volume Change Profile, Quantitative Imaging Biomarkers Alliance. Version 2.2. Reviewed Draft. QIBA, August 8, 2012. Available from: http://rsna.org/QIBA_.aspx . Accessed on February 11, 2014.
33. DCE MRI Technical Committee. DCE MRI Quantification Profile, Quantitative Imaging Biomarkers Alliance. Version 1.0. Reviewed Draft. QIBA, July 1, 2012. Available from: http://rsna.org/QIBA_.aspx . Accessed on February 11, 2014.
34. de Langen A.J., Vincent A., Velasquez L.M., et. al.: Repeatability of 18F-FDG uptake measurements in tumors: a metaanalysis. J Nucl Med 2012; 53: pp. 701-708.
35. Rockall A.G., Avril N., Lam R., et. al.: Repeatability of Quantitative FDG-PET/CT and Contrast-Enhanced CT in Recurrent Ovarian Carcinoma: Test-Retest Measurements for Tumor FDG Uptake, Diameter, and Volume. Clinical cancer research : an official journal of the American Association for Cancer Research 2014;
36. Dachman A.H., MacEneaney P.M., Adedipe A., et. al.: Tumor size on computed tomography scans: is one measurement enough?. Cancer 2001; 91: pp. 555-560.
37. Beer A.J., Wieder H.A., Lordick F., et. al.: Adenocarcinomas of esophagogastric junction: multi-detector row CT to evaluate early response to neoadjuvant chemotherapy. Radiology 2006; 239: pp. 472-480.
38. Sosna J., Rofsky N.M., Gaston S.M., et. al.: Determinations of prostate volume at 3-Tesla using an external phased array coil: comparison to pathologic specimens. Acad Radiol 2003; 10: pp. 846-853.
39. Zhang J., Kang S.K., Wang L., et. al.: Distribution of renal tumor growth rates determined by using serial volumetric CT measurements. Radiology 2009; 250: pp. 137-144.
40. Breiman R.S., Beck J.W., Korobkin M., et. al.: Volume determinations using computed tomography. AJR Am J Roentgenol 1982; 138: pp. 329-333.
41. Zhao Y.R., Ooijen P.M., Dorrius M.D., et. al.: Comparison of three software systems for semi-automatic volumetry of pulmonary nodules on baseline and follow-up CT examinations. Acta Radiol 2013;
42. Sridhar P., Mercier G., Tan J., et. al.: FDG PET Metabolic Tumor Volume Segmentation and Pathologic Volume of Primary Human Solid Tumors. AJR Am J Roentgenol 2014; 202: pp. 1114-1119.
43. Higano S., Yun X., Kumabe T., et. al.: Malignant astrocytic tumors: clinical importance of apparent diffusion coefficient in prediction of grade and prognosis. Radiology 2006; 241: pp. 839-846.
44. Ohba Y., Nomori H., Shibata H., et. al.: Evaluation of semiquantitative assessments of fluorodeoxyglucose uptake on positron emission tomography scans for the diagnosis of pulmonary malignancies 1 to 3 cm in size. Ann Thorac Surg 2009; 87: pp. 886-891.
45. van Velzen J.E., de Graaf F.R., Jukema J.W., et. al.: Comparison of the relation between the calcium score and plaque characteristics in patients with acute coronary syndrome versus patients with stable coronary artery disease, assessed by computed tomography angiography and virtual histology intravascular ultrasound. The American journal of cardiology 2011; 108: pp. 658-664.
46. Sullivan D.C.: Imaging as a quantitative science. Radiology 2008; 248: pp. 328-332.
47. Obenauer S., Hermann K.P., Grabbe E.: Applications and literature review of the BI-RADS classification. Eur Radiol 2005; 15: pp. 1027-1036.
48. Park J.W., Kerbel R.S., Kelloff G.J., et. al.: Rationale for biomarkers and surrogate end points in mechanism-driven oncology drug development. Clinical cancer research : an official journal of the American Association for Cancer Research 2004; 10: pp. 3885-3896.
49. Pien H.H., Fischman A.J., Thrall J.H., et. al.: Using imaging biomarkers to accelerate drug development and clinical trials. Drug discovery today 2005; 10: pp. 259-266.
50. Jaffe T.A., Wickersham N.W., Sullivan D.C.: Quantitative imaging in oncology patients: Part 1, radiology practice patterns at major U.S. cancer centers. AJR Am J Roentgenol 2010; 195: pp. 101-106.
51. Nishino M., Jagannathan J.P., Ramaiya N.H., et. al.: Revised RECIST guideline version 1.1: What oncologists want to know and what radiologists need to know. AJR Am J Roentgenol 2010; 195: pp. 281-289.
52. Benjamin R.S., Choi H., Macapinlac H.A., et. al.: We should desist using RECIST, at least in GIST. J Clin Oncol 2007; 25: pp. 1760-1764.
53. van der Veldt A.A., Meijerink M.R., van den Eertwegh A.J., et. al.: Choi response criteria for early prediction of clinical outcome in patients with metastatic renal cell cancer treated with sunitinib. British journal of cancer 2010; 102: pp. 803-809.
54. Skougaard K., Nielsen D., Jensen B.V., et. al.: Comparison of EORTC criteria and PERCIST for PET/CT response evaluation of patients with metastatic colorectal cancer treated with irinotecan and cetuximab. J Nucl Med 2013; 54: pp. 1026-1031.
55. National Comprehensive Cancer Network. Hodgkin Lymphoma (Version 2.2014). http://www.nccn.org/professionals/physician_gls/pdf/hodgkins.pdf . Accessed May 5, 2014.
56. Hamrahian A.H., Ioachimescu A.G., Remer E.M., et. al.: Clinical utility of noncontrast computed tomography attenuation value (hounsfield units) to differentiate adrenal adenomas/hyperplasias from nonadenomas: Cleveland Clinic experience. The Journal of clinical endocrinology and metabolism 2005; 90: pp. 871-877.
57. Koo H.J., Choi H.J., Kim H.J., et. al.: The value of 15-minute delayed contrast-enhanced CT to differentiate hyperattenuating adrenal masses compared with chemical shift MR imaging. Eur Radiol 2014;
58. Blake M.A., Kalra M.K., Sweeney A.T., et. al.: Distinguishing benign from malignant adrenal masses: multi-detector row CT protocol with 10-minute delay. Radiology 2006; 238: pp. 578-585.
59. Boland G.W., Blake M.A., Holalkere N.S., et. al.: PET/CT for the characterization of adrenal masses in patients with cancer: qualitative versus quantitative accuracy in 150 consecutive patients. AJR Am J Roentgenol 2009; 192: pp. 956-962.
60. Linton K.M., Taylor M.B., Radford J.A.: Response evaluation in gastrointestinal stromal tumours treated with imatinib: misdiagnosis of disease progression on CT due to cystic change in liver metastases. The British journal of radiology 2006; 79: pp. e40-e44.
61. Bruix J., Sherman M., Llovet J.M., et. al.: Clinical management of hepatocellular carcinoma. Conclusions of the Barcelona-2000 EASL conference. European Association for the Study of the Liver. Journal of hepatology 2001; 35: pp. 421-430.
62. Forner A., Ayuso C., Varela M., et. al.: Evaluation of tumor response after locoregional therapies in hepatocellular carcinoma: are response evaluation criteria in solid tumors reliable?. Cancer 2009; 115: pp. 616-623.
63. Kyriazi S., Collins D.J., Messiou C., et. al.: Metastatic ovarian and primary peritoneal cancer: assessing chemotherapy response with diffusion-weighted MR imaging–value of histogram analysis of apparent diffusion coefficients. Radiology 2011; 261: pp. 182-192.
64. Srinivasan A., Goyal M., Al Azri F., et. al.: State-of-the-art imaging of acute stroke. Radiographics 2006; 26: pp. S75-S95.
65. Wintermark M., Reichhart M., Thiran J.P., et. al.: Prognostic accuracy of cerebral blood flow measurement by perfusion computed tomography, at the time of emergency room admission, in acute stroke patients. Annals of neurology 2002; 51: pp. 417-432.
66. Lui Y.W., Tang E.R., Allmendinger A.M., et. al.: Evaluation of CT perfusion in the setting of cerebral ischemia: patterns and pitfalls. AJNR American journal of neuroradiology 2010; 31: pp. 1552-1563.
67. Ma H., Parsons M.W., Christensen S., et. al.: A multicentre, randomized, double-blinded, placebo-controlled Phase III study to investigate EXtending the time for Thrombolysis in Emergency Neurological Deficits (EXTEND). International journal of stroke: official journal of the International Stroke Society 2012; 7: pp. 74-80.
68. Parsons M.W.: Perfusion CT: is it clinically useful?. International journal of stroke: official journal of the International Stroke Society 2008; 3: pp. 41-50.
69. Rai A.T., Carpenter J.S., Peykanu J.A., et. al.: The role of CT perfusion imaging in acute stroke diagnosis: a large single-center experience. The Journal of emergency medicine 2008; 35: pp. 287-292.
70. Srinivasan A., Goyal M., Lum C., et. al.: Processing and interpretation times of CT angiogram and CT perfusion in stroke. The Canadian journal of neurological sciences Le journal canadien des sciences neurologiques 2005; 32: pp. 483-486.
71. Ogawa T., Shishido F., Kanno I., et. al.: Cerebral glioma: evaluation with methionine PET. Radiology 1993; 186: pp. 45-53.
72. Patronas N.J., Di Chiro G., Kufta C., et. al.: Prediction of survival in glioma patients by means of positron emission tomography. Journal of neurosurgery 1985; 62: pp. 816-822.
73. De Witte O., Lefranc F., Levivier M., et. al.: FDG-PET as a prognostic factor in high-grade astrocytoma. Journal of neuro-oncology 2000; 49: pp. 157-163.
74. Jain R., Ellika S.K., Scarpace L., et. al.: Quantitative estimation of permeability surface-area product in astroglial brain tumors using perfusion CT and correlation with histopathologic grade. AJNR American journal of neuroradiology 2008; 29: pp. 694-700.
75. Vlieger E.J., Majoie C.B., Leenstra S., et. al.: Functional magnetic resonance imaging for neurosurgical planning in neurooncology. Eur Radiol 2004; 14: pp. 1143-1153.
76. Wilkinson I.D., Romanowski C.A., Jellinek D.A., et. al.: Motor functional MRI for pre-operative and intraoperative neurosurgical guidance. The British journal of radiology 2003; 76: pp. 98-103.
77. Mitra D., Basu S.: Equilibrium radionuclide angiocardiography: Its usefulness in current practice and potential future applications. World journal of radiology 2012; 4: pp. 421-430.
78. Lund O., Rasmussen K., Jensen F.T., et. al.: Left ventricular ejection fraction determined with the nuclear stethoscope, gamma camera and contrast ventriculography. Nuclear medicine communications 1986; 7: pp. 337-348.
79. Fatima N., Zaman M.U., Hashmi A., et. al.: Assessing adriamycin-induced early cardiotoxicity by estimating left ventricular ejection fraction using technetium-99m multiple-gated acquisition scan and echocardiography. Nuclear medicine communications 2011; 32: pp. 381-385.
80. Klein G.J., Thirion J.P.: Cardiovascular imaging to quantify the evolution of cardiac diseases in clinical development. Biomarkers: biochemical indicators of exposure, response, and susceptibility to chemicals 2005; 10: pp. S1-S9.
81. Patil H., O’Keefe J., Thompson R., et. al.: Role of CT calcium scoring in screening for coronary artery disease. Missouri medicine 2012; 109: pp. 193-194.
82. Rengier F., Geisbusch P., Schoenhagen P., et. al.: State-of-the-art aortic imaging: Part II - applications in transcatheter aortic valve replacement and endovascular aortic aneurysm repair. VASA Zeitschrift fur Gefasskrankheiten 2014; 43: pp. 6-26.
83. Augat P., Eckstein F.: Quantitative imaging of musculoskeletal tissue. Annual review of biomedical engineering 2008; 10: pp. 369-390.
84. Eckstein F., Cicuttini F., Raynauld J.P., et. al.: Magnetic resonance imaging (MRI) of articular cartilage in knee osteoarthritis (OA): morphological assessment. Osteoarthritis and cartilage/OARS, Osteoarthritis Research Society 2006; 14: pp. A46-A75.
85. Eckstein F., Guermazi A., Roemer F.W.: Quantitative MR imaging of cartilage and trabecular bone in osteoarthritis. Radiol Clin North Am 2009; 47: pp. 655-673.
86. Sharma L., Eckstein F., Song J., et. al.: Relationship of meniscal damage, meniscal extrusion, malalignment, and joint laxity to subsequent cartilage loss in osteoarthritic knees. Arthritis and rheumatism 2008; 58: pp. 1716-1726.
87. Eckstein F., Wirth W.: Quantitative cartilage imaging in knee osteoarthritis. Arthritis 2011; 2011: pp. 475684.
88. Rosen B.R., Fleming D.M., Kushner D.C., et. al.: Hematologic bone marrow disorders: quantitative chemical shift MR imaging. Radiology 1988; 169: pp. 799-804.
89. Guckel F., Brix G., Semmler W., et. al.: Proton chemical shift imaging of bone marrow for monitoring therapy in leukemia. Journal of computer assisted tomography 1990; 14: pp. 954-959.
90. Gerard E.L., Ferry J.A., Amrein P.C., et. al.: Compositional changes in vertebral bone marrow during treatment for acute leukemia: assessment with quantitative chemical shift imaging. Radiology 1992; 183: pp. 39-46.
91. Hobbins J.: Morphometry of fetal growth. Acta paediatrica 1997; 423: pp. 165-168. discussion 9
92. Warsof S.L., Cooper D.J., Little D., et. al.: Routine ultrasound screening for antenatal detection of intrauterine growth retardation. Obstetrics and gynecology 1986; 67: pp. 33-39.
93. Perinatology.com. Fetal Biometry Calculator II. Available at http://www.perinatology.com/calculators/biometry.htm . Accessed on May 5, 2014.
94. Chauhan S.P., Cole J., Sanderson M., et. al.: Suspicion of intrauterine growth restriction: Use of abdominal circumference alone or estimated fetal weight below 10%. The journal of maternal-fetal & neonatal medicine: the official journal of the European Association of Perinatal Medicine, the Federation of Asia and Oceania Perinatal Societies, the International Society of Perinatal Obstet 2006; 19: pp. 557-562.
95. Kundel H.L.: History of research in medical image perception. J Am Coll Radiol 2006; 3: pp. 402-408.
96. Tuddenham W.J.: Roentgen image percetion–a personal survey of the problem. Radiol Clin North Am 1969; 7: pp. 499-501.
97. Flaherty K.R., Andrei A.C., King T.E., et. al.: Idiopathic interstitial pneumonia: do community and academic physicians agree on diagnosis?. American journal of respiratory and critical care medicine 2007; 175: pp. 1054-1060.
98. Jonisch A.I., Rubinowitz A.N., Mutalik P.G., et. al.: Can high-attenuation renal cysts be differentiated from renal cell carcinoma at unenhanced CT?. Radiology 2007; 243: pp. 445-450.
99. Jaffe T.A., Wickersham N.W., Sullivan D.C.: Quantitative imaging in oncology patients: Part 1, radiology practice patterns at major U.S. cancer centers. AJR Am J Roentgenol 2010; 195: pp. 101-106.
100. Muzi M., O’Sullivan F., Mankoff D.A., et. al.: Quantitative assessment of dynamic PET imaging data in cancer imaging. Magn Reson Imaging 2012; 30: pp. 1203-1215.
101. Buckler A.J., Mulshine J.L., Gottlieb R., et. al.: The use of volumetric CT as an imaging biomarker in lung cancer. Acad Radiol 2010; 17: pp. 100-106.
102. Motzer R.J., Hutson T.E., Tomczak P., et. al.: Overall survival and updated results for sunitinib compared with interferon alfa in patients with metastatic renal cell carcinoma. J Clin Oncol 2009; 27: pp. 3584-3590.
103. Thiam R., Fournier L.S., Trinquart L., et. al.: Optimizing the size variation threshold for the CT evaluation of response in metastatic renal cell carcinoma treated with sunitinib. Ann Oncol 2010; 21: pp. 936-941.
104. Nathan P.D., Vinayan A., Stott D., et. al.: CT response assessment combining reduction in both size and arterial phase density correlates with time to progression in metastatic renal cancer patients treated with targeted therapies. Cancer Biol Ther 2010; 9: pp. 15-19.
105. Smith A.D., Lieber M.L., Shah S.N.: Assessing tumor response and detecting recurrence in metastatic renal cell carcinoma on targeted therapy: importance of size and attenuation on contrast-enhanced CT. AJR Am J Roentgenol 2010; 194: pp. 157-165.
106. Smith A.D., Shah S.N., Rini B.I., et. al.: Morphology, Attenuation, Size, and Structure (MASS) criteria: assessing response and predicting clinical outcome in metastatic renal cell carcinoma on antiangiogenic targeted therapy. AJR Am J Roentgenol 2010; 194: pp. 1470-1478.
107. Abramson RG, Su PF, Shyr Y. Quantitative metrics in clinical radiology reporting: a snapshot perspective from a single mixed academic-community practice. Magn Reson Imaging 2012; 30(9):1357–66.
108. Coxson H.O., Whittall K.P., Nakano Y., et. al.: Selection of patients for lung volume reduction surgery using a power law analysis of the computed tomographic scan. Thorax 2003; 58: pp. 510-514.
109. Cederlund K., Bergstrand L., Hogberg S., et. al.: Visual grading of emphysema severity in candidates for lung volume reduction surgery. Comparison between HRCT, spiral CT and “density-masked” images. Acta Radiol 2002; 43: pp. 48-53.
110. Jaffe T.A., Wickersham N.W., Sullivan D.C.: Quantitative imaging in oncology patients: Part 2, oncologists’ opinions and expectations at major U.S. cancer centers. AJR Am J Roentgenol 2010; 195: pp. W19-W30.
111. Sanelli P.C., Nicola G., Johnson R., et. al.: Effect of training and experience on qualitative and quantitative CT perfusion data. AJNR American journal of neuroradiology 2007; 28: pp. 428-432.
112. Doot R.K., Thompson T., Greer B.E., et. al.: Early experiences in establishing a regional quantitative imaging network for PET/CT clinical trials. Magn Reson Imaging 2012; 30: pp. 1291-1300.
113. Jajamovich G.H., Dyvorne H., Donnerhack C., Taouli B.: Quantitative Liver MRI Combining Phase Contrast Imaging. Elastography, and DWI: Assessment of Reproducibility and Postprandial Effect at 3.0 T. PLoS One 2014; 9: pp. e97355.
114. Gierada D.S., Bierhals A.J., Choong C.K., et. al.: Effects of CT section thickness and reconstruction kernel on emphysema quantification relationship to the magnitude of the CT emphysema index. Acad Radiol 2010; 17: pp. 146-156.
115. Jha S.: The allure of quantification. Magn Reson Imaging 2013; 31: pp. 1035-1036.
116. Buckler A.J., Bresolin L., Dunnick N.R., et. al.: A collaborative enterprise for multi-stakeholder participation in the advancement of quantitative imaging. Radiology 2011; 258: pp. 906-914.
117. Buckler A.J., Bresolin L., Dunnick N.R., et. al.: Quantitative imaging test approval and biomarker qualification: interrelated but distinct activities. Radiology 2011; 259: pp. 875-884.
118. Abramson RG, Burton KR, YU JJ, et al. Methods and Challenges in Quantitative Imaging Biomarker Development. Academic Radiology: In press.