
Purpose
To investigate a multiparametric magnetic resonance imaging (MRI) approach comprising diffusion-weighted imaging (DWI), blood oxygen–dependent (BOLD), and dynamic contrast-enhanced (DCE) MRI for characterization and differentiation of primary renal cell carcinoma (RCC).
Material and Methods
Fourteen patients with clear-cell carcinoma and four patients with papillary RCC were examined with DWI, BOLD MRI, and DCE MRI at 1.5T. The apparent diffusion coefficient (ADC) was calculated with a monoexponential decay. The spin-dephasing rate R2* was derived from parametric R2* maps. DCE-MRI was analyzed using a two-compartment exchange model allowing separation of perfusion (plasma flow [F P ] and plasma volume [V P ]), permeability (permeability surface area product [PS]), and extravascular extracellular volume (V E ). Statistical analysis was performed with Wilcoxon signed-rank test, Pearson’s correlation coefficient, and receiver operating characteristic curve analysis.
Results
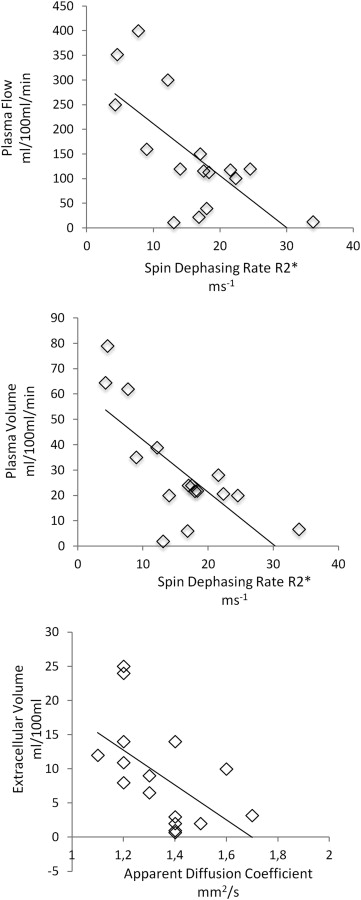
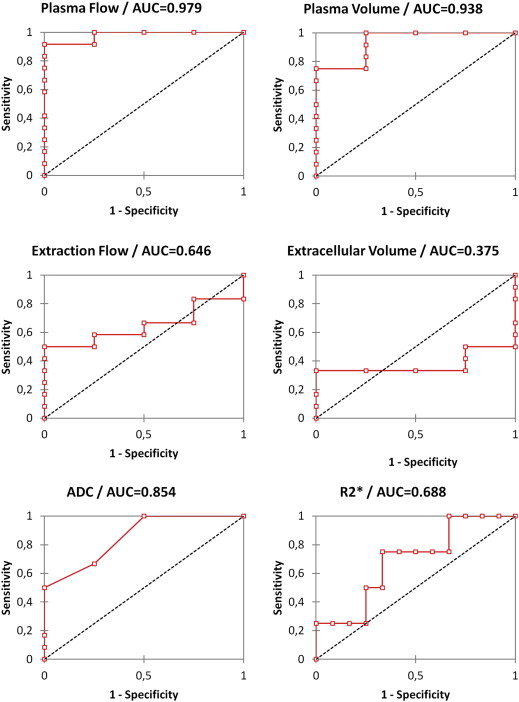
Clear-cell RCC showed higher ADC and lower R2* compared to papillary subtypes, but differences were not significant. F P of clear-cell subtypes was significantly higher than in papillary RCC. Perfusion parameters showed moderate but significant inverse correlation with R2*. V E showed moderate inverse correlation with ADC. F p and V p showed best sensitivity for histological differentiation.
Conclusion
Multiparametric MRI comprising DWI, BOLD, and DCE MRI is feasible for assessment of primary RCC. BOLD moderately correlates to DCE MRI–derived perfusion. ADC shows moderate correlation to the extracellular volume, but does not correlate to tumor oxygenation or perfusion. In this preliminary study DCE-MRI appeared superior to BOLD and DWI for histological differentiation.
Renal cell carcinoma (RCC) is the most common solid tumor of the kidney . Surgical excision (eg, total or partial nephrectomy) has been the long-standing sole therapy. With the advent of novel therapeutic agents, such as agents targeting the tyrosine kinase (TK) receptors of vascular endothelial growth factor or mammalian target of rapamycin (mTOR) , a more detailed diagnosis of RCC and differentiation of RCC subtypes has become of increasing interest. Apart from recent developments such as novel phase mask filters and newer nanosized contrast agents , functional magnetic resonance imaging (MRI) techniques such as dynamic contrast-enhanced (DCE) MRI and diffusion-weighted imaging (DWI) have been applied for characterization of tumor tissue and separation of tumor subtypes. DCE MRI assesses the transit of gadolinium derivates through the tissue as a function of time. By applying physical models, information on perfusion and permeability can be derived, which may serve as biomarkers towards antiangiogenic therapies . DWI exploits the random walk of water molecules as an endogenous contrast agent . The apparent diffusion coefficient (ADC) serves as a potentially convenient, but ambiguous measure on cellularity and perfusion and has been proposed as biological marker for tumor biology and treatment response .
Tumor oxygen levels are also an auspicious biological marker in oncology because low oxygenation levels have been shown to be linked to therapy failure and poor patient outcome . Blood oxygen level–dependent (BOLD) MRI is the only method to noninvasively assess the tissue oxygen content. It uses the paramagnetic effect of deoxyhemoglobin for indirect depiction of renal oxygenation . The concentration of deoxyhemoglobin increases with rising oxygen consumption, leading to a decreasing T2* relaxation time of the surrounding tissue. The spin dephasing rate R2* is therefore an index of the oxygenation of tissue (R2* = 1/T2*). BOLD MRI has been shown to be useful for evaluation of parenchymal kidney diseases, such as renal artery stenosis , and correlates with renal tumor histology or grade . In other tumor entities such as breast cancer, BOLD MRI provided complementary information to DCE MRI , as does BOLD MRI and DWI for the assessment of diabetic nephropathy .
Get Radiology Tree app to read full this article<
Get Radiology Tree app to read full this article<
Material and methods
Study Subjects
Get Radiology Tree app to read full this article<
Imaging
Get Radiology Tree app to read full this article<
DWI
Get Radiology Tree app to read full this article<
BOLD
Get Radiology Tree app to read full this article<
DCE MRI
Get Radiology Tree app to read full this article<
Postprocessing
Get Radiology Tree app to read full this article<
Get Radiology Tree app to read full this article<
Get Radiology Tree app to read full this article<
Get Radiology Tree app to read full this article<
Pathology
Get Radiology Tree app to read full this article<
Statistical Analysis
Get Radiology Tree app to read full this article<
Get Radiology Tree app to read full this article<
Get Radiology Tree app to read full this article<
t=r×n−2√1−r2√ t
=
r
×
n
−
2
1
−
r
2
In which df = degrees of freedom; n = number of pairs of data; and r = correlation coefficient.
Get Radiology Tree app to read full this article<
Get Radiology Tree app to read full this article<
Results
Morphology and Histology
Get Radiology Tree app to read full this article<
Table 1
Morphologic Information of Assessed Tumors
Morphology Size (cm) Necrosis Homogeneity Clear cell 5.6 ± 2.5 2 2 Papillary 4.1 ± 1.4 0 3 T1 signal Hypointense Isointense Hyperintense Clear cell 4 8 2 Papillary 2 1 1 T2 signal Hypointense Isointense Hyperintense Clear cell 3 6 5 Papillary 1 1 2 Enhancement Hypointense Isointense Hyperintense Clear cell 6 2 6 Papillary 3 1 0
Tumor signal intensity was compared to renal cortex.
Get Radiology Tree app to read full this article<
Functional Analysis
Get Radiology Tree app to read full this article<
Table 2
Results of Functional Parameters Derived from DWI (ADC), BOLD (R2*), and DCE MRI (F P , V P , V E , PS)
Histology ADC mm 2 /second R2* seconds −1 F P mL/100 mL/min V P mL/100 mL V E mL/100 mL PS mL/100 mL/min Clear cell
n = 12 1.45 ± 0.16 14.2 ± 7.5 189.1 ± 126.4 ∗ 36.5 ± 23.9 9.2 ± 9.4 3.4 ± 5.4 Papillary
n = 4 1.28 ± 0.15 21.7 ± 10.9 21.1 ± 16.4 10.01 ± 10.3 9.5 ± 1.7 1.8 ± 0.2 Necrotic
n = 2 1.76 ± 0.07 5.3 ± 1.2 NA NA NA NA
ADC, apparent diffusion coefficient; BOLD, blood oxygen–dependent; DCE, dynamic contrast-enhanced; DWI, diffusion-weighted imaging; F P , plasma flow; MRI, magnetic resonance imaging; NA, not available; PS, permeability surface area product; R2*, spin-dephasing rate; V E , extravascular extracellular volume; V P , plasma volume.
Get Radiology Tree app to read full this article<
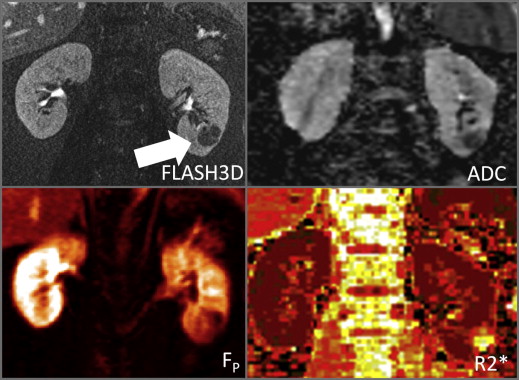
![Figure 1, Highly perfused clear cell carcinoma. A 62-year-old female patient with clear-cell renal cell carcinoma of the right lower pole ( arrow ). The tumor is highly perfused (plasma flow [F P ]: 400 mL/100 mL/minute). R2* is relatively low (7.7 seconds −1 ), suggesting rich oxygen supply, whereas apparent diffusion coefficient (ADC) is relatively high (1.7 mm 2s), suggesting a relatively low cellularity. FLASH 3D, three-dimensional fast low angle shot; R2*, spin-dephasing rate.](https://storage.googleapis.com/dl.dentistrykey.com/clinical/CombinedDiffusionWeightedBloodOxygenLevelDependentandDynamicContrastEnhancedMRIforCharacterizationandDifferentiationofRenalCellCarcinoma/0_1s20S1076633213000378.jpg)
![Figure 2, Clear carcinoma with intermediate perfusion. A 56-year-old male patient with clear cell renal cell carcinoma of the left kidney hilus ( arrow ). The tumor shows intermediate perfusion (plasma flow [F P ] 113 mL/100 mL/min) and a moderately high R2*(18.3 seconds −1 ) and apparent diffusion coefficient (ADC; 1.45 mm 2second). F P , plasma flow; HASTE, half-Fourier single-shot turbo-spin-echo; R2*, spin-dephasing rate.](https://storage.googleapis.com/dl.dentistrykey.com/clinical/CombinedDiffusionWeightedBloodOxygenLevelDependentandDynamicContrastEnhancedMRIforCharacterizationandDifferentiationofRenalCellCarcinoma/1_1s20S1076633213000378.jpg)
Get Radiology Tree app to read full this article<
Get Radiology Tree app to read full this article<
Correlation of Functional MRI Parameters
Get Radiology Tree app to read full this article<
Table 3
Correlation of Functional MRI Parameters
R2* F P V P V E PS R2* 1 −0.67 † −0.73 † 0.20 0.18 ADC 0.18 0.34 0.42 −0.57 † 0.24
ADC, apparent diffusion coefficient; F P , plasma flow; MRI, magnetic resonance imaging; PS, permeability surface area product; R2*, spin-dephasing rate; V E , extravascular extracellular volume; V P , plasma volume.
Correlation was calculated with Pearson’s correlation coefficient.
Get Radiology Tree app to read full this article<
Get Radiology Tree app to read full this article<
ROC Curve Analysis
Get Radiology Tree app to read full this article<
Table 4
Receiver Operator Characteristic Analysis of Functional MRI Parameters
Threshold AUC SE Sensitivity (%) Specificity (%) CI 95% R2* 12.1 seconds −1 0.688 0.139 100 33 0.415–0.960 ADC 1.1 mm 2 /second 0.854 0.037 100 50 0.781–0.927 F P 21 mL/100 mL/min 0.979 0.068 100 75 0.846–1.000 V P 10 mL/100 mL 0.938 0.034 100 75 0.871–1.000 PS NA 0.646 0.114 NA NA 0.422–0.870 V E NA 0.375 0.120 NA NA 0.140–0.610
ADC, apparent diffusion coefficient; AUC, area under the curve; F P , plasma flow; NA, not available; MRI, magnetic resonance imaging; PS, permeability surface area product; R2*, spin-dephasing rate; SE, standard error; V E , extravascular extracellular volume; V P , plasma volume.
Get Radiology Tree app to read full this article<
Discussion
Results of the Single Modalities
Get Radiology Tree app to read full this article<
Get Radiology Tree app to read full this article<
Get Radiology Tree app to read full this article<
Get Radiology Tree app to read full this article<
Correlation of the Techniques
Get Radiology Tree app to read full this article<
Get Radiology Tree app to read full this article<
Get Radiology Tree app to read full this article<
Get Radiology Tree app to read full this article<
Get Radiology Tree app to read full this article<
Conclusions
Get Radiology Tree app to read full this article<
References
1. Staehler M., Rohrmann K., Haseke N., et. al.: Targeted agents for the treatment of advanced renal cell carcinoma. Curr Drug Targets 2005; 6: pp. 835-846.
2. Casciaro S., Bianco R., Franchini R., et. al.: A new automatic phase mask filter for high-resolution brain venography at 3 T: theoretical background and experimental validation. Magnet Res Imaging 2010; 28: pp. 511-519.
3. Malvindi M.A., Greco A., Conversano F., et. al.: Magnetic/silica nanocomposites as dual-mode contrast agents for combined magnetic resonance imaging and ultrasonography. Adv Funct Materials 2011; 21: pp. 2548-2555.
4. Notohamiprodjo M., Sourbron S., Staehler M., et. al.: Measuring perfusion and permeability in renal cell carcinoma with dynamic contrast-enhanced MRI: a pilot study. J Magnet Res Imaging 2010; 31: pp. 490-501.
5. Notohamiprodjo M., Pederson M., Glaser C., et. al.: Comparison of Gd-DTPA and Gd-BOPTA for studying renal perfusion and filtration. J Magnet Res Imaging 2011; 34: pp. 595-607.
6. Wang H., Cheng L., Zhang X., et. al.: Renal cell carcinoma: diffusion-weighted MR imaging for subtype differentiation at 3.0 T. Radiology 2010; 257: pp. 135-143.
7. Notohamiprodjo M., Glaser C., Herrmann K.A., et. al.: Diffusion tensor imaging of the kidney with parallel imaging: initial clinical experience. Invest Radiol 2008; 43: pp. 677-685.
8. Saremi F., Sefidbakht S., Quane L., et. al.: Effect of intravenous extracellular gadolinium based contrast medium on renal diffusion weighted images. Acad Radiol 2011; 18: pp. 174-183.
9. Notohamiprodjo M., Reiser M.F., Sourbron S.P.: Diffusion and perfusion of the kidney. Eur J Radiol 2010; 76: pp. 337-347.
10. Notohamiprodjo M., Dietrich O., Horger W., et. al.: Diffusion tensor imaging (DTI) of the kidney at 3 tesla-feasibility, protocol evaluation and comparison to 1.5 Tesla. Invest Radiol 2010; 45: pp. 245-254.
11. Padhani A.R., Khan A.A.: Diffusion-weighted (DW) and dynamic contrast-enhanced (DCE) magnetic resonance imaging (MRI) for monitoring anticancer therapy. Target Oncol 2010; 5: pp. 39-52.
12. Pacheco-Torres J., Lopez-Larrubia P., Ballesteros P., et. al.: Imaging tumor hypoxia by magnetic resonance methods. NMR Biomed 2011; 24: pp. 1-16.
13. Textor S.C., Glockner J.F., Lerman L.O., et. al.: The use of magnetic resonance to evaluate tissue oxygenation in renal artery stenosis. J Am Soc Nephrol 2008; 19: pp. 780-788.
14. Min J.H., Kim C.K., Park B.K., et. al.: Assessment of renal lesions with blood oxygenation level-dependent MRI at 3 T: preliminary experience. AJR Am J Roentgenol 2011; 197: pp. W489-W494.
15. Chen J., Ding J., Wu C., et. al.: Preoperatively evaluating the correlation between pathological grades and blood oxygenation level-dependent MRI in clear cell renal cell carcinomas. Acad Radiol 2012; 20: pp. 224-230.
16. Baudelet C., Cron G.O., Gallez B.: Determination of the maturity and functionality of tumor vasculature by MRI: correlation between BOLD-MRI and DCE-MRI using P792 in experimental fibrosarcoma tumors. Magnet Res Med 2006; 56: pp. 1041-1049.
17. Ries M., Basseau F., Tyndal B., et. al.: Renal diffusion and BOLD MRI in experimental diabetic nephropathy. Blood oxygen level-dependent. J Magnet Res Imaging 2003; 17: pp. 104-113.
18. Attenberger U.I., Sourbron S.P., Michaely H.J., et. al.: Retrospective respiratory triggering renal perfusion MRI. Acta Radiol 2010; 51: pp. 1163-1171.
19. Eng J.: Teaching receiver operating characteristic analysis: an interactive laboratory exercise. Acad Radiol 2012; 19: pp. 1452-1456.
20. Dujardin M., Sourbron S., Luypaert R., et. al.: Quantification of renal perfusion and function on a voxel-byvoxel basis: a feasibility study. Magn Reson Med 2005; 54: pp. 841-849.
21. Eng J.: Sampling the latest work in receiver operating characteristic analysis: what does it mean?. Acad Radiol 2012; 19: pp. 1449-1451.
22. Dutcher J.P., de Souza P., McDermott D., et. al.: Effect of temsirolimus versus interferon-alpha on outcome of patients with advanced renal cell carcinoma of different tumor histologies. Med Oncol 2009; 26: pp. 202-209.
23. Flaherty K.T., Rosen M.A., Heitjan F.H., et. al.: Pilot study of DCE-MRI to predict progression-free survival with sorafenib therapy in renal cell carcinoma. Cancer Biol Ther 2008; 7: pp. 496-501.
24. Taouli B., Thakur R.K., Mannelli L., et. al.: Renal lesions: characterization with diffusion-weighted imaging versus contrast-enhanced MR imaging. Radiology 2009; 251: pp. 398-407.
25. Le Bihan D., Breton E., Lallemand D., et. al.: MR imaging of intravoxel incoherent motions: application to diffusion and perfusion in neurologic disorders. Radiology 1986; 161: pp. 401-407.
26. Chandarana H., Lee V.S., Hecht E., et. al.: Comparison of biexponential and monoexponential model of diffusion weighted imaging in evaluation of renal lesions: preliminary experience. Inves Radiol 2011; 46: pp. 285-291.
27. Tofts P.S., Brix G., Buckley D.L., et. al.: Estimating kinetic parameters from dynamic contrast-enhanced T(1)-weighted MRI of a diffusable tracer: standardized quantities and symbols. J Magn Reson Imaging 1999; 10: pp. 223-232.
28. Sourbron S.P., Buckley D.L.: On the scope and interpretation of the Tofts models for DCE-MRI. Magnet Res Med 2011; 66: pp. 735-745.
29. Donaldson S.B., West C.M., Davidson S.E., et. al.: A comparison of tracer kinetic models for T1-weighted dynamic contrast-enhanced MRI: application in carcinoma of the cervix. Magnet Res Med 2010; 63: pp. 691-700.
30. Luypaert R., Sourbron S., de Mey J.: Validity of perfusion parameters obtained using the modified Tofts model: a simulation study. Magnet Res Med 2011; 65: pp. 1491-1497.