
Rationale and Objectives
To determine if combination of washout and noncontrast data from delayed adrenal computed tomography (CT) improves diagnostic performance, and demonstration of an optimizing analytical framework.
Materials and Methods
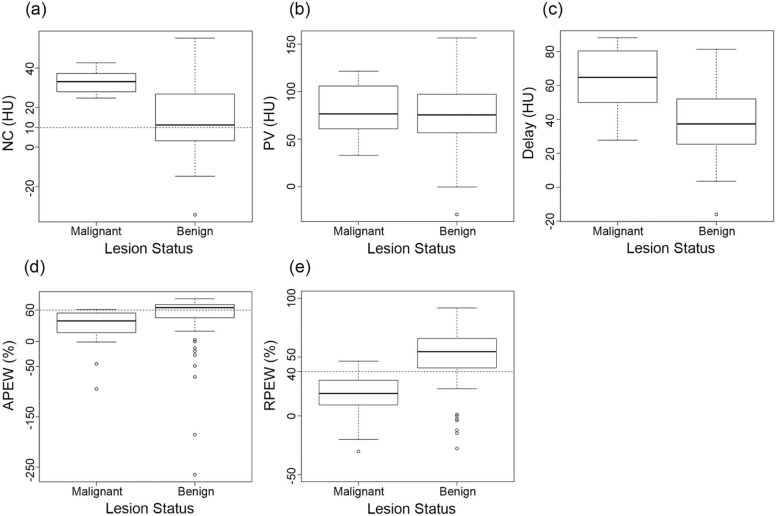
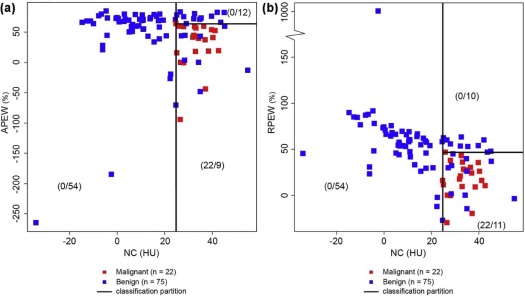
This retrospective study consisted of 97 adrenal lesions, in 96 patients, with pathologically proven adrenal lesions (75 benign; 22 malignant), who had undergone noncontrast, portal- and approximate 15-minute delayed-phase CT. Lesion CT attenuations (Hounsfield units [HU]) during each phase, and “absolute” and “relative” percent enhancement washouts (APEW and RPEW) were assessed. The optimum combination of sequential parameters and thresholds was determined by recursive partitioning analysis; resultant diagnostic performance was compared to commonly applied single-parameter criteria for malignancy (noncontrast > 10 HU, APEW < 60%, RPEW < 40%).
Results
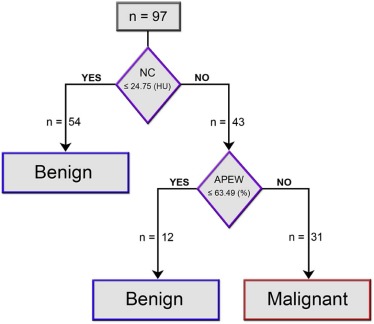
The above single-parameter criteria yielded sensitivities, specificities, and accuracies for malignancy of 100.0%, 41.3%, and 54.6%; 97.9%, 61.3%, and 69.1%; and 96.6%, 74.7%, and 78.4%, respectively. Recursive partitioning analysis identified noncontrast ≥24.75 HU, with subsequent APEW ≤63.49%, as the optimum sequential parameter-threshold combination, which yielded increased sensitivity, specificity, and accuracy of 100.0%, 85.3%, and 90.7%, respectively. Discrimination using the combined sequential classifier yielded statistically significant improvements in accuracy when compared to the above conventional single-parameter criteria (all P ≤ .039).
Conclusion
Sequential application of noncontrast and washout criteria from delayed contrast-enhanced adrenal CT can improve diagnostic performance beyond that of commonly applied single-parameter criteria. Validation of the sequential ordering and refinement of the specific threshold values warrant further study.
Introduction
Adrenal lesions are encountered in a variety of clinical settings, ranging from purely incidental, where the estimated incidence is as high as 9% of abdominal computed tomographies (CTs) , to cancer staging, where the incidence can be expected to be even higher. Whatever the clinical setting, their detection typically presents radiologists and clinicians with the challenge of differentiating whether they might be malignant and benign.
A variety of clinical and imaging-based algorithms have been developed to assist in the management of such lesions, for example, by Berland et al. . A fundamental component of this and many algorithms is the utilization of delayed (10–15 minutes post contrast) washout adrenal protocol CT, and the application of cutoff thresholds to categorize malignancy and benignity. Commonly applied thresholds are 60% for “absolute percent enhancement washout” (APEW), and 40% for “relative percent enhancement washout” (RPEW) . Many algorithms incorporate a preceding decision-node based on noncontrast (NC) CT attenuation of the lesion (typically with a threshold of 10 Hounsfield units [HU]). Application of such consecutive CT evaluations with associated cutoff criteria has been shown to yield very high diagnostic performances . Some work has suggested that application of combined sequential thresholds to the adrenal protocol itself may yield high sensitivities and specificities . However, as suggested by a recent careful meta-analysis, there is considerable room for more careful studies and improvements in diagnostic performance of imaging evaluations . To the best of our knowledge, application of optimization methodologies to improve diagnostic performance using the data available in the adrenal protocol CT itself has not been explored.
Get Radiology Tree app to read full this article<
Materials and Methods
Get Radiology Tree app to read full this article<
Get Radiology Tree app to read full this article<
Get Radiology Tree app to read full this article<
CT Scan
Get Radiology Tree app to read full this article<
CT Analysis
Get Radiology Tree app to read full this article<
Get Radiology Tree app to read full this article<
Get Radiology Tree app to read full this article<
Absolute PEW(APEW)=[(PV−DL)/(PV−NC)]∗100 Absolute PEW
(
APEW
)
=
[
(
PV
−
DL
)
/
(
PV
−
NC
)
]
∗
100
Relative PEW(RPEW)=[(PV−DL)/(PV)]∗100 Relative PEW
(
RPEW
)
=
[
(
PV
−
DL
)
/
(
PV
)
]
∗
100
where NC, PV, and DL are the mean attenuations on NC, portal-venous, and delayed-phase contrast-enhanced CT, respectively .
Get Radiology Tree app to read full this article<
Statistical Analysis
Get Radiology Tree app to read full this article<
Get Radiology Tree app to read full this article<
Get Radiology Tree app to read full this article<
Get Radiology Tree app to read full this article<
Results
Get Radiology Tree app to read full this article<
Get Radiology Tree app to read full this article<
Get Radiology Tree app to read full this article<
Get Radiology Tree app to read full this article<
Get Radiology Tree app to read full this article<
Diagnostic Performance Using Commonly applied Thresholds
Get Radiology Tree app to read full this article<
TABLE 1
Sensitivity, Specificity, Positive Predictive Value (PPV), Negative Predictive Value (NPV) and Accuracy for Malignancy, at “Commonly-applied” and “Optimum” Cutoff Thresholds
Method Parameter First Cutoff Threshold Second Cutoff Threshold Sens (%) Spec (%) PPV (%) NPV (%) Accuracy (%) Accuracy 95% CI “Commonly-applied” Single NC > 10 HU N/A 100.0 41.3 33.3 100.0 54.6 44.2–64.8 Single APEW < 60 % N/A 97.9 61.3 42.0 95.5 69.1 58.9–78.1 Single RPEW < 40 % N/A 96.6 74.7 51.3 90.9 78.4 68.8–86.1 Combined NC > 10 HU APEW ≤ 60 % 95.5 74.7 52.5 98.2 79.4 70.0–86.9 Combined NC > 10 HU RPEW ≤ 40 % 90.1 77.3 54.1 96.7 80.4 71.1–87.8 “Optimum” Single NC ≥ 24.75 HU N/A 100.0 72.0 51.2 100.0 78.4 68.8–86.1 Single APEW ≤ 59.25 % N/A 90.9 66.7 44.4 96.2 72.2 62.1–80.8 Single RPEW ≤ 43.38 % N/A 95.5 73.3 51.2 98.2 78.4 68.8–86.1 Combined \* NC ≥ 24.75 HU APEW ≤ 63.49 % 100.0 88.0 71.0 100.0 90.7 83.1–95.7 Combined NC ≥ 24.75 HU RPEW ≤ 46.63 % 100.0 85.3 66.7 100.0 88.7 80.6–94.2
95% CI, 95% confidence interval.
Get Radiology Tree app to read full this article<
Get Radiology Tree app to read full this article<
Get Radiology Tree app to read full this article<
Diagnostic Performance Using “Optimized” Thresholds
Get Radiology Tree app to read full this article<
Get Radiology Tree app to read full this article<
Get Radiology Tree app to read full this article<
Get Radiology Tree app to read full this article<
Discussion
Get Radiology Tree app to read full this article<
Get Radiology Tree app to read full this article<
Get Radiology Tree app to read full this article<
Get Radiology Tree app to read full this article<
Get Radiology Tree app to read full this article<
Get Radiology Tree app to read full this article<
Get Radiology Tree app to read full this article<
Get Radiology Tree app to read full this article<
Get Radiology Tree app to read full this article<
Get Radiology Tree app to read full this article<
Get Radiology Tree app to read full this article<
Get Radiology Tree app to read full this article<
Get Radiology Tree app to read full this article<
Get Radiology Tree app to read full this article<
Conclusions
Get Radiology Tree app to read full this article<
Funding
Get Radiology Tree app to read full this article<
Get Radiology Tree app to read full this article<
References
1. Glazer H.S., Weyman P.J., Sagel S.S., et. al.: Nonfunctioning adrenal masses: incidental discovery on computed tomography. AJR Am J Roentgenol 1982; 139: pp. 81-85.
2. Dunnick N.R., Korobkin M., Francis I.: Adrenal radiology: distinguishing benign from malignant adrenal masses. AJR Am J Roentgenol 1996; 167: pp. 861-867.
3. Berland L.L., Silverman S.G., Gore R.M., et. al.: Managing incidental findings on abdominal CT: white paper of the ACR incidental findings committee. J Am Coll Radiol 2010; 7: pp. 754-773.
4. Caoili E.M., Korobkin M., Francis I.R., et. al.: Adrenal masses: characterization with combined unenhanced and delayed enhanced CT. Radiology 2002; 222: pp. 629-633.
5. Blake M.A., Kalra M.K., Sweeney A.T., et. al.: Distinguishing benign from malignant adrenal masses: multi-detector row CT protocol with 10-minute delay. Radiology 2006; 238: pp. 578-585.
6. Dinnes J., Bancos I., Ferrante di Ruffano L., et. al.: Management of endocrine disease: imaging for the diagnosis of malignancy in incidentally discovered adrenal masses: a systematic review and meta-analysis. Eur J Endocrinol 2016; 175: pp. R51-R64.
7. Schneider C.A., Rasband W.S., Eliceiri K.W.: NIH Image to ImageJ: 25 years of image analysis. Nat Methods 2012; 9: pp. 671-675.
8. Szolar D.H., Kammerhuber F.H.: Adrenal adenomas and nonadenomas: assessment of washout at delayed contrast-enhanced CT. Radiology 1998; 207: pp. 369-375.
9. Youden W.J.: Index for rating diagnostic tests. Cancer 1950; 3: pp. 32-35.
10. Breiman L., Friedman J., Olshen R., et. al.: Classification and regression trees.1984.WadsworthBelmont
11. Hastie T., Tibshirani R., Friedman J.: The elements of statistical learning: data mining, inference, and prediction.2nd ed.2009.Springer
12. Fagerland M.W., Lydersen S., Laake P.: Recommended tests and confidence intervals for paired binomial proportions. Stat Med 2014; 33: pp. 2850-2875.
13. Team RDC : R: A language and environment for statistical computing. Vienna, Austria: R Foundation for Statistical Computing2009.
14. Therneau T.M., Atkinson B.: RPART: recursive partitioning. In B. Ripley, R port. R package version 3.1-412008.
15. Park S.W., Kim T.N., Yoon J.H., et. al.: The washout rate on the delayed CT image as a diagnostic tool for adrenal adenoma verified by pathology: a multicenter study. Int Urol Nephrol 2012; 44: pp. 1397-1402.
16. Sangwaiya M.J., Boland G.W., Cronin C.G., et. al.: Incidental adrenal lesions: accuracy of characterization with contrast-enhanced washout multidetector CT—10-minute delayed imaging protocol revisited in a large patient cohort. Radiology 2010; 256: pp. 504-510.
17. Lee J.H., Kim E.K., Hong A.R., et. al.: Radiographic characteristics of adrenal masses in oncologic patients. Endocrinol Metab (Seoul) 2016; 31: pp. 147-152.
18. Choi Y.A., Kim C.K., Park B.K., et. al.: Evaluation of adrenal metastases from renal cell carcinoma and hepatocellular carcinoma: use of delayed contrast-enhanced CT. Radiology 2013; 266: pp. 514-520.
19. Bae K.T., Fuangtharnthip P., Prasad S.R., et. al.: Adrenal masses: CT characterization with histogram analysis method. Radiology 2003; 228: pp. 735-742.
20. Hammarstedt L., Thilander-Klang A., Muth A., et. al.: Adrenal lesions: variability in attenuation over time, between scanners, and between observers. Acta Radiol 2013; 54: pp. 817-826.
21. Jhaveri K.S., Wong F., Ghai S., et. al.: Comparison of CT histogram analysis and chemical shift MRI in the characterization of indeterminate adrenal nodules. AJR Am J Roentgenol 2006; 187: pp. 1303-1308.
22. Lamba R., McGahan J.P., Corwin M.T., et. al.: CT Hounsfield numbers of soft tissues on unenhanced abdominal CT scans: variability between two different manufacturers’ MDCT scanners. AJR Am J Roentgenol 2014; 203: pp. 1013-1020.