
Rationale and Objectives
Most studies of computer-aided detection (CAD) for pulmonary nodules have focused on solid nodule detection. The aim of this study was to evaluate the performance of a commercially available CAD system in the detection of pulmonary nodules with or without ground-glass opacity (GGO) using 64-detector-row computed tomography compared to visual interpretation.
Materials and Methods
Computed tomographic examinations were performed on 48 patients with existing or suspicious pulmonary nodules on chest radiography. Three radiologists independently reported the location and pattern (GGO, solid, or part solid) of each nodule candidate on computed tomographic scans, assigned each a confidence score, and then analyzed all scans using the CAD system. A reference standard was established by a consensus panel of different radiologists, who found 229 noncalcified nodules with diameters ≥ 4 mm. True-positive and false-positive results and confidence levels were used to generate jackknife alternative free-response receiver-operating characteristic plots.
Results
The sensitivity of GGO for 3 radiologists (60%–80%) was significantly higher than that for the CAD system (21%) (McNemar’s test, P < .0001). For overall and solid nodules, the figure-of-merit values without and with the CAD system were significantly different ( P = .005–.04) on jackknife alternative free-response receiver-operating characteristic analysis. For GGO and part-solid nodules, the figure-of-merit values with the CAD system were greater than those without the CAD system, indicating no significant differences.
Conclusion
Radiologists are significantly superior to this CAD system in the detection of GGO, but the CAD system can still play a complementary role in detecting nodules with or without GGO.
The accurate identification of pulmonary nodules is essential for the diagnosis of various pathologic conditions. The recent development of multi-detector-row computed tomography (MDCT) has made it possible to acquire thin-slice images of the whole lung within one breath hold. Thin-slice images enable the detection of small pulmonary nodules that are ambiguous or not visible on thick-slice images . However, it is a well-known problem that false-negative diagnoses are caused by perceptual errors or misinterpretations by radiologists . To reduce the incidence of false-negative diagnoses, double reading has been recommended . It has been reported that the use of computer-aided detection (CAD) as the second reader improves nodule detection on chest radiography or computed tomography and is especially useful in routine clinical settings because of limited human resources.
Generally, pulmonary nodules can be classified into three categories on the basis of the internal density of the nodules: solid, localized ground-glass opacity (GGO), and part solid nodule. Solid nodules are characterized by high contrast on computed tomography, localized GGO is characterized by a hazy increase in lung attenuation that does not obscure the underlying vascular markings , and part-solid nodules exhibit the characteristics of both solid nodules and localized GGO. However, most studies of CAD for pulmonary nodules have focused on solid nodule detection.
Get Radiology Tree app to read full this article<
Materials and methods
Patient Selection and Imaging
Get Radiology Tree app to read full this article<
Get Radiology Tree app to read full this article<
Image Interpretation by Three Independent Radiologists
Get Radiology Tree app to read full this article<
Table 1
Summary of Nodule Location and Confidence Ratings
Description Nodule location Isolated nodule Solitary nodule Nodule with another nodule Nodule that contacts another nodule Juxtavascular nodule Nodule that contacts the vessel margin Nodule with vessel Nodule penetrated by a vessel Pleural nodule Nodule that contacts the costal, mediastinal, and fissural pleura Confidence rating 1 Nodule probably not present 2 Nodule presence equivocal 3 Nodule probably present 4 Nodule definitely present 0 Undetected ∗
Get Radiology Tree app to read full this article<
Get Radiology Tree app to read full this article<
Get Radiology Tree app to read full this article<
Reference Standard
Get Radiology Tree app to read full this article<
Criterion for Evaluating Findings Detected by the CAD System
Get Radiology Tree app to read full this article<
Statistical Analysis
Get Radiology Tree app to read full this article<
Get Radiology Tree app to read full this article<
Results
Results of Reference Standard and CAD Alone
Get Radiology Tree app to read full this article<
Table 2
Average Diameter of Each Nodule with Three Radiologic Patterns
Reference Standard CAD System Pattern of Nodule Number Mean ± SD Size (mm) Size Range (mm) Number Mean ± SD Size (mm) Size Range (mm) Overall 229 6.8 ± 4.7 4–30 92 6.2 ± 4.1 4–30 GGO 102 5.8 ± 2.9 4–24 21 5.8 ± 1.4 4–10 Solid (total) 100 6.4 ± 4.6 4–30 58 5.8 ± 4.4 4–30 With smooth margin 58 5.6 ± 3.5 4–22 37 4.7 ± 1.2 4–8 With irregular margin 42 7.6 ± 5.7 4–30 21 7.9 ± 6.8 4–30 Part solid 27 11.6 ± 6.9 4–30 13 8.2 ± 5.3 4–24
CAD, computer-aided detection; GGO, ground-glass opacity; SD, standard deviation.
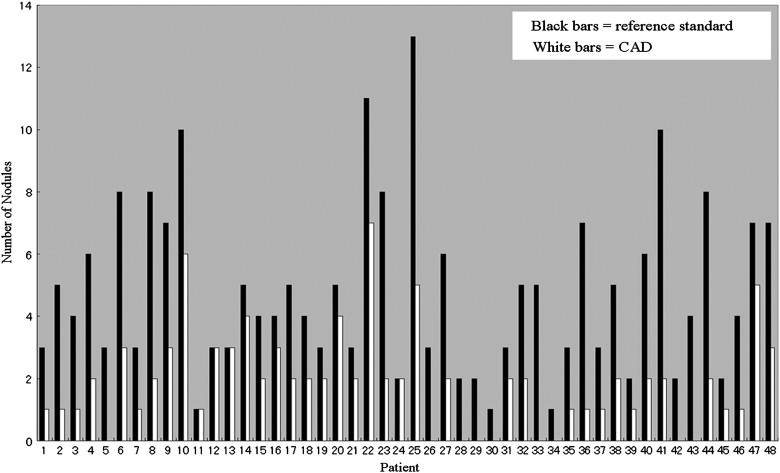
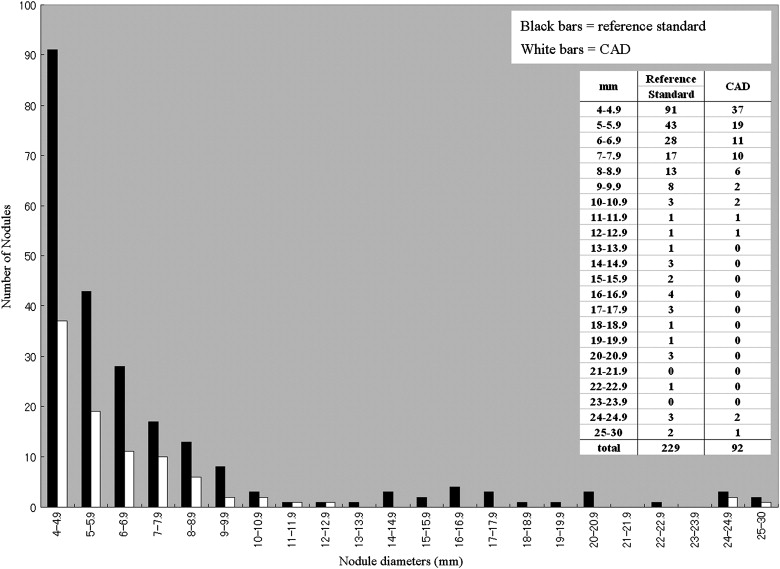
Table 3
False-Positive Findings for the Computer-Aided Detection System
Finding Number Pleural changes (small pleural thickening and inflammatory changes) 127 Peripheral vessel 89 Central vessel 15 Scars 27 Mucoid impaction of bronchus 12 Scanning artifacts due to respiratory or cardiac motion artifacts 4 Total 274
Get Radiology Tree app to read full this article<
Get Radiology Tree app to read full this article<
Table 4
Number of Nodules Detected by CAD Alone According to Location
Nodule Location ∗ Pattern of Nodule 1 2 3 4 5 Overall 15 (38) 9 (16) 12 (39) 21 (53) 35 (83) GGO 1 (22) 3 (3) 4 (27) 11 (29) 2 (21) Solid (total) 12 (14) 4 (10) 7 (8) 6 (10) 29 (58) With smooth margin 10 (12) 2 (8) 2 (2) 0 (0) 23 (36) With irregular margin 2 (2) 2 (2) 5 (6) 6 (10) 6 (22) Part solid 2 (2) 2 (3) 1 (4) 4 (14) 4 (4)
CAD, computer-aided detection; GGO, ground-glass opacity. There were no significant differences in the locations of nodules detected by the CAD system alone ( P = .54). Numbers outside the parentheses show nodules detected by CAD.
Get Radiology Tree app to read full this article<
Get Radiology Tree app to read full this article<
Comparisons Between the CAD System and Radiologists
Get Radiology Tree app to read full this article<
Table 5
Number of False-Positive Findings per Scan and Sensitivity Data for the Detection of Each Nodule with Three Radiologic Patterns
Radiologist 1 Radiologist 2 Radiologist 3 Variable CAD System Without CAD With CAD Without CAD With CAD Without CAD With CAD False-positive findings Mean per scan 5.7 1.4 1.9 0.5 0.6 1.4 1.8 Range per scan 0–24 0–5 0–7 0–3 0–3 0–6 0–7 Pattern of nodule Overall 92/229 (40) ∗ 137/229 (59) ∗ 175/229 (76) 135/229 (58) ∗ 157/229 (69) 182/229 (79) ∗ 200/229 (87) GGO 21/102 (21) † 71/102 (70) † 77/102 (75) 61/102 (60) † 65/102 (65) 82/102 (80) † 85/102 (83) Solid (total) 58/100 (58) 47/100 (47) 74/100 (74) 50/100 (50) 67/100 (67) 75/100 (75) 89/100 (89) With smooth margin 37/58 (64) 29/58 (50) 47/58 (81) 25/58 (43) 37/58 (64) 36/58 (62) 48/58 (83) With irregular margin 21/42 (50) ‡ 18/42 (43) 27/42 (64) 25/42 (60) 30/42 (71) 39/42 (93) ‡ 41/42 (98) Part solid 13/27 (48) § 19/27 (70) 24/27 (89) 24/27 (89) § 25/27 (93) 25/27 (93) § 26/27 (96)
CAD, computer-aided detection; GGO, ground-glass opacity. Numbers in parentheses show percentage detection.
Get Radiology Tree app to read full this article<
Get Radiology Tree app to read full this article<
Get Radiology Tree app to read full this article<
Get Radiology Tree app to read full this article<
Get Radiology Tree app to read full this article<
JAFROC Analysis
Get Radiology Tree app to read full this article<
Table 6
FOM Values Obtained from JAFROC Analysis for Each Radiologist in the Detection of All Pulmonary Nodules without and with the CAD system
Radiologist 1 Radiologist 2 Radiologist 3 Pattern of Nodule FOM (95% CI) Statistical Difference FOM (95% CI) Statistical Difference FOM (95% CI) Statistical Difference Overall Without CAD 0.535 (0.464–0.606)P = .02 ∗ 0.634 (0.553–0.709)P = .04 ∗ 0.808 (0.761–0.848)P = .02 ∗ With CAD 0.606 (0.530–0.679) 0.662 (0.578–0.738) 0.842 (0.798–0.879) GGO Without CAD 0.693 (0.605–0.771)P = .06 0.757 (0.682–0.821)P = .32 0.772 (0.686–0.844)P = .29 With CAD 0.731 (0.645–0.805) 0.770 (0.693–0.834) 0.781 (0.695–0.852) Solid (total) Without CAD 0.627 (0.550–0.698)P = .04 ∗ 0.612 (0.529–0.690)P = .005 ∗ 0.762 (0.687–0.825)P = .04 ∗ With CAD 0.701 (0.619–0.775) 0.719 (0.640–0.789) 0.833 (0.766–0.886) Solid (with smooth margins) Without CAD 0.643 (0.540–0.736)P = .04 ∗ 0.580 (0.472–0.683)P = .03 ∗ 0.682 (0.574–0.776)P = .03 ∗ With CAD 0.743 (0.638–0.830) 0.690 (0.582–0.784) 0.792 (0.691–0.871) Solid (with irregular margins) Without CAD 0.605 (0.489–0.712)P = .14 0.654 (0.524–0.768)P = .06 0.871 (0.770–0.936)P = .63 With CAD 0.675 (0.547–0.785) 0.766 (0.644–0.861) 0.855 (0.750–0.926) Part solid Without CAD 0.759 (0.615–0.867)P = .18 0.936 (0.837–0.981)P = .33 0.950 (0.850–0.988)P = .33 With CAD 0.831 (0.700–0.918) 0.957 (0.864–0.990) 0.971 (0.885–0.995)
CAD, computer-aided detection; CI, confidence interval; FOM, figure of merit; GGO, ground-glass opacity; JAFROC, jackknife alternative free-response receiver-operating characteristic.
Get Radiology Tree app to read full this article<
Get Radiology Tree app to read full this article<
Discussion
Get Radiology Tree app to read full this article<
Get Radiology Tree app to read full this article<
Get Radiology Tree app to read full this article<
Get Radiology Tree app to read full this article<
Get Radiology Tree app to read full this article<
Get Radiology Tree app to read full this article<
Get Radiology Tree app to read full this article<
References
1. Fischbach F., Knollmann F., Griesshaber V., et. al.: Detection of pulmonary nodules by multislice computed tomography: improved detection rate with reduced slice thickness. Eur Radiol 2003; 13: pp. 2378-2383.
2. Li F., Sone S., Abe H., et. al.: Lung cancers missed at low-dose helical CT screening in a general population: comparison of clinical, histopathologic, and imaging findings. Radiology 2002; 225: pp. 673-683.
3. Armato S.G., Li F., Giger M.L., et. al.: Lung cancer: performance of automated lung nodule detection applied to cancers missed in a CT screening program. Radiology 2002; 225: pp. 685-692.
4. Shah P.K., Austin J.H., White C.S., et. al.: Missed non–small cell lung cancer: radiographic findings of potentially resectable lesions evident only in retrospect. Radiology 2003; 226: pp. 235-241.
5. Wormanns D., Ludwig K., Beyer F., et. al.: Detection of pulmonary nodules at multirow-detector CT: effectiveness of double reading to improve sensitivity at standard-dose and low-dose chest CT. Eur Radiol 2005; 15: pp. 14-22.
6. MacMahon H.: Improvement in detection of pulmonary nodules: digital image processing and computer-aided diagnosis. Radiographics 2000; 20: pp. 1169-1177.
7. Rubin G.D., Lyo J.K., Paik D.S., et. al.: Pulmonary nodules on multi-detector row CT scans: performance comparison of radiologists and computer-aided detection. Radiology 2005; 234: pp. 274-283.
8. Marten K., Seyfarth T., Auer F., et. al.: Computer-assisted detection of pulmonary nodules: performance evaluation of an expert knowledge-based detection system in consensus reading with experienced and inexperienced chest radiologists. Eur Radiol 2004; 14: pp. 1930-1938.
9. Brown M.S., Goldin J.G., Suh R.D., et. al.: Lung micronodules: automated method for detection at thin-section CT—initial experience. Radiology 2003; 226: pp. 256-262.
10. Das M., Mühlenbruch G., Mahnken A.H., et. al.: Small pulmonary nodules: effect of two computer-aided detection systems on radiologist performance. Radiology 2006; 241: pp. 564-571.
11. Austin J.H.M., Muller N.L., Friedman P.J., et. al.: Glossary of terms for CT of the lung: recommendations of the Nomenclature Committee of the Fleischner Society. Radiology 1996; 200: pp. 327-331.
12. Chakraborty D.P., Berbaum K.S.: Observer studies involving detection and localization: modeling, analysis, and validation. Med Phys 2004; 31: pp. 2313-2330.
13. Chakraborty D.P.: Maximum likelihood analysis of free-response receiver operating characteristic (FROC) data. Med Phys 1989; 16: pp. 561-568.
14. Chakraborty D.P., Winter L.H.: Free-response methodology: alternate analysis and a new observer-performance experiment. Radiology 1990; 174: pp. 873-881.
15. Metz C.E.: Evaluation of CAD methods.Doi K.MacMahon H.Giger M.L.Hoffman K.R.Computer-aided diagnosis in medical imaging.1999.Elsevier ScienceAmsterdam, the Netherlands:pp. 543-554.
16. Edwards D.C., Kupinski M.A., Metz C.E., et. al.: Maximum likelihood fitting of FROC curves under an initial-detection-and-candidate-analysis model. Med Phys 2002; 29: pp. 2861-2870.
17. Doi K., MacMahon H., Katsuragawa S., et. al.: Computer-aided diagnosis in radiology: potential and pitfalls. Eur J Radiol 1999; 31: pp. 97-109.
18. Chakraborty D.P.: Validation and statistical power comparison of methods for analyzing free-response observer performance studies. Acad Radiol 2008; 15: pp. 1554-1566.
19. Brown M.S., McNitt-Gray M.F., Goldin J.G., et. al.: Patient-specific models for lung nodule detection and surveillance in CT images. IEEE Trans Med Imaging 2001; 20: pp. 1242-1250.
20. Armato S.G., Giger M.L., MacMahon H.: Automated detection of lung nodules in CT scans: preliminary results. Med Phys 2001; 28: pp. 1552-1561.
21. Lee Y., Hara T., Fujita H., et. al.: Automated detection of pulmonary nodules in helical CT images based on an improved template-matching technique. IEEE Trans Med Imaging 2001; 20: pp. 595-604.
22. Gurcan M.N., Sahiner B., Petrick N., et. al.: Lung nodule detection on thoracic computed tomography images: preliminary evaluation of a computer-aided diagnosis system. Med Phys 2002; 29: pp. 2552-2558.
23. Wormanns D., Fiebich M., Saidi M., et. al.: Automatic detection of pulmonary nodules at spiral CT: clinical application of a computer-aided diagnosis system. Eur Radiol 2002; 12: pp. 1052-1057.
24. Awai K., Murao K., Ozawa A., et. al.: Pulmonary nodules at chest CT: effect of computer-aided diagnosis on radiologists’ detection performance. Radiology 2004; 230: pp. 347-352.
25. Brochu B., Beiqelman-Aubry C., Goldmard J.L., et. al.: Computer-aided detection of lung nodules on thin collimation MDCT: impact on radiologists’ performance. J Radiol 2007; 88: pp. 573-578.
26. Capobianco J., Jasinowodolinski D., Szarf G.: Detection of pulmonary nodules by computer-aided diagnosis in multidetector computed tomography: preliminary study of 24 cases. J Bras Pneumol 2008; 34: pp. 27-33.
27. White C.S., Pugatch R., Koonce T., et. al.: Lung nodule CAD software as a second reader: a multicenter study. Acad Radiol 2008; 15: pp. 326-333.
28. Hirose T., Nitta N., Shiraishi J., et. al.: Evaluation of computer-aided diagnosis (CAD) software for the detection of lung nodules on multidetector row computed tomography (MDCT): JAFROC study for the improvement in radiologists’ diagnostic accuracy. Acad Radiol 2008; 15: pp. 1505-1512.
29. Lee J.W., Jeong J.W., Lee S., et. al.: The GGO lesions detected by computer-aided detection system on chest MDCT images. Conf Proc IEEE Eng Med Biol Soc 2006; 1: pp. 1983-1985.
30. Ye X., Lin X., Beddoe G., et. al.: Efficient computer-aided detection of ground-glass opacity nodules in thoracic CT images. Conf Proc IEEE Eng Med Biol Soc 2007; 2007: pp. 4449-4452.
31. Li Q., Li F., Doi K.: Computerized detection of lung nodules in thin-section CT images by use of selective enhancement filters and an automated rule-based classifier. Acad Radiol 2008; 15: pp. 165-175.
32. Yanagawa M., Tomiyama N., Sumikawa H., et. al.: Thin-section CT of lung without ECG gating: 64-detector row CT can markedly reduce cardiac motion artifact which can simulate lung lesions. Eur J Radiol 2009; 69: pp. 102-107.
33. Zhao B., Gamsu G., Ginsber M.S., et. al.: Automatic detection of small lung nodules on CT utilizing a local density maximum algorithm. J Appl Clin Med Phys 2003; 4: pp. 248-260.
34. Marten K., Grillhösl A., Seyfarth T., et. al.: Computer-assisted detection of pulmonary nodules: evaluation of diagnostic performance using an expert knowledge-based detection system with variable reconstruction slice thickness settings. Eur Radiol 2005; 15: pp. 203-212.
35. Aoki T., Tomoda Y., Watanabe H., et. al.: Peripheral lung adenocarcinoma: correlation of thin-section CT findings with histologic prognostic factors and survival. Radiology 2001; 220: pp. 803-809.
36. Aoki T., Nakata H., Watanabe H., et. al.: Evolution of peripheral lung adenocarcinomas: CT findings correlated with histology and tumor doubling time. AJR Am J Roentgenol 2000; 174: pp. 763-768.
37. Jang H.J., Lee K.S., Kwon O.J., et. al.: Bronchioloalveolar carcinoma: focal area of ground-glass attenuation at thin-section CT as an early sign. Radiology 1996; 199: pp. 485-488.
38. Lee J.W., Goo J.M., Lee H.J., et. al.: The potential contribution of a computer-aided detection system for lung nodule detection in multidetector row computed tomography. Invest Radiol 2004; 39: pp. 649-655.
39. Godoy M.C., Cooperberg P.L., Maizlin V.Z., et. al.: Detection sensitivity of a commercial lung nodule CAD system in a series of pathologically proven lung cancers. J Thorac Imaging 2008; 23: pp. 1-6.
40. Yuan R., Vos P.M., Cooperberg P.L.: Computer-aided detection in screening CT for pulmonary nodules. AJR Am J Roentgenol 2006; 186: pp. 1280-1287.