
Rationale and Objectives
We conducted an observer study to investigate how the data collection method affects the efficacy of modeling individual radiologists’ judgments regarding the perceptual similarity of breast masses on mammograms.
Materials and Methods
Six observers of varying experience levels in breast imaging were recruited to assess the perceptual similarity of mammographic masses. The observers’ subjective judgments were collected using (i) a rating method, (ii) a preference method, and (iii) a hybrid method combining rating and ranking. Personalized user models were developed with the collected data to predict observers’ opinions. The relative efficacy of each data collection method was assessed based on the classification accuracy of the resulting user models.
Results
The average accuracy of the user models derived from data collected with the hybrid method was 55.5 ± 1.5%. The models were significantly more accurate ( P < .0005) than those derived from the rating (45.3 ± 3.5%) and the preference (40.8 ± 5%) methods. On average, the rating data collection method was significantly faster than the other two methods ( P < .0001). No time advantage was observed between the preference and the hybrid methods.
Conclusions
A hybrid method combining rating and ranking is an intuitive and efficient way for collecting subjective similarity judgments to model human perceptual opinions with a higher accuracy than other, more commonly used data collection methods.
Collecting people’s opinions regarding the visual similarity of images is a critical building block for developing content-based image retrieval (CBIR) systems . In recent years, CBIR has been proposed in clinical imaging to enhance clinical decision support and training systems with visually similar cases retrieved from a reference image library, thus emulating the evidence-based clinical paradigm . The reliability of the developed CBIR technology is closely tied to image similarity metrics that correlate highly with human perceptual opinions. The development and validation of such metrics depend on the number and diversity of medical images presented to radiologists during the data collection process, which is a rather time-consuming step. Moreover, CBIR systems often disregard human perception subjectivity and embrace a generalized modeling approach to reproduce the consensus opinion of several radiologists. Relevance feedback techniques have been adopted in CBIR to capture human perception subjectivity by providing personalized fine-tuning of the image retrieval step. Still, this is work in progress in medical imaging .
The topic of perceptual subjectivity has been attracting attention in general and for radiological applications in particular with compounding evidence that the notion of visual similarity is highly subjective. Most studies use a rating-based data collection method wherein radiologists are asked to use a fixed rating scale (either continuous or discrete) to record their opinions regarding the similarity of image pairs. The rating method is well accepted in psychometric and user studies . Among its main limitations are user inconsistencies in applying a numerical scale across multiple cases and personal biases due to internal cognitive processes and individual personality traits, which often result in people using only part of the rating scale . To the best of our knowledge, there has been only one study in radiology reporting relatively good agreement between continuous scoring versus discrete scoring, but the participating radiologists were more consistent using discrete scoring rather than continuous scoring .
Get Radiology Tree app to read full this article<
Get Radiology Tree app to read full this article<
Materials and methods
Image Database
Get Radiology Tree app to read full this article<
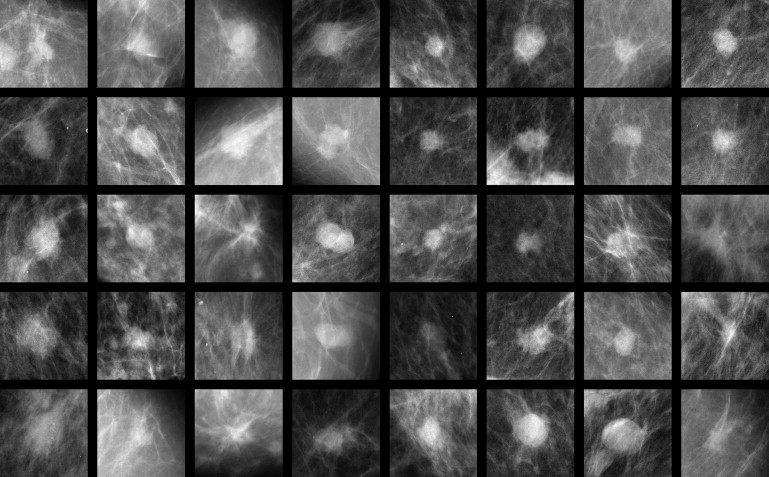
Get Radiology Tree app to read full this article<
Data Collection Method
Get Radiology Tree app to read full this article<
Rating method
Get Radiology Tree app to read full this article<
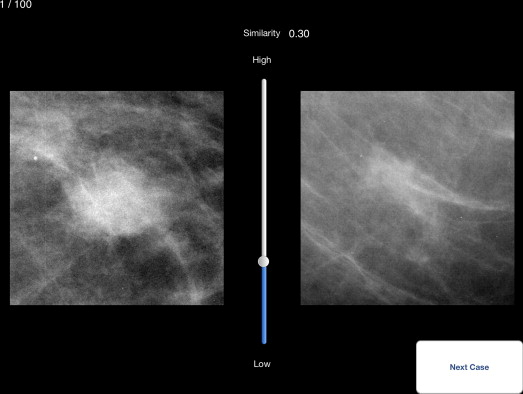
Get Radiology Tree app to read full this article<
Preference method
Get Radiology Tree app to read full this article<
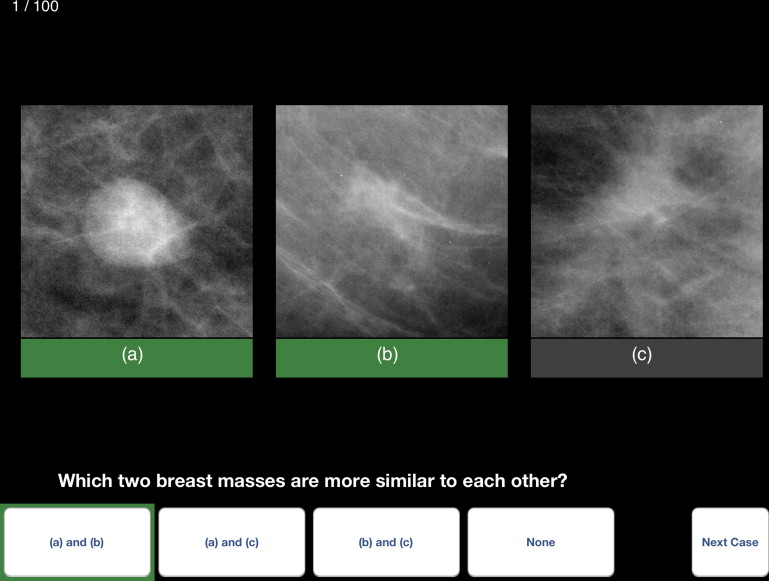
Get Radiology Tree app to read full this article<
Get Radiology Tree app to read full this article<
Hybrid method
Get Radiology Tree app to read full this article<
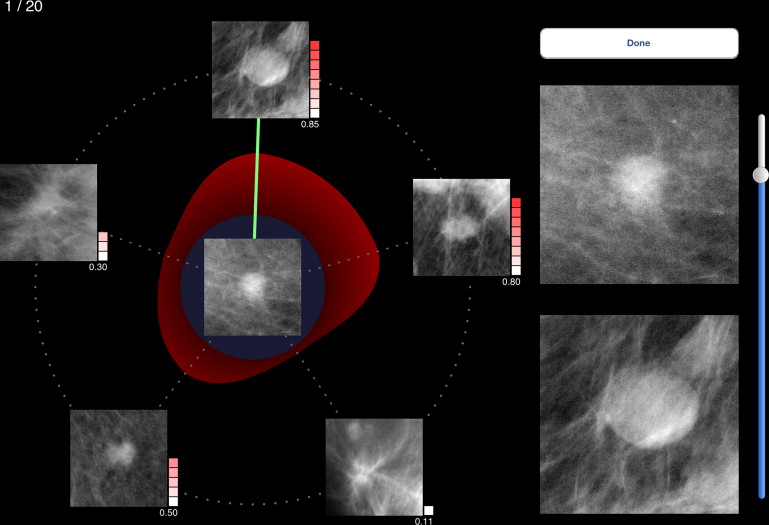
Get Radiology Tree app to read full this article<
Get Radiology Tree app to read full this article<
Get Radiology Tree app to read full this article<
Observer Study
Get Radiology Tree app to read full this article<
Get Radiology Tree app to read full this article<
Get Radiology Tree app to read full this article<
Get Radiology Tree app to read full this article<
User Modeling
Get Radiology Tree app to read full this article<
Get Radiology Tree app to read full this article<
Get Radiology Tree app to read full this article<
Performance Evaluation
Get Radiology Tree app to read full this article<
Get Radiology Tree app to read full this article<
Get Radiology Tree app to read full this article<
Get Radiology Tree app to read full this article<
Get Radiology Tree app to read full this article<
Get Radiology Tree app to read full this article<
Results
Get Radiology Tree app to read full this article<
Table 1
Time Requirements Per Data Collection Protocol
Data Collection Method Data Collection Time Expert 1 Expert 2 Resident 1 Resident 2 Resident 3 Resident 4 Rating Total (min) 13.3 ± 0.7 12.9 ± 1.8 8.0 ± 0.4 7.4 ± 0.6 7.0 ± 0.4 7.9 ± 0.6 Per case (sec) 8.0 ± 4.1 7.8 ± 10.3 4.8 ± 2.4 4.4 ± 3.5 4.2 ± 2.2 4.8 ± 3.4 Preference Total (min) 15.4 ± 1.0 14.0 ± 1.1 15.4 ± 0.8 8.0 ± 0.4 11.1 ± 0.7 9.7 ± 0.5 Per case (sec) 9.2 ± 5.8 8.4 ± 7.1 9.2 ± 5.4 4.8 ± 2.4 6.7 ± 4.0 5.8 ± 3.3 Hybrid Total (min) ∗ 13.3 ± 1.5 8.3 ± 0.5 9.4 ± 0.5 13.6 ± 1.2 16.8 ± 1.0 Per case (sec) 41.2 ± 11.4 40.0 ± 22.3 24.9 ± 7.2 28.2 ± 7.2 40.7 ± 16.4 50.4 ± 12.8
Get Radiology Tree app to read full this article<
Get Radiology Tree app to read full this article<
Get Radiology Tree app to read full this article<
Get Radiology Tree app to read full this article<
Get Radiology Tree app to read full this article<
Table 2
Classification Accuracy of Individualized User Models Predicting Observers’ Preference Opinions from Data Collected with the Three Methods Respectively
Observer Rating Method Preference Method Hybrid Method Expert 1 42.5 ± 1.8% (random forest) 32 ± 4.6% (bagging) 54 ± 3.4% (random forest) Expert 2 45.1 ± 1.8% (random forest) 47 ± 5.0% (SVM) 58 ± 3.5% (bagging) Resident 1 44.7 ± 1.9% (bagging) 41 ± 4.7% (Adaboost) 55 ± 3.6% (SVM) Resident 2 43.7 ± 1.9% (random forest) 41 ± 4.9% (random forest) 56 ± 3.8% (random forest) Resident 3 52.2 ± 1.9% (random forest) 40 ± 4.2% (PART) 54 ± 3.3% (random forest) Resident 4 43.7 ± 1.9% (rotation forest) 44 ± 5.2% (Bayesian net) 56 ± 3.4% (bagging)
Accuracy percentage is reported for the best performing classifiers (listed in parentheses). SMV, Support Vector Machine.
Get Radiology Tree app to read full this article<
Get Radiology Tree app to read full this article<
Get Radiology Tree app to read full this article<
Table 3
Classification Accuracy of Individualized User Models Derived with the Same Amount of Data for all Three Data Collection Methods
Observer Rating Method Preference Method Hybrid Method Expert 1 34.6 ± 4.7% 32 ± 4.6% 45.8 ± 5.0% Expert 2 34.8 ± 4.8% 47 ± 5.0% 48.7 ± 4.9% Resident 1 36.0 ± 4.8% 41 ± 4.7% 46.4 ± 4.9% Resident 2 36.3 ± 4.7% 41 ± 4.9% 53.5 ± 4.9% Resident 3 38.0 ± 4.8% 40 ± 4.2% 48.0 ± 5.0% Resident 4 35.2 ± 4.7% 44 ± 5.2% 52.7 ± 4.9%
Accuracy percentage is reported for the best performing classifiers.
Get Radiology Tree app to read full this article<
Discussion
Get Radiology Tree app to read full this article<
Get Radiology Tree app to read full this article<
Get Radiology Tree app to read full this article<
Get Radiology Tree app to read full this article<
Get Radiology Tree app to read full this article<
Get Radiology Tree app to read full this article<
Acknowledgment
Get Radiology Tree app to read full this article<
References
1. Tourassi G.D.: Current status of computerized decision support systems in mammography.Silverman B.G.Jain A.Ichalkaranje A. et. al.Intelligent paradigms for healthcare enterprises (studies in fuzziness and soft computing).2005.Springer-VerlagBerlin, Germany:pp. 173-208.
2. Tourassi G.D.: Computer-assisted radiology. In: Wiley encyclopedia of biomedical engineering.2006.Wiley & SonsHoboken, NJ
3. Müller H., Michoux N., Bandon D., et. al.: A review of content-based image retrieval systems in medical applications-clinical benefits and future directions. Int J Med Inform 2004; 73: pp. 1-23.
4. Müller H., Rosset A., Garcia A., et. al.: Informatics in radiology (INFORAD): benefits of content-based visual data access in radiology. Radiographics 2005; 25: pp. 849-858.
5. Rocchio J.: Relevance feedback in information retrieval.Salton G.The smart retrieval system: experiments in automatic document processing.1971.Prentice-HallEnglewood Cliffs, NJ:pp. 313-323.
6. Salton G., Buckley C.: Improving retrieval performance by relevance feedback. J Am Soc Inform Sci 1990; 41: pp. 288-297.
7. Wu K., Yap K.H.: Content-based image retrieval using fuzzy perceptual feedback. Multimed Tools Appl 2007; 32: pp. 235-251.
8. Tourassi G.D., Floyd C.E.: Computer-assisted diagnosis of mammographic masses using an information-theoretic image retrieval scheme with BIRADS-based relevance feedback. SPIE Medical Imaging 2004; 5370: pp. 810-816.
9. de Azevedo-Marques P.M., Rosa N.A., Traina A.J.M., et. al.: Reducing the semantic gap in content-based image retrieval in mammography with relevance feedback and inclusion of expert knowledge. Int J Comput Assist Radiol Surg 2008; 3: pp. 123-130.
10. Oh J.H., Yang Y., El Naqa I.: Adaptive learning for relevance feedback: application to digital mammography. Med Phys 2010; 37: pp. 4432-4444.
11. Cho H.C., Hadjiiski L., Sahiner B., et. al.: Interactive content-based image retrieval (CBIR) computer-aided diagnosis (CADx) system for ultrasound breast masses using relevance feedback. SPIE Med Imaging 2012; 8315: pp. 831509-1-831509-7.
12. Sanchez D., Chamorro-Martinez J., Vila M.A.: Modeling subjectivity in visual perception of orientation for image retrieval. Inform Process Manag 2003; 39: pp. 251-266.
13. Zhang R., Zhang Z.: Addressing CBIR efficiency, effectiveness, and retrieval subjectivity simultaneously.Proceedings of the 5th ACM SIGMM International Workshop on Multimedia Information Retrieval.2003.ACM PressNew York City, New York:pp. 71-78.
14. Wu K., Yap K.A.: Perceptual subjectivity notion in interactive content-based image retrieval systems.Tan Y.P.Yap K.H.Wang L.Intelligent multimedia processing with soft computing.2005.SpringerBerlin/Heidelberg, Germany:pp. 55-73.
15. Mazurowski M.A., Harrawood B.P., Zurada J.M., et. al.: Toward perceptually driven image retrieval in mammography: a pilot observer study to assess visual similarity of masses. SPIE Med Imaging 2008; 6917: pp. 69170I.
16. Sahiner B., Hadjiiski L.M., Chan H.P., et. al.: Inter- and intra-observer variability in radiologists’ assessment of mass similarity on mammograms. SPIE Med Imaging 2009; 7263: pp. 726315.
17. Muramatsu C., Li Q., Schmidt R., et. al.: Experimental determination of subjective similarity for pairs of clustered microcalcifications on mammograms: observer study results. Med Phys 2006; 33: pp. 3460-3468.
18. Hadjiiski L., Cho H.C., Chan H.P., et. al.: Inter-and intra-observer variability of radiologists evaluating CBIR systems.Maidment A.D.A.Bakic P.R.Gavenonis S.Breast imaging.2012.SpringerBerlin/Heidelberg, Germany:pp. 482-489.
19. Muramatsu C., Li Q., Schmidt R., et. al.: Investigation of psychophysical measure for evaluation of similar images for mammographic masses: preliminary results. Med Phys 2005; 32: pp. 2295-2304.
20. Muramatsu C., Li Q., Schmidt R., et. al.: Determination of similarity measures for pairs of mass lesions on mammograms by use of BI-RADS lesion descriptors and image features. Acad Radiol 2009; 16: pp. 443-449.
21. Muramatsu C., Nishimura K., Endo T., et. al.: Representation of lesion similarity by use of multidimensional scaling for breast masses on mammograms. J Digit Imaging 2013; pp. 1-8.
22. Cho H.C., Hadjiiski L., Sahiner B., et. al.: Similarity evaluation in a content-based image retrieval (CBIR) CADx system for characterization of breast masses on ultrasound images. Med Phys 2011; 38: pp. 1820-1831.
23. Stevens S.S.: On the theory of scales of measurement. Science 1946; 103: pp. 677-680.
24. Chan J.C.: Response-order effects in Likert-type scales. Educ Psychol Meas 1991; 51: pp. 531-540.
25. Miller M.D., Linn R.L., Gronlund N.E.: Measurement and assessment in teaching.2009.Merrill/PearsonUpper Saddle River, NJ
26. Viswanathan M.: Measurement of individual differences in preference for numerical information. J Appl Psychol 1993; 78: pp. 741-752.
27. Nishikawa R.M., Yang Y., Huo D., et. al.: Observers’ ability to judge the similarity of clustered calcifications on mammograms. SPIE Med Imaging 2004; 5372: pp. 192-198.
28. Tognetti S, Garbarino M, Bonarini A, et al. Modeling enjoyment preference from physiological responses in a car racing game. IEEE Conference on Computational Intelligence and Games 2010; 321–328.
29. Yannakakis G.N., Hallam J., Lund H.H.: Entertainment capture through heart rate activity in physical interactive playgrounds. User Model User-Adap. Special Issue: Affective Modeling and Adaptation 2008; 18: pp. 207-243.
30. Yannakakis G.N.: Preference learning for affective modeling. Proceedings of the Int Conf on Affective Computing and Intelligent Interaction 2009; pp. 126-131.
31. Xu S., Hudson K., Bradley Y., et. al.: Predictive modeling of human perception subjectivity: feasibility study of mammographic lesion similarity. SPIE 2012; 8318: 83180M-83180M-9
32. Kumazawa S., Muramatsu C., Li Q., et. al.: An investigation of radiologists’ perception of lesion similarity: observations with paired breast masses on mammograms and paired lung nodules on CT images. Acad Radiol 2008; 15: pp. 887-894.
33. Muramatsu C., Li Q., Schmidt R.A., et. al.: Determination of subjective similarity for pairs of masses and pairs of clustered micro-calcifications on mammograms: comparison of similarity ranking scores and absolute similarity ratings. Med Phys 2007; 34: pp. 2890-2895.
34. Heath M., Bowyer K., Kopans D., et. al.: Current status of the Digital Database for Screening Mammography.Digital mammography.1998.Kluwer Academic Publishers Available at: http://marathon.csee.usf.edu/Mammography/Database.html5
35. Stone D., Jarrett C., Woodroffe M., et. al.: User interface design and evaluation.2005.Morgan KaufmannLondon, UK
36. Gonzalez R.C., Woods R.E., Eddins S.L.: Digital image processing using MATLAB.2004.Prentice HallUpper Saddle River, NJ
37. Haralick R.M., Shanmugam K., Dinstein I.: Textural features for image classification. IEEE T Syst Man Cyb 1973; Smc-3: pp. 610-621.
38. Haralick R.M., Shapiro L.G.: Computer and robot vision.1991.Addison-WesleyBoston, MA
39. Hall M., Frank E., Holmes G., et. al.: The WEKA data mining software: an update. ACM SIGKDD Explorations Newsletter 2009; 11: pp. 10-18.
40. Bouckaert RR, Frank E, Hal M, et al. WEKA manual for version 3-7-8, 2013. Available at: http://www.cs.waikato.ac.nz/ml/weka/documentation.html . Accessed July 21, 2013.
41. Long L.R., Antani S., Deserno T.M., et. al.: Content-based image retrieval in medicine: retrospective assessment, state of the art, and future directions. Int J Healthc Inf Syst Inform 2009; 4: pp. 1-16.
42. Azevedo-Marques P.M.D., Rangayyan R.M.: Content-based retrieval of medical images: landmarking, indexing, and relevance feedback. Synth Lect Biomed Eng 2013; 8: pp. 1-143.