
Rationale and Objectives
This study aims to compare the speed and accuracy of three different software packages in segmenting the liver and the spleen.
Materials and Methods
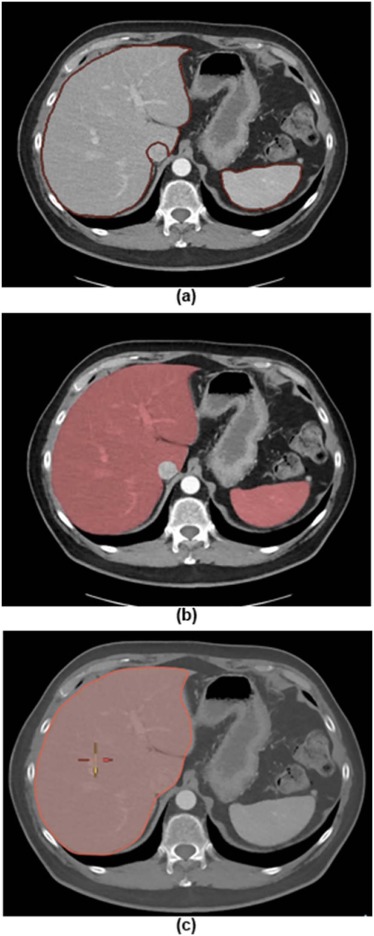
The three software packages are Advantage Workstation Solutions (AWS), Claron Technology (Claron) Liver Segmentor, and Vitrea Core Fx (Vitrea). The dataset consisted of abdominal computed tomography scans of 30 patients obtained from the portal venous phase. All but two of the patients had a cancer diagnosis. The livers of 14 patients and the spleens of 24 patients were reported as normal; the remaining livers and spleens contained one or more abnormalities. The initial segmentation times and volumes were recorded in Claron and Vitrea as these created automatic segmentations. The total segmentation times and volumes following corrections were recorded. The livers and spleens were segmented separately by two radiologists who used all three packages. Accuracy was assessed by comparing volumes measured using fully manual segmentation on the AWS.
Results
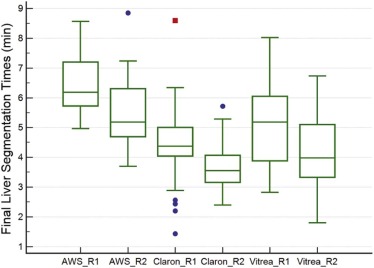
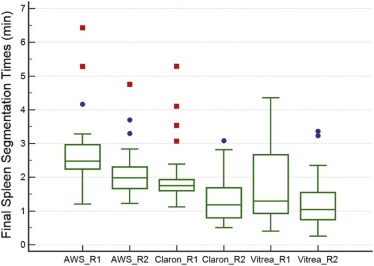
Claron could not segment the spleen in four subjects for the first reader and in two subjects for the second reader. The final mean segmentation times for the liver for both readers were 6.5 and 5.5 minutes for AWS, 4.4 and 3.6 minutes for Claron, and 5.1 and 4.2 minutes for Vitrea. The final mean segmentation times for the spleen were 2.7 and 2.1 minutes for AWS, 2.1 and 1.4 minutes for Claron, and 1.8 and 1.2 minutes for Vitrea. No statistically significant difference was found between the organ volumes measured by the two readers when using Vitrea. The mean differences between the initial and final segmentation volumes ranged from −1.2% to 0.4% for the liver and from −4.0% to 9.8% for the spleen. The mean differences between the automated liver segmentation volumes and the AWS volumes were 2.5%–2.9% for Claron and 4.9%–6.6% for Vitrea. The mean differences between the automated splenic segmentation volumes and the AWS volumes were 5.0%–6.2% for Claron and 10.6%–12.0% for Vitrea.
Conclusions
Both automated packages (Claron and Vitrea) measured liver and spleen volumes that were accurate and quick before manual correction. Volumes for the liver were more accurate than those for the spleen, perhaps due to the much smaller splenic volumes compared to those of the liver. For both liver and spleen, manual corrections were time consuming and for most subjects did not significantly change the volume measurement.
Introduction
A quick and accurate assessment of liver and spleen volumes is important in various clinical and research settings. Volume measurements may be required in evaluating suspected or known organomegaly, following disease progression, and assessment before organ transplantation or resection. Response to different therapies may also be assessed, such as an increase in splenic volume post chemotherapy .
The liver and the spleen have complex and highly variable shapes in most patients. For example, in a particular patient, there are complex invaginations of the liver contour in the region of the porta hepatis, and frequently considerable variation in shape from the top to the bottom of both the liver and the spleen. There is also considerable variability in liver and spleen shapes from one patient to another. These complexities and variabilities make manual segmentation time consuming and automated segmentation more difficult. However, the state-of-the-art in automated liver and spleen segmentation has improved substantially over the past decade. For example, a recent study has shown non-inferiority of an automated liver segmentation compared to manual segmentation with improved reproducibility .
Get Radiology Tree app to read full this article<
Get Radiology Tree app to read full this article<
Get Radiology Tree app to read full this article<
Materials and Methods
Get Radiology Tree app to read full this article<
Case Selection
Get Radiology Tree app to read full this article<
Get Radiology Tree app to read full this article<
Get Radiology Tree app to read full this article<
Get Radiology Tree app to read full this article<
Image Acquisition
Get Radiology Tree app to read full this article<
Software Packages
Get Radiology Tree app to read full this article<
Get Radiology Tree app to read full this article<
Get Radiology Tree app to read full this article<
Get Radiology Tree app to read full this article<
Get Radiology Tree app to read full this article<
Get Radiology Tree app to read full this article<
Get Radiology Tree app to read full this article<
Get Radiology Tree app to read full this article<
Data Collection
Get Radiology Tree app to read full this article<
Statistical Analysis
Get Radiology Tree app to read full this article<
Results
Incorrect Segmentations
Get Radiology Tree app to read full this article<
Comparison of Mean Organ Volumes by Software Package
Get Radiology Tree app to read full this article<
Table 1
Mean Organ Volumes by Software Package
Software AWS Claron Vitrea Reader 1 Reader 2 Reader 1 Reader 2 Reader 1 Reader 2 Liver No. of successful segmentations 30/30 30/30 30/30 30/30 30/30 30/30 Initial volume(mL) N/A N/A 1551.2 ± 327.1 1545.1 ± 334.9 1512.5 ± 359.2 1492.4 ± 294.4 Final volume(mL) 1595.4 ± 330.5 1580.4 ± 327.2 1551.7 ± 313.9 1532.5 ± 321.8 1493.9 ± 351.7 1499.4 ± 299.1 Percentage difference between initial and final volume N/A N/A −0.1 ± 7.0 −0.9 ± 6.4 −1.2 ± 3.3 0.4 ± 1.9 Percentage difference between initial volume and AWS N/A N/A 2.3 ± 9.0 1.8 ± 9.6 5.5 ± 5.7 5.2 ± 4.8 Percentage difference between final volume and AWS N/A N/A 2.5 ± 4.1 2.9 ± 4.7 6.6 ± 5.0 4.9 ± 3.9 Bland-Altman mean and 95% limit of agreement of final volume compared to AWS(mL) N/A N/A 43.7(−94.9,182.2) 47.9(−106,201.8) 101.5(−77.5,280.5) 81.0(−33.8,195.7) Bland-Altman mean percent difference and 95% limit of agreement of final volume between the two readers 0.9(−4.0,5.9) 1.4(−2.8,5.5) −1.0(−10.8,8.8) Spleen No. of successful segmentations 30/30 30/30 23/30 initially,26/30 following adjustment 22/30 initially,28/30 following adjustment 30/30 30/30 Initial volume(mL) N/A N/A 243.2 ± 155.4 218.4 ± 165.3 239.4 ± 209.0 220.4 ± 151.4 Final volume(mL) 253.0 ± 183.4 253.6 ± 180.3 243.2 ± 181.2 248.0 ± 179.6 233.6 ± 206.9 224.2 ± 165.7 Percentage difference between initial and final volume N/A N/A −4.0 ± 13.7 9.8 ± 32.6 −2.8 ± 9.5 0.4 ± 6.1 Percentage difference between initial volume and AWS 2.4 ± 15.1 14.2 ± 31.6 8.0 ± 12.0 12.3 ± 7.5 Percentage difference between final volume and AWS 6.2 ± 8.1 5.0 ± 7.0 10.6 ± 6.6 12.0 ± 4.4 Bland-Altman mean and 95% limit of agreement of final volume compared to AWS 15.9(−19.8,51.5) 12.7(−15.7,41.1) 19.3(−43,81.7) 29.3(−5.7,64.4) Bland-Altman mean percent difference and 95% limit of agreement of final volume between the two readers −0.4(−5.3,4.6) −1.7(−11.7,8.4) 1.0(−9.5,11.5)
AWS,Advantage Workstation Solutions; N/A,not applicable.
Initial volumes are the organ volumes after the fully automated segmentation. Final volumes are the organ volumes after the semiautomated or manual correction. Volumes shown are in milliliter (mean ± standard deviation).
Get Radiology Tree app to read full this article<
Get Radiology Tree app to read full this article<
Get Radiology Tree app to read full this article<
Get Radiology Tree app to read full this article<
Comparison of Segmentation Times by Software Package
Get Radiology Tree app to read full this article<
Table 2
Mean Initial and Final Organ Segmentation Times by Software Package
Software AWS Claron Vitrea Reader 1 Reader 2 Reader 1 Reader 2 Reader 1 Reader 2 Liver Initial segmentation time (min) N/A N/A 1.8 ± 0.1 1.8 ± 0.1 0.5 ± 0.1 0.5 ± 0.1 Segmentation correction time(min) 6.5 ± 1.0 5.5 ± 1.2 2.8 ± 1.1 1.9 ± 0.7 4.6 ± 1.4 3.7 ± 1.1 Total segmentation time (min) 6.5 ± 1.0 5.5 ± 1.2 4.4 ± 1.4 3.6 ± 0.7 5.1 ± 1.4 4.2 ± 1.1 Initial segmentation time as a percentage of AWS segmentation time N/A N/A 28.3 ± 4.9 33.8 ± 7.4 7.2 ± 2.1 8.6 ± 2.7 Total segmentation time as a percentage of AWS segmentation time N/A N/A 68.2 ± 18.9 69.0 ± 20.0 80.4 ± 26.9 77.7 ± 20.1 Bland-Altman mean and 95% limit of agreement of total segmentation time compared to AWS N/A N/A 2.1(−0.4,4.5) 1.9(−1.0,4.7) 1.4(−2.2,5.0) 1.3(−1.2,3.8) Spleen Initial segmentation time (min) N/A N/A 0.5 ± 0.1 0.6 ± 0.1 0.5 ± 0.2 0.5 ± 0.2 Segmentation correction time(min) 2.7 ± 1.0 2.1 ± 0.8 1.5 ± 0.9 0.8 ± 0.7 1.3 ± 1.0 0.7 ± 0.7 Total segmentation time (min) 2.7 ± 1.0 2.1 ± 0.8 2.1 ± 0.9 1.4 ± 0.7 1.8 ± 1.1 1.2 ± 0.8 Initial segmentation time as a percentage of AWS segmentation time N/A N/A 20.8 ± 6.0 30.3 ± 11.1 18.5 ± 7.1 23.8 ± 8.6 Total segmentation time as a percentage of AWS segmentation time N/A N/A 77.3 ± 26.2 69.3 ± 39.8 70.6 ± 44.8 62.3 ± 40.4 Bland-Altman mean and 95% limit of agreement of total segmentation time compared to AWS (min) N/A N/A 0.7(−0.7,2.1) 0.8,(−1.3,2.9) 0.9(−1.7,3.6) 0.9(−1.1,2.9)
AWS, Advantage Workstation Solutions; N/A, not applicable.
Initial times are the times for the fully automated segmentation. Final times are the times for the semiautomated or manual correction. Values are mean ± standard deviation.
Get Radiology Tree app to read full this article<
Get Radiology Tree app to read full this article<
Get Radiology Tree app to read full this article<
Get Radiology Tree app to read full this article<
Get Radiology Tree app to read full this article<
Get Radiology Tree app to read full this article<
Comparison of Segmentation Times and Organ Volumes Between Readers
Get Radiology Tree app to read full this article<
Get Radiology Tree app to read full this article<
Correlation of Organ Volume with Segmentation Time
Get Radiology Tree app to read full this article<
Bland-Altman Plots
Get Radiology Tree app to read full this article<
Get Radiology Tree app to read full this article<
Table 3
Main Advantages and Disadvantages of Each Software Package
Main Advantages Main Disadvantages Advantage Workstation Solutions
Claron
Vitrea
Get Radiology Tree app to read full this article<
Discussion
Get Radiology Tree app to read full this article<
Get Radiology Tree app to read full this article<
Get Radiology Tree app to read full this article<
Get Radiology Tree app to read full this article<
Get Radiology Tree app to read full this article<
Get Radiology Tree app to read full this article<
Get Radiology Tree app to read full this article<
Get Radiology Tree app to read full this article<
Get Radiology Tree app to read full this article<
Get Radiology Tree app to read full this article<
Get Radiology Tree app to read full this article<
Get Radiology Tree app to read full this article<
Get Radiology Tree app to read full this article<
Acknowledgments
Get Radiology Tree app to read full this article<
Get Radiology Tree app to read full this article<
Get Radiology Tree app to read full this article<
Get Radiology Tree app to read full this article<
Get Radiology Tree app to read full this article<
References
1. Joiner B.J., Simpson A.L., Leal J.N., et. al.: Assessing splenic enlargement on CT by unidimensional measurement changes in patients with colorectal liver metastases. Abdom Imaging 2015; 40: pp. 2338-2344.
2. Fananapazir G., Bashir M.R., Marin D., et. al.: Computer-aided liver volumetry: performance of a fully-automated, prototype post-processing solution for whole-organ and lobar segmentation based on MDCT imaging. Abdom Imaging 2015; 40: pp. 1203-1212.
3. Linguraru M.G., Sandberg J.K., Jones E.C., et. al.: Assessing splenomegaly: automated volumetric analysis of the spleen. Acad Radiol 2013; 20: pp. 675-684.
4. Linguraru M.G., Sandberg J.K., Jones E.C., et. al.: Assessing hepatomegaly: automated volumetric analysis of the liver. Acad Radiol 2012; 19: pp. 588-598.
5. Suzuki K., Epstein M.L., Kohlbrenner R., et. al.: Quantitative radiology: automated CT liver volumetry compared with interactive volumetry and manual volumetry. AJR Am J Roentgenol 2011; 197: pp. W706-W712.
6. Suzuki K., Kohlbrenner R., Epstein M.L., et. al.: Computer-aided measurement of liver volumes in CT by means of geodesic active contour segmentation coupled with level-set algorithms. Med Phys 2010; 37: pp. 2159-2166.
7. Wei L., Zhi Z.J., Lü Y., et. al.: Application of computer-assisted three-dimensional quantitative assessment and a surgical planning tool for living donor liver transplantation. Chin Med J 2013; 126: pp. 1288-1291.
8. Heimann T., van Ginneken B., Styner M.A., et. al.: Comparison and evaluation of methods for liver segmentation from CT datasets. IEEE Trans Med Imaging 2009; 28: pp. 1251-1265.
9. Luciani A., Rusko L., Baranes L., et. al.: Automated liver volumetry in orthotopic liver transplantation using multiphase acquisitions on MDCT. AJR Am J Roentgenol 2012; 198: pp. W568-W574.
10. Gotra A., Chartrand G., Massicotte-Tisluck K., et. al.: Validation of a semiautomated liver segmentation method using CT for accurate volumetry. Acad Radiol 2015; 22: pp. 1088-1098.
11. Perandini S., Faccioli N., Inama M., et. al.: Freehand liver volumetry by using an electromagnetic pen tablet: accuracy, precision, and rapidity. J Digit Imaging 2011; 24: pp. 360-365.
12. Hori M., Suzuki K., Epstein M.L., et. al.: Computed tomography liver volumetry using 3-dimensional image data in living donor liver transplantation: effects of the slice thickness on the volume calculation. Liver Transpl 2011; 17: pp. 1427-1436.
13. Hammon M., Dankerl P., Kramer M., et. al.: Automated detection and volumetric segmentation of the spleen in CT scans. Rofo 2012; 184: pp. 734-739.