
Rationale and Objectives
Our objective is to determine whether expected utility (EU) and the area under the receiver operator characteristic (AUC) are consistent with one another as endpoints of observer performance studies in mammography. These two measures characterize receiver operator characteristic performance somewhat differently. We compare these two study endpoints at the level of individual reader effects, statistical inference, and components of variance across readers and cases.
Materials and Methods
We reanalyze three previously published laboratory observer performance studies that investigate various x-ray breast imaging modalities using EU and AUC. The EU measure is based on recent estimates of relative utility for screening mammography.
Results
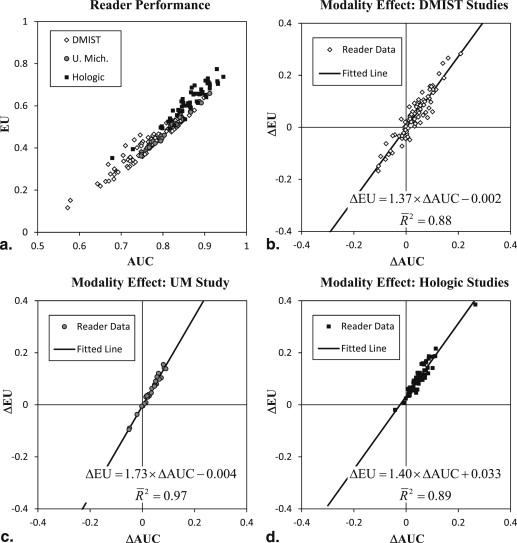
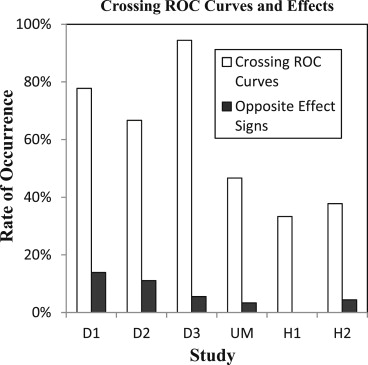
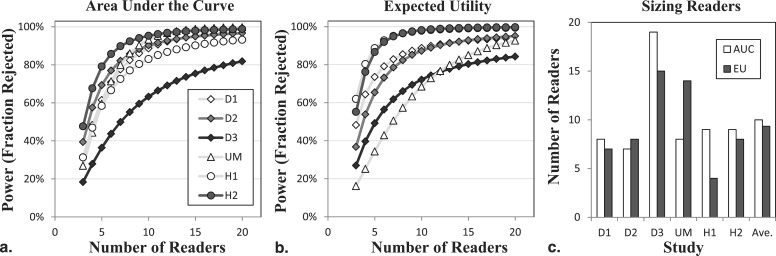
The AUC and EU measures are correlated across readers for individual modalities ( r = 0.93) and differences in modalities ( r = 0.94 to 0.98). Statistical inference for modality effects based on multi-reader multi-case analysis is very similar, with significant results ( P < .05) in exactly the same conditions. Power analyses show mixed results across studies, with a small increase in power on average for EU that corresponds to approximately a 7% reduction in the number of readers. Despite a large number of crossing receiver operator characteristic curves (59% of readers), modality effects only rarely have opposite signs for EU and AUC (6%).
Conclusions
We do not find any evidence of systematic differences between EU and AUC in screening mammography observer studies. Thus, when utility approaches are viable (i.e., an appropriate value of relative utility exists), practical effects such as statistical efficiency may be used to choose study endpoints.
Laboratory observer performance studies using receiver operating characteristic (ROC) methodology have become a mainstay for demonstrating improvements in technology or methodology for radiological imaging . These studies are now found widely in the radiological literature and are often used as evidence in submissions to regulatory agencies such as the US Food and Drug Administration . Most commonly, ROC studies use a rating of suspicion (e.g., probability of malignancy) to determine the tradeoff between sensitivity and false-positive fraction in a diagnostic task. To generalize results to the population of patients and readers, a substantial effort is required to collect a sample of relevant cases and to evaluate a sample of readers from which inferences regarding the imaging modality are obtained .
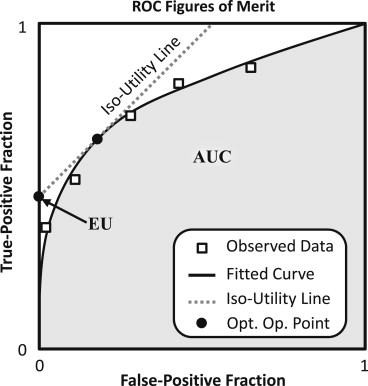
These inferences are based on an index, or figure of merit, extracted from the ROC curve. The figure of merit summarizes a ROC curve with a single number representing overall performance that can be compared across readers, cases, and modalities. The predominant figure of merit for ROC studies of observer performance has been the area under the ROC curve (AUC), which is the diagnostic sensitivity averaged over all possible false-positive fractions . The AUC is independent of disease prevalence and can also be interpreted as a measure of class separability because it represents the probability that a case from the abnormal population will considered more suspicious than a case from the normal population.
Get Radiology Tree app to read full this article<
Get Radiology Tree app to read full this article<
Get Radiology Tree app to read full this article<
Materials and methods
Figures of Merit for Observer Performance in ROC Studies
Get Radiology Tree app to read full this article<
Get Radiology Tree app to read full this article<
Get Radiology Tree app to read full this article<
Get Radiology Tree app to read full this article<
EU=Max(TPF,FPF)∈R(TPF−βFPF). EU
=
Max
(
TPF,
FPF
)
∈
R
(
TPF
−
β
FPF
)
.
Get Radiology Tree app to read full this article<
Get Radiology Tree app to read full this article<
Get Radiology Tree app to read full this article<
Reader Data
Get Radiology Tree app to read full this article<
Table 1
Reader Studies
Data Study Identification M1 M2 M3 Readers Cases (P, N) DMIST D1 SFM: GE Soft-copy DM: GE Hard-copy DM: GE 120 (48, 72) D2 SFM: Fuji Soft-copy DM: Fuji Hard-copy DM: Fuji 12 98 (27, 71) D3 SFM: Fisher Soft-copy DM: Fisher Hard-copy DM: Fisher 6 115 (42, 73) University of Michigan UM No CAD Pre-CAD With CAD 10 253 (138, 115) Hologic H1 DM alone DM with 2-view DBT None 12 312 (48, 264) H2 DM alone DM with 1-view DBT DM with 2-view DBT 15 310 (51, 259)
CAD, computer-aided diagnosis; DBT, digital breast tomosynthesis; DM, digital mammography; M1, modality 1; M2, modality 2; M3, modality 3; N, negative; P, positive; SFM, screen-film mammography.
Get Radiology Tree app to read full this article<
DMIST reader studies
Get Radiology Tree app to read full this article<
Get Radiology Tree app to read full this article<
University of Michigan CAD study
Get Radiology Tree app to read full this article<
Get Radiology Tree app to read full this article<
Hologic tomosynthesis studies
Get Radiology Tree app to read full this article<
Get Radiology Tree app to read full this article<
Get Radiology Tree app to read full this article<
ROC Analysis and Inference
Get Radiology Tree app to read full this article<
Get Radiology Tree app to read full this article<
Modality Effects and Crossing ROC Curves
Get Radiology Tree app to read full this article<
Get Radiology Tree app to read full this article<
Results
Get Radiology Tree app to read full this article<
Table 2
DBM Inference
Study Identification FOM M1-Ave. M2-Ave. M3-Ave.P : All_P_ : M1-M2P : M1-M3P : M2-M3 D1 AUC 0.82 0.78 0.79 .1476 .1109 .2241 .4914 EU 0.51 0.45 0.45 .2598 .2408 .2062 .8624 D2 AUC 0.78 0.74 0.76 .2573 .1262 .5739 .1862 EU 0.43 0.37 0.41 .2995 .1405 .5820 .2664 D3 AUC 0.75 0.72 0.69 .4132 .5615 .1448 .5046 EU 0.41 0.35 0.33 .4012 .4095 .1612 .7125 UM AUC 0.79 0.81 0.84 .0015 ∗ .1184 .0043 ∗ .0022 ∗ EU 0.44 0.48 0.52 .0056 ∗ .1672 .0105 ∗ .0094 ∗ H1 AUC 0.81 0.89 NA .0029 ∗ NA NA NA EU 0.51 0.68 NA <.0001 ∗ NA NA NA H2 AUC 0.83 0.86 0.89 <.0001 ∗ .0057 ∗ .0004 ∗ .0262 ∗ EU 0.54 0.60 0.67 <.0001 ∗ .0031 ∗ <.0001 ∗ .0043 ∗
AUC, area under the receiver operating characteristic curve; EU, expected utility; FOM, figure of merit; M1-Ave, modality 1 average; M2-Ave, modality 2 average; M3-Ave, modality 3 average; NA, not available.
For each study considered, the table gives the AUC or EU FOMs averaged across readers in each modality as well as the P values from tests for modality differences in the whole study (all) and each paired modality comparison (e.g., M1-M2).
Get Radiology Tree app to read full this article<
Get Radiology Tree app to read full this article<
Get Radiology Tree app to read full this article<
Get Radiology Tree app to read full this article<
Get Radiology Tree app to read full this article<
Table 3
DBM Components of Variance for AUC and EU
Study Endpoint R C TR TC RC TRC D1 AUC 0.0012 0.0954 0 0.0221 0.0370 0.3222 EU 0.0040 0.2521 0 0.0685 0.0762 0.3634 D2 AUC 0.0009 0.1470 0 0.0229 0.0351 0.2036 EU 0.0029 0.5120 0.0008 0.0465 0.0844 0.3371 D3 AUC 0.0016 0.0962 0 0.0364 0.0701 0.6160 EU 0.0071 0.2369 0.0012 0.0813 0.1108 0.5799 UM AUC 0.0010 0.0741 0 0.0036 0.0538 0.1836 EU 0.0032 0.2625 0 0.0159 0.1687 0.9523 H1 AUC 0 0.1841 0.0011 0.0591 0.0841 0.2770 EU 0.0012 0.6267 0.0015 0.1524 0.1940 0.4981 H2 AUC 0 0.1932 0 0.0251 0.1215 0.2157 EU 0.0010 0.6263 0 0.0843 0.2397 0.7469
AUC, area under the receiver operating characteristic curve; C, case variance; EU, expected utility; R, reader variance; RC, reader by case interaction; TC, treatment by case interaction; TR, treatment by read interaction; TRC, residual error.
Table entries of 0 occur when the variance component estimate is less than 0.0001.
Get Radiology Tree app to read full this article<
Get Radiology Tree app to read full this article<
Get Radiology Tree app to read full this article<
Get Radiology Tree app to read full this article<
Discussion
Get Radiology Tree app to read full this article<
Effect Sizes and Components of Variance
Get Radiology Tree app to read full this article<

Get Radiology Tree app to read full this article<
Get Radiology Tree app to read full this article<
Get Radiology Tree app to read full this article<
Power Calculation
Get Radiology Tree app to read full this article<
Get Radiology Tree app to read full this article<
Get Radiology Tree app to read full this article<
Crossing ROC Curves
Get Radiology Tree app to read full this article<
Get Radiology Tree app to read full this article<
Summary and conclusions
Get Radiology Tree app to read full this article<
Get Radiology Tree app to read full this article<
Get Radiology Tree app to read full this article<
Acknowledgments
Get Radiology Tree app to read full this article<
Appendix
Get Radiology Tree app to read full this article<
Get Radiology Tree app to read full this article<
Table A1
Additional Study Statistics
Study Endpoint SE-Mod. SE-Dif. CC D1 AUC 0.036 0.029 0.69 EU 0.058 0.041 0.75 D2 AUC 0.045 0.029 0.80 EU 0.080 0.041 0.87 D3 AUC 0.049 0.049 0.50 EU 0.072 0.059 0.66 UM AUC 0.022 0.013 0.83 EU 0.043 0.030 0.76 H1 AUC 0.031 0.027 0.63 EU 0.054 0.039 0.74 H2 AUC 0.028 0.016 0.84 EU 0.051 0.029 0.83
AUC, area under the receiver operating characteristic curve; CC, Pearson correlation coefficient between modalities; EU, expected utility; SE-Dif, standard error estimates for modality differences; SE-Mod, standard error estimates for performance in a given modality.
Get Radiology Tree app to read full this article<
References
1. Goodenough D.J., Rossmann K., Lusted L.B.: Radiographic applications of receiver operating characteristic (ROC) curves. Radiology 1974; 110: pp. 89-95.
2. Metz C.E.: ROC methodology in radiologic imaging. Invest Radiol 1986; 21: pp. 720-733.
3. Metz C.E.: ROC analysis in medical imaging: a tutorial review of the literature. Radiol Phys Technol 2008; 1: pp. 2-12.
4. Obuchowski N.A.: Receiver operating characteristic curves and their use in radiology. Radiology 2003; 229: pp. 3-8.
5. Shiraishi J., Pesce L.L., Metz C.E., et. al.: Experimental design and data analysis in receiver operating characteristic studies: lessons learned from reports in radiology from 1997 to 2006. Radiology 2009; 253: pp. 822-830.
6. Gallas B.D., Chan H.P., D’Orsi C.J., et. al.: Evaluating imaging and computer-aided detection and diagnosis devices at the FDA. Acad Radiol 2012; 19: pp. 463-477.
7. Beiden S.V., Wagner R.F., Campbell G., et. al.: Components-of-variance models for random-effects ROC analysis: the case of unequal variance structures across modalities. Acad Radiol 2001; 8: pp. 605-615.
8. Dorfman D.D., Berbaum K.S., Metz C.E.: Receiver operating characteristic rating analysis. Generalization to the population of readers and patients with the jackknife method. Invest Radiol 1992; 27: pp. 723-731.
9. Gallas B.D.: One-shot estimate of MRMC variance: AUC. Acad Radiol 2006; 13: pp. 353-362.
10. Hillis S.L., Berbaum K.S., Metz C.E.: Recent developments in the Dorfman-Berbaum-Metz procedure for multireader ROC study analysis. Acad Radiol 2008; 15: pp. 647-661.
11. Hanley J.A., McNeil B.J.: The meaning and use of the area under a receiver operating characteristic (ROC) curve. Radiology 1982; 143: pp. 29-36.
12. Metz C.E.: Basic principles of ROC analysis. Semin Nucl Med 1978; 8: pp. 283-298.
13. Hilden J.: The area under the ROC curve and its competitors. Med Decis Making 1991; 11: pp. 95-101.
14. Hilden J. Evaluation of diagnostic tests - the schism. Society for Medical Decision Making Newsletter. 2004; (4):5–6.
15. Jiang Y., Metz C.E., Nishikawa R.M.: A receiver operating characteristic partial area index for highly sensitive diagnostic tests. Radiology 1996; 201: pp. 745-750.
16. Obuchowski N.A., McClish D.K.: Sample size determination for diagnostic accuracy studies involving binormal ROC curve indices. Stat Med 1997; 16: pp. 1529-1542.
17. McClish D.K.: Analyzing a portion of the ROC curve. Med Decis Making 1989; 9: pp. 190-195.
18. Hand D.J.: Measuring classifier performance: a coherent alternative to the area under the ROC curve. Machine Learning 2009; 77: pp. 103-123.
19. Halpern E.J., Albert M., Krieger A.M., et. al.: Comparison of receiver operating characteristic curves on the basis of optimal operating points. Acad Radiol 1996; 3: pp. 245-253.
20. Sunshine J.: Contributed comment. Acad Radiol 1995; 2: S72–S74
21. Wagner R.F., Beam C.A., Beiden S.V.: Reader variability in mammography and its implications for expected utility over the population of readers and cases. Med Decis Making 2004; 24: pp. 561-572.
22. Swets J.A., Pickett R.M.: Evaluation of diagnostic systems: methods from signal detection theory.1982.Academic PressNew York
23. Abbey C.K., Eckstein M.P., Boone J.M.: An equivalent relative utility metric for evaluating screening mammography. Med Decis Making 2010; 30: pp. 113-122.
24. Lusted L.B.: Introduction to medical decision making.1968.ThomasSpringfield, IL
25. Pisano E.D., Gatsonis C., Hendrick E., et. al.: Diagnostic performance of digital versus film mammography for breast-cancer screening. N Engl J Med 2005; 353: pp. 1773-1783.
26. Barlow W.E., Chi C., Carney P.A., et. al.: Accuracy of screening mammography interpretation by characteristics of radiologists. J Natl Cancer Inst 2004; 96: pp. 1840-1850.
27. Abbey C.K., Samuelson F.W., Gallas B.D.: Statistical power considerations for a utility endpoint in observer performance studies. Acad Radiol 2013; 20: pp. 798-806.
28. Abbey C.K., Eckstein M.P., Boone J.M.: Estimating the relative utility of screening mammography. Med Decis Making 2013; 33: pp. 510-520.
29. Hendrick R.E., Cole E.B., Pisano E.D., et. al.: Accuracy of soft-copy digital mammography versus that of screen-film mammography according to digital manufacturer: ACRIN DMIST retrospective multireader study. Radiology 2008; 247: pp. 38-48.
30. Nishikawa R.M., Acharyya S., Gatsonis C., et. al.: Comparison of soft-copy and hard-copy reading for full-field digital mammography. Radiology 2009; 251: pp. 41-49.
31. Pisano E.D., Gatsonis C.A., Yaffe M.J., et. al.: American College of Radiology Imaging Network digital mammographic imaging screening trial: objectives and methodology. Radiology 2005; 236: pp. 404-412.
32. Hadjiiski L., Chan H.P., Sahiner B., et. al.: Improvement in radiologists’ characterization of malignant and benign breast masses on serial mammograms with computer-aided diagnosis: an ROC study. Radiology 2004; 233: pp. 255-265.
33. Rafferty E.A., Park J.M., Philpotts L.E., et. al.: Assessing radiologist performance using combined digital mammography and breast tomosynthesis compared with digital mammography alone: results of a multicenter, multireader trial. Radiology 2013; 266: pp. 104-113.
34. Abbey C.K., Samuelson F.W., Gallas B.D., et. al.: Statistical properties of a utility measure of observer performance compared to area under the ROC curve. Book Statistical properties of a utility measure of observer performance compared to area under the ROC curve.2013.International Society for Optics and PhotonicsBellingham, WA 86730D-D-9
35. Dorfman D.D., Berbaum K.S.: A contaminated binormal model for ROC data: Part III. Initial evaluation with detection ROC data. Acad Radiol 2000; 7: pp. 438-447.
36. Dorfman D.D., Berbaum K.S.: A contaminated binormal model for ROC data: Part II. A formal model. Acad Radiol 2000; 7: pp. 427-437.
37. Dorfman D.D., Berbaum K.S., Brandser E.A.: A contaminated binormal model for ROC data: Part I. Some interesting examples of binormal degeneracy. Acad Radiol 2000; 7: pp. 420-426.
38. Hillis S.L., Obuchowski N.A., Schartz K.M., et. al.: A comparison of the Dorfman-Berbaum-Metz and Obuchowski-Rockette methods for receiver operating characteristic (ROC) data. Stat Med 2005; 24: pp. 1579-1607.
39. Hillis S.L., Obuchowski N.A., Berbaum K.S.: Power estimation for multireader ROC methods an updated and unified approach. Acad Radiol 2011; 18: pp. 129-142.