
Rationale and Objectives
Breast 3.0 T magnetic resonance diffusion-weighted imaging (MR-DWI) of benign and malignant lesions were obtained to measure and calculate the signal-to-noise ratio (SNR), signal intensity ratio (SIR), and contrast-to-noise ratio (CNR) of lesions at different b-values. The variation patterns of SNR and SIR were analyzed with different b-values and the images of DWI were compared at four different b-values with higher image quality. The effect of SIR on the differential diagnostic efficiency of benign and malignant lesions was compared using receiver operating characteristic curves to provide a reference for selecting the optimal b-value.
Materials and Methods
A total of 96 qualified patients with 112 lesions and 14 patients with their contralateral 14 normal breasts were included in this study. The single-shot echo planar imaging sequence was used to perform the DWI and a total of 13 b-values were used: 0, 50, 100, 200, 400, 600, 800, 1000, 1200, 1500, 1800, 2000, and 2500 s/mm 2 . On DWI, the suitable regions of interest were selected. The SNRs of normal breasts (SNR normal ), SNR lesions , SIR, and CNR of benign and malignant lesions were measured on DWI with different b-values and calculated. The variation patterns of SNR, SIR, and CNR values on DWI for normal breasts, benign lesions, and malignant lesions with different b-values were analyzed by using Pearson correlation analysis. The SNR and SIR of benign and malignant lesions with the same b-values were compared using t-tests. The diagnostic efficiencies of SIR with different b-values for benign and malignant lesions were evaluated using receiver operating characteristic curves.
Results
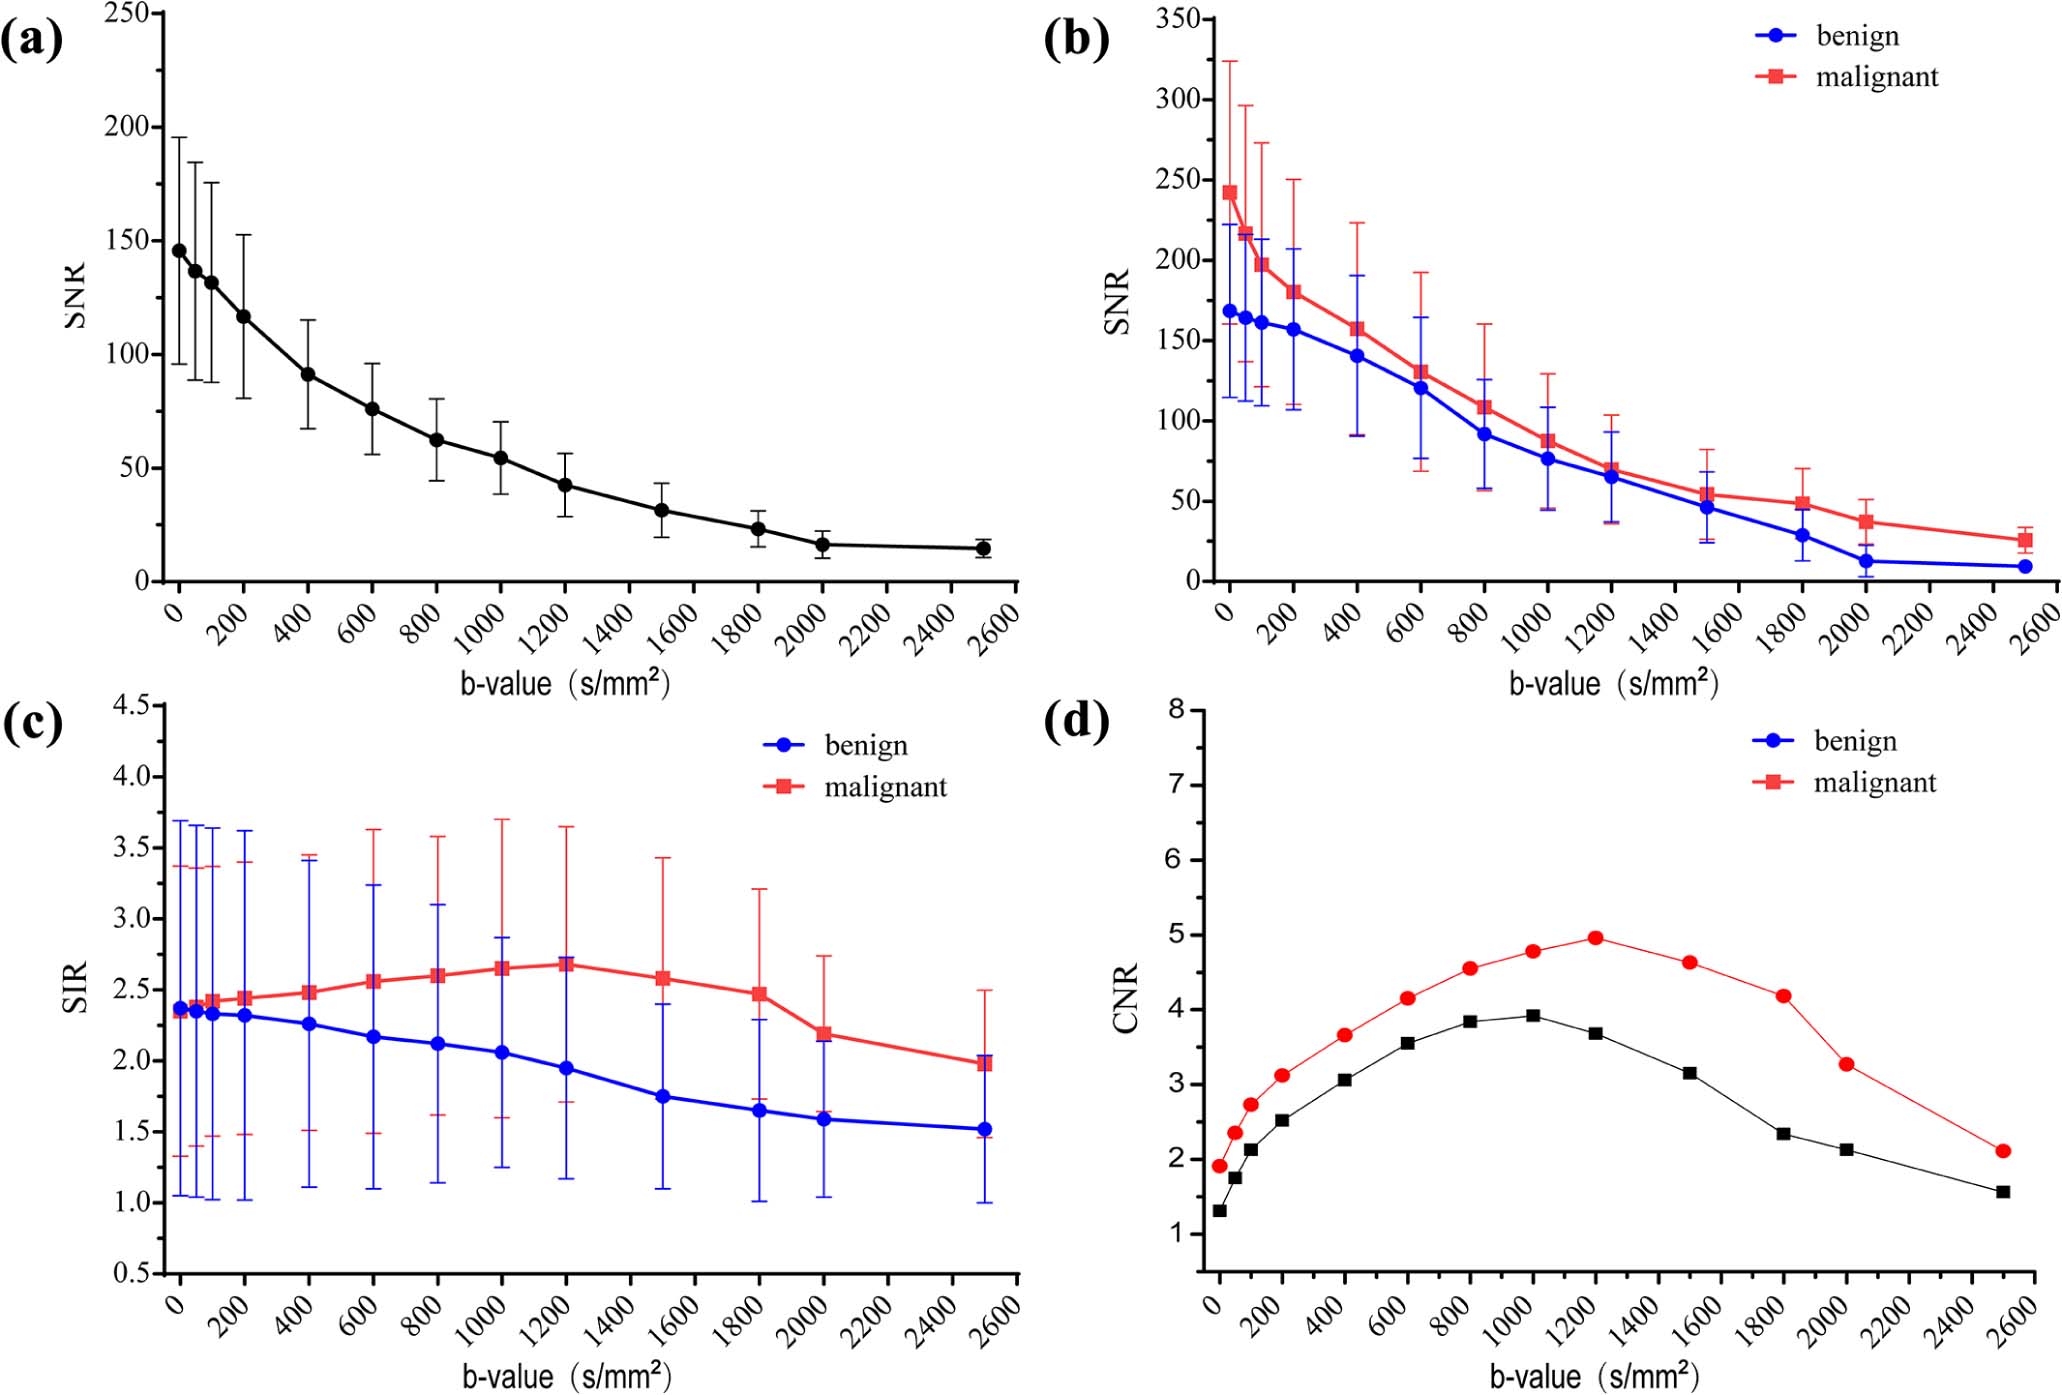
Breast DWI had higher CNR for b-values ranging from 600 to 1200 s/mm 2 . It had the best CNR at b = 1000 s/mm 2 for the benign lesions and at b = 1200 s/mm 2 for the malignant lesions. The signal intensity and SNR values of normal breasts decreased with increasing b-values, with a negative correlation ( r = −0.945, P < 0.01). The mean SNR values of benign and malignant lesions were negatively correlated ( r = −0.982 and −0.947, respectively, and P < 0.01), gradually decreasing with increasing b-values. The mean SIR value of benign lesions gradually decreased with increasing b-values, a negative correlation ( r = −0.991, P < 0.01). The mean SIR values of malignant lesions gradually increased with increasing b-values between 0 and 1200 s/mm 2 , and gradually decreased with increasing b-values ≥ 1500 s/mm 2 . For b-values of 600, 800, 1000, and 1200 s/mm 2 , the sensitivity and specificity of SIR in identifying benign and malignant lesions gradually increased with increasing b-values, peaking at 1200 s/mm 2 .
Conclusions
Breast DWI had higher image quality for b-values ranging from 600 to 1200 s/mm 2 , and was best for b-values ranging from 1000 to 1200 s/mm 2 . The SIR had the highest diagnostic efficiency in differentiating benign and malignant lesions for a b-value of 1200 s/mm 2 .
Introduction
Diffusion-weighted imaging (DWI) in magnetic resonance imaging (MRI) plays an important role in the diagnosis and differential diagnosis of breast lesions as well as in the evaluation of therapeutic efficacy in breast cancer . DWI can provide information at the tissue, cellular, and molecular levels, which is often used for diagnosis and prognosis evaluation in breast cancer . Therefore, the selection of DWI parameters for application and studies of its association with diagnostic efficacy have gained increasing attention . B-value is one of the most important parameters of DWI. B-value selection is closely related to the image quality of DWI and its ability to identify lesions. Currently, there are no widely accepted selection criteria for the optimal b-value for breast DWI at 3.0 T MR scanner . Therefore, the study of b-value optimization is of important clinical interest.
This study used multiple b-values to obtain DWI of normal breasts to measure and calculate the signal-to-noise ratio (SNR) for normal mammary glands. Diffusion-weighted images of benign and malignant lesions were obtained to measure and calculate the SNR, signal intensity ratio (SIR), and contrast-to-noise ratio (CNR) of lesions at different b-values to analyze the variations of SNR, SIR, and SIR. Furthermore, we compared diffusion-weighted images at four different b-values with higher image quality. The effect of SIR on the differential diagnostic efficiency of benign and malignant lesions was compared using receiver operating characteristic curves to provide a reference for obtaining the best quality of DWI.
Materials and Methods
Patient Data
Get Radiology Tree app to read full this article<
MRI Equipment and Measurement Parameters
Get Radiology Tree app to read full this article<
Get Radiology Tree app to read full this article<
Image Quality Grading and Evaluation Criteria
Get Radiology Tree app to read full this article<
Get Radiology Tree app to read full this article<
CNR=Slesions−Stissueσ2lesions+σ2tissue√ C
N
R
=
S
lesions
−
S
tissue
σ
2
lesions
+
σ
2
tissue
where S lesions is the measured signal intensity of lesions, S tissue is the signal intensity of normal tissue surrounding the lesions of the same level, and σ 2 lesions and σ 2 tissue are the standard deviation of intensity lesions and normal tissue .
Get Radiology Tree app to read full this article<
Statistical Methods
Get Radiology Tree app to read full this article<
Results
Grouping of Breast Diseases and Evaluation of Image Quality
Get Radiology Tree app to read full this article<
TABLE 1
Comparison of Image Quality Gradings for 3.0 T DWI Performed with Different b-Values
b-Values (s/mm 2 ) 0–400 (Average) 600 800 1000 1200 1500 1800 2000 2500 Grade A 98 94 90 89 84 72 69 58 45 Grade B 14 18 22 23 28 38 41 50 62 Grade C 0 0 0 0 0 2 2 4 5
DWI, diffusion-weighted imaging.
Get Radiology Tree app to read full this article<
Variation Patterns of SNR and SIR Values on Diffusion-weighted Images
Variation Patterns of Mean SNR Values of the Normal Mammary Glands
Get Radiology Tree app to read full this article<
Variation Patterns of Mean SNR Values of Benign and Malignant Lesions
Get Radiology Tree app to read full this article<
Variation Patterns of Mean SIR Values of Benign and Malignant Lesions
Get Radiology Tree app to read full this article<
Comparison of SNR and SIR Values of Benign and Malignant Lesions with Different b-Values (600, 800, 1000, and 1200) and Evaluation of Diagnostic Efficiency
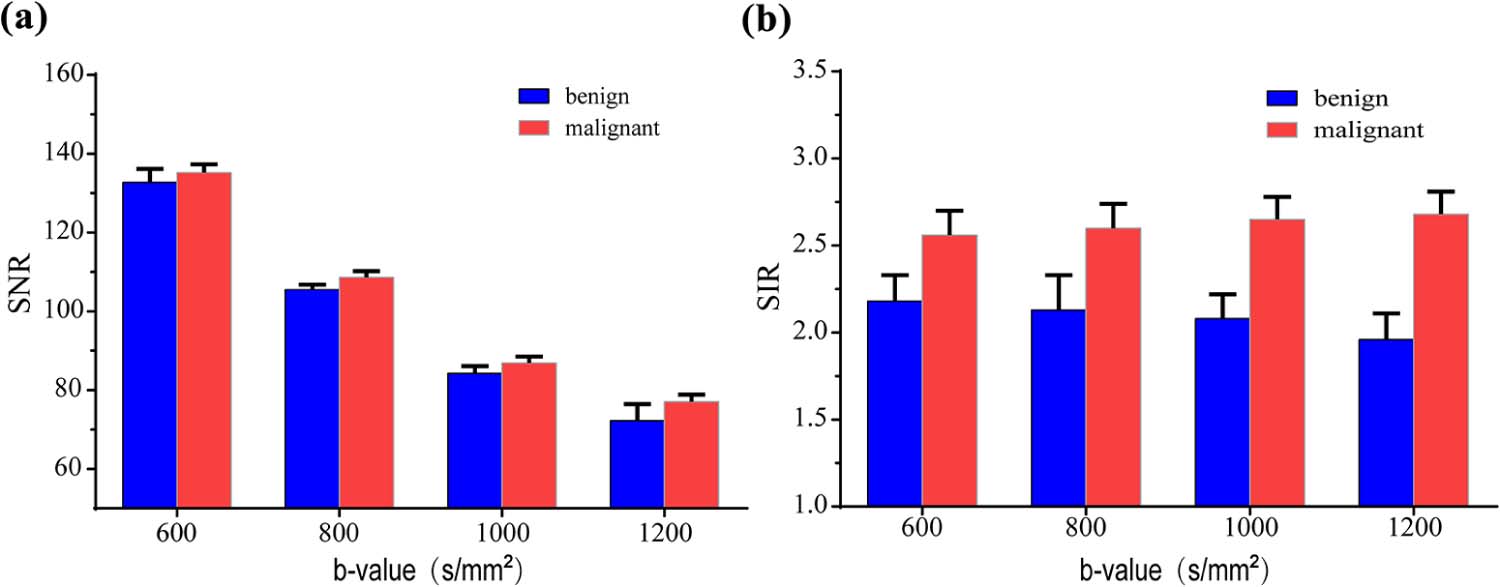
Comparison of SNR and SIR Values of Diffusion-weighted Images of Benign and Malignant Lesions
Get Radiology Tree app to read full this article<
TABLE 2
Comparison of SNR Values of Benign and Malignant Lesions ( t Test)
b-Values (s/mm 2 ) 600 800 1000 1200 Benign (mean ± SD) 132.73 ± 3.41 105.50 ± 1.29 84.29 ± 1.76 72.28 ± 4.18 Malignant (mean ± SD) 135.23 ± 2.09 108.60 ± 1.59 86.90 ± 1.64 77.07 ± 1.80t value −4.81 −16.08 −7.71 −7.99P value <0.01 <0.01 <0.01 <0.01
SD, standard deviation; SNR, signal-to-noise ratio.
Get Radiology Tree app to read full this article<
Get Radiology Tree app to read full this article<
TABLE 3
Comparison of SIR Values of Benign and Malignant Lesions ( t Test)
b-Values (s/mm 2 ) 600 800 1000 1200 Benign (mean ± SD) 2.18 ± 0.15 2.13 ± 0.20 2.08 ± 0.14 1.96 ± 0.15 Malignant (mean ± SD) 2.56 ± 0.14 2.60 ± 0.14 2.65 ± 0.13 2.68 ± 0.13t value −155.05 −185.75 −206.01 −221.91P value <0.01 <0.01 <0.01 <0.01
SD, standard deviation; SIR, signal intensity ratio.
Get Radiology Tree app to read full this article<
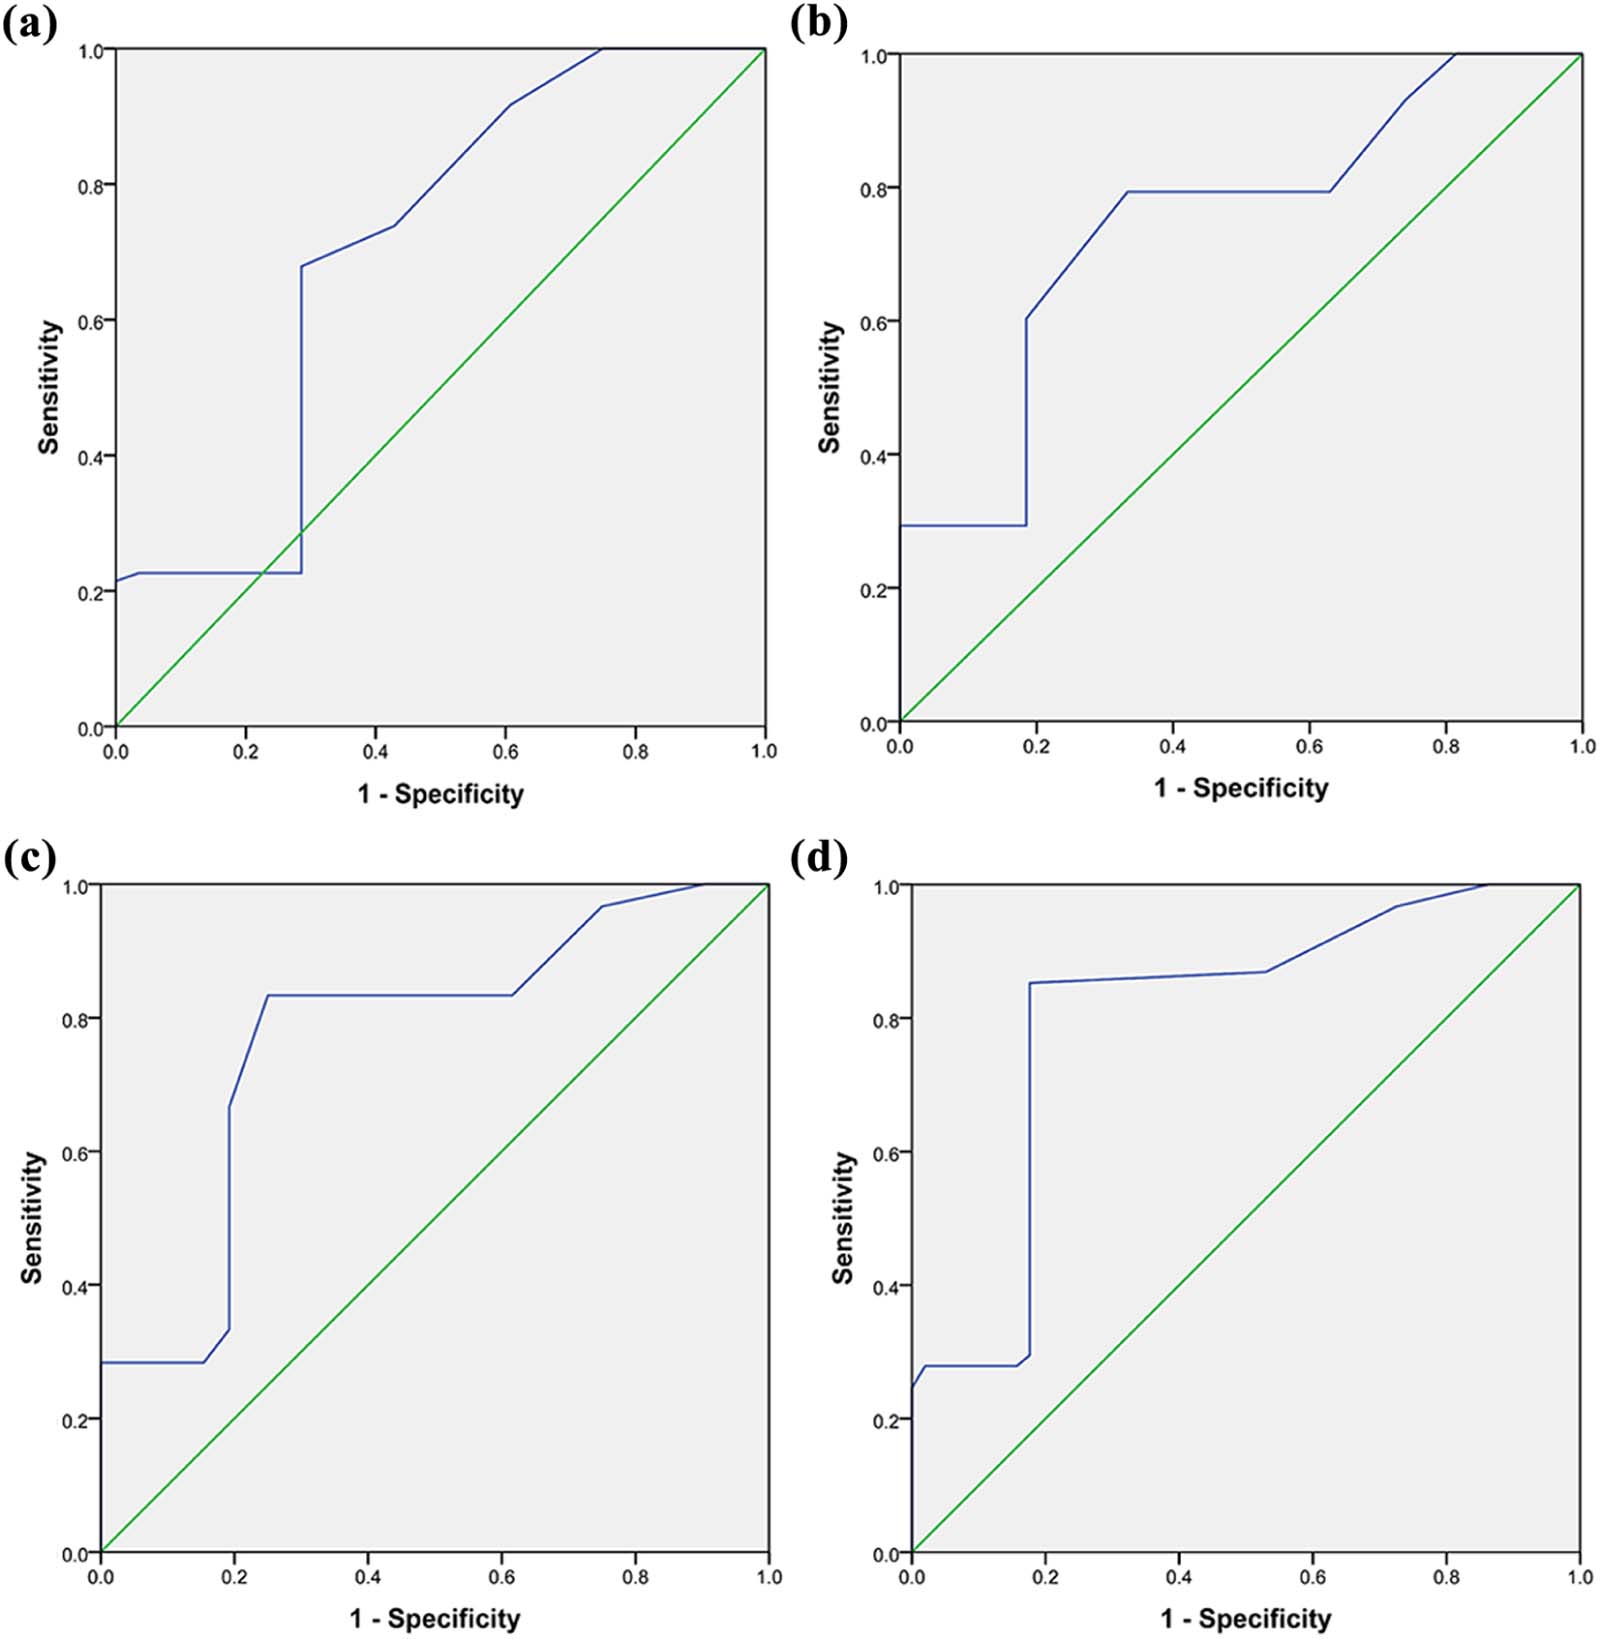
Evaluation of Differential Diagnostic Values Using SIR for Benign and Malignant Lesions
Get Radiology Tree app to read full this article<
TABLE 4
Evaluation of Diagnostic Efficiency of SIR Values with Four Different b-Values
b-Values (s/mm 2 ) AUC Cutoff of SIR 95% CI Sensitivity (%) Specificity (%) 600 0.700 2.19 0.575–0.826 67.9 71.4 800 0.745 2.14 0.653–0.837 79.3 66.7 1000 0.772 2.09 0.682–0.862 83.3 75.0 1200 0.805 1.97 0.719–0.891 85.2 82.4
AUC, area under the curve; CI, confidence interval; SIR, signal intensity ratio.
Get Radiology Tree app to read full this article<
Discussion
Get Radiology Tree app to read full this article<
Get Radiology Tree app to read full this article<
Get Radiology Tree app to read full this article<
Get Radiology Tree app to read full this article<
Get Radiology Tree app to read full this article<
Get Radiology Tree app to read full this article<
Get Radiology Tree app to read full this article<
References
1. Sardanelli F., Giuseppetti G.M., Panizza P., et. al.: Sensitivity of MRI versus mammography for detecting foci of multifocal, multicentric breast cancer in fatty and dense breasts using the whole-breast pathologic examination as a gold standard. AJR Am J Roentgenol 2004; 183: pp. 1149-1157.
2. Kuhl C.K., Schrading S., Leutner C.C., et. al.: Mammography, breast ultrasound, and magnetic resonance imaging for surveillance of women at high familial risk for breast cancer. J Clin Oncol 2005; 23: pp. 8469-8476.
3. Leach M.O., Boggis C.R., Dixon A.K., et. al.: Screening with magnetic resonance imaging and mammography of a UK population at high familial risk of breast cancer: a prospective multicentre cohort study (MARIBS). Lancet 2005; 365: pp. 1769-1778.
4. Saslow D., Boetes C., Burke W., et. al.: American Cancer Society guidelines for breast screening with MRI as an adjunct to mammography. CA Cancer J Clin 2007; 57: pp. 75-89.
5. Rubesova E., Grell A.S., De Maertelaer V., et. al.: Quantitative diffusion imaging in breast cancer: a clinical prospective study. J Magn Reson Imaging 2006; 24: pp. 319-324.
6. Partridge S.C., DeMartini W.B., Kurland B.F., et. al.: Quantitative diffusion-weighted imaging as an adjunct to conventional breast MRI for improved positive predictive value. AJR Am J Roentgenol 2009; 193: pp. 1716-1722.
7. Partridge S.C., Rahbar H., Murthy R., et. al.: Improved diagnostic accuracy of breast MRI through combined apparent diffusion coefficients and dynamic contrast-enhanced kinetics. Magn Reson Med 2011; 65: pp. 1759-1767.
8. Pereira F.P., Martins G., Carvalhaes de Oliveira Rde V.: Diffusion magnetic resonance imaging of the breast. Magn Reson Imaging Clin N Am 2011; 19: pp. 95-110.
9. Bogner W., Gruber S., Pinker K., et. al.: Diffusion-weighted MR for differentiation of breast lesions at 3.0 T: how does selection of diffusion protocols affect diagnosis?. Radiology 2009; 253: pp. 341-351.
10. Woodhams R., Ramadan S., Stanwell P., et. al.: Diffusion-weighted imaging of the breast: principles and clinical applications. Radiographics 2011; 31: pp. 1059-1084.
11. Peters N.H., Vincken K.L., van den Bosch M.A., et. al.: Quantitative diffusion weighted imaging for differentiation of benign and malignant breast lesions: the influence of the choice of b-values. J Magn Reson Imaging 2010; 31: pp. 1100-1105.
12. Ei Khouli R.H., Jacobs M.A., Mezban S.D., et. al.: Diffusion- weighted imaging improves the diagnostic accuracy of conventional 3.0-T breast MR imaging. Radiology 2010; 256: pp. 64-73.
13. Chen X., He X.J., Jin R., et. al.: Conspicuity of breast lesions at different b values on diffusion-weighted imaging. BMC Cancer 2012; 12: pp. 334.
14. Song X., Pogue B.W., Jiang S., et. al.: Automated region detection based on the contrast-to-noise ratio in near-infrared tomography. Appl Opt 2004; 43: pp. 1053-1062.
15. Koh D.M., Collins D.J.: Diffusion-weighted MRI in the body: applications and challenges in oncology. AJR Am J Roentgenol 2007; 188: pp. 1622-1635.
16. Woodhams R., Kakita S., Hata H., et. al.: Identification of residual breast carcinoma following neoadjuvant chemotherapy: diffusion-weighted imaging—comparison with contrast-enhanced MR imaging and pathologic findings. Radiology 2010; 254: pp. 357-366.
17. Yabuuchi H., Matsuo Y., Sunami S., et. al.: Detection of non-palpable breast cancer in asymptomatic women by using unenhanced diffusion-weighted and T2-weighted MR imaging: comparison with mammography and dynamic contrast-enhanced MR imaging. Eur Radiol 2011; 21: pp. 11-17.
18. Guo Y., Cai Y.Q., Cai Z.L., et. al.: Differentiation of clinically benign and malignant breast lesions using diffusion-weighted imaging. J Magn Reson Imaging 2002; 16: pp. 172-178.
19. Kuroki Y., Nasu K.: Advances in breast MRI: diffusion-weighted imaging of the breast. Breast Cancer 2008; 15: pp. 212-217.
20. Marini C., Iacconi C., Giannelli M., et. al.: Quantitative diffusion-weighted MR imaging in the differential diagnosis of breast lesion. Eur Radiol 2007; 17: pp. 2646-2655.
21. Bonekamp S., Corona-Villalobos C.P., Kamel I.R.: Oncologic applications of diffusion-weighted MRI in the body. J Magn Reson Imaging 2012; 35: pp. 257-279.
22. Ochi M., Kuroiwa T., Sunami S., et. al.: Diffusion-weighted imaging (b value = 1500 s/mm(2)) is useful to decrease false-positive breast cancer cases due to fibrocystic changes. Breast Cancer 2013; 20: pp. 137-144.
23. Sonmez G., Cuce F., Mutlu H., et. al.: Value of diffusion-weighted MRI in the differentiation of benign and malign lesions. Wien Klin Wochenschr 2011; 123: pp. 655-661.
24. Inoue K., Kozawa E., Mizukoshi W., et. al.: Usefulness of diffusion-weighted imaging of breast tumors: quantitative and visual assessment. Jpn J Radiol 2011; 29: pp. 429-436.
25. Imamura T., Isomoto I., Sueyoshi E., et. al.: Diagnostic performance of ADC for non-mass-like breast lesions on MR imaging. Magn Reson Med Sci 2010; 9: pp. 217-225.
26. Kul S., Cansu A., Alhan E., et. al.: Contribution of diffusion-weighted imaging to dynamic contrast-enhanced MRI in the characterization of breast tumors. AJR Am J Roentgenol 2011; 196: pp. 210-217.
27. Fornasa F., Pinali L., Gasparini A., et. al.: Diffusion-weighted magnetic resonance imaging in focal breast lesions: analysis of 78 cases with pathological correlation. Radiol Med 2011; 116: pp. 264-275.
28. Baltzer P.A., Schäfer A., Dietzel M., et. al.: Diffusion tensor magnetic resonance imaging of the breast: a pilot study. Eur Radiol 2011; 21: pp. 1-10.
29. Koh D.M., Takahara T., Imai Y., et. al.: Practical aspects of assessing tumors using clinical diffusion-weighted imaging in the body. Magn Reson Med Sci 2007; 6: pp. 211-224.
30. Hiwatashi A., Kinoshita T., Moritani T., et. al.: Hypointensity on diffusion-weighted MRI of the brain related to T2 shortening and susceptibility effects. AJR Am J Roentgenol 2003; 181: pp. 1705-1709.
31. Partridge S.C., Demartini W.B., Kurland B.F., et. al.: Differential diagnosis of mammographically and clinically occult breast lesions on diffusion-weighted MRI. J Magn Reson Imaging 2010; 31: pp. 562-570.
32. Tsushima Y., Takahashi-Taketomi A., Endo K.: Magnetic resonance (MR) differential diagnosis of breast tumors using apparent diffusion coefficient (ADC) on 1.5-T. J Magn Reson Imaging 2009; 30: pp. 249-255.
33. Noqueira L., Brandão S., Matos E., et. al.: Diffusion-weighted imaging: determination of the best pair of b-values to discriminate breast lesions. Br J Radiol 2014; 87: 20130807
34. Dorrius M.D., Dijkstra H., Oudkerk M., et. al.: Effect of b value and pre-admission of contrast on diagnostic accuracy of 1.5-T breast DWI: a systematic review and meta-analysis. Eur Radiol 2014; 24: pp. 2835-2847.
35. Woodhams R., Inoue Y., Ramadan S., et. al.: Diffusion-weighted imaging of the breast: comparison of b-values 1000 s/mm 2 and 1500 s/mm 2 . Magn Reson Med Sci 2013; 12: pp. 229-234.