
Rationale and Objectives
The aim of this study was to investigate the effect of perfusion computed tomography (PCT) with acetazolamide (ACZ) challenge and compare it to 10% carbon dioxide (CO 2 ) challenge in rat C6 glioma.
Materials and Methods
PCT was performed on 32 rats, including 20 with orthotopically implanted C6 gliomas and 12 serving as controls. Ten rats with gliomas and six normal rats underwent PCT with ACZ challenge. The other 10 rats with gliomas and six normal rats underwent PCT with 10% CO 2 challenge. The raw data were processed using Philips computed tomographic brain perfusion software. Perfusion parameters before and after the challenge were recorded. Percentage changes due to ACZ administration and 10% CO 2 challenge were calculated. Pearson’s correlation coefficients were used to investigate relationships between percentage changes in perfusion parameters and vascular endothelial growth factor and microvessel density.
Results
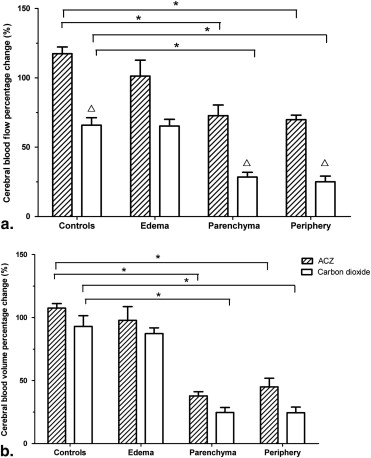
In C6 gliomas, percentage change in cerebral blood flow was significantly different between ACZ (72.73%) and 10% CO 2 (28.47%) challenge ( P < .01). Percentage change in cerebral blood volume was 37.85% with ACZ and 24.69% with 10% CO 2 challenge ( P = .02). In controls, percentage change in cerebral blood flow was significantly different between ACZ (117.42%) and 10% CO 2 (65.86%) challenge ( P < .01). For percentage change in cerebral blood volume, there was no significant difference between ACZ (107.51%) and 10% CO 2 (92.95%) challenge. Significant correlations were observed among percentage changes in vascular endothelial growth factor, microvessel density, and cerebral blood volume ( P < .01). Percentage change in cerebral blood flow correlated well with vascular endothelial growth factor.
Conclusions
The results of this study indicate that PCT with ACZ challenge is a more reliable technique compared to 10% CO 2 challenge for the quantitative evaluation of microcirculation in gliomas.
Glioma is one of the most prevalent primary brain tumors in adults. The growth and metastasis of glioma require adequate vascularization . The intensity of angiogenesis is a determinant of tumor aggression. Highly vascularized gliomas are associated with a poor prognosis, because they consist of elevated expression levels of vascular endothelial growth factor (VEGF), which is an important mediator of angiogenesis . Assessment of angiogenesis is therefore a key element in diagnosis of glioma and is still an open field of research . Cerebrovascular reactivity is expressed as change in cerebral blood flow (CBF) from baseline under a vasodilatory stimuli and serves as a marker of cerebral microcirculation function . Normally, the challenge will result in a robust increase in CBF. If the CBF response is muted or absent, preexisting cerebral vasodilation or dysfunction of cerebral vessel is inferred . A mixture of 10% carbon dioxide (CO 2 ) and 90% air and acetazolamide (ACZ) are increasingly being used as vasodilators. ACZ is an inhibitor of the enzyme carbonic anhydrase that catalyzes the reversible reaction involving the hydration of CO 2 and the dehydration of carbonic acid . Although biopsy and histology remain the gold standard to characterize brain tumor microvascularity, there is a possibility of sampling errors. Additionally, the functionality of blood vessels cannot be estimated by histology. Hence, intense research is conducted to develop noninvasive imaging methods that can afford a comprehensive evaluation of glioma vascular supply.
Perfusion computed tomography (PCT) has become a promising tool for a quick and inexpensive evaluation of the cerebral circulation . Although positron emission tomography (PET) and magnetic resonance (MR) imaging are not available at smaller centers and hospitals, the advantage of PCT over positron emission tomographic and MR perfusion methods are that PCT is relatively simple and straightforward and provides quantitative measures of perfusion parameters, which are difficult to obtain using MR imaging or PET . Thus, in this study, PCT was used to investigate cerebral and C6 glioma perfusion changes induced by challenge with ACZ and with a mixture of 10% CO 2 and 90% air. Correlations were investigated between PCT with ACZ and VEGF and microvessel density (MVD).
Materials and methods
Research Subjects
Get Radiology Tree app to read full this article<
Animal Preparation
Get Radiology Tree app to read full this article<
Get Radiology Tree app to read full this article<
Perfusion Computed Tomographic (CT) and Challenge Procedure
Get Radiology Tree app to read full this article<
Get Radiology Tree app to read full this article<
Histologic Analysis
Get Radiology Tree app to read full this article<
Data Processing
Get Radiology Tree app to read full this article<
Get Radiology Tree app to read full this article<
Statistical Analysis
Get Radiology Tree app to read full this article<
Results
Perfusion CT Parameters of Different Areas of Rat C6 Glioma
Get Radiology Tree app to read full this article<
Table 1
Perfusion Parameters in Controls, Tumor Central Parenchyma, and Periphery
Variable Controls Central Parenchyma Periphery ( n = 12) ( n = 20) ( n = 20) Cerebral blood flow (mL/100 g/min) 54.37 ± 11.40 89.33 ± 21.80 ∗ 109.68 ± 22.11 ∗,† Cerebral blood volume (mL/100 g) 8.68 ± 1.06 43.06 ± 10.75 ∗ 51.60 ± 10.20 ∗,† Mean transit time (s) 9.06 ± 1.89 14.02 ± 12.07 14.97 ± 12.15 Time to peak (s) 21.14 ± 1.82 20.68 ± 15.00 21.75 ± 15.67 Permeability (mL/100 g/min) 1.18 ± 0.18 15.68 ± 2.62 ∗ 17.88 ± 2.59 ∗,†
Data are expressed as mean ± standard deviation.
Get Radiology Tree app to read full this article<
Get Radiology Tree app to read full this article<
Get Radiology Tree app to read full this article<
Comparison of Percentage Changes in Perfusion CT Parameters with ACZ or 10% CO 2 Challenge in Controls
Get Radiology Tree app to read full this article<
Get Radiology Tree app to read full this article<
Comparison between ACZ and 10% CO 2 Challenge in Rat C6 Glioma
Get Radiology Tree app to read full this article<
Table 2
Perfusion Data of Perfusion Computed Tomography Performed with ACZ and CO 2
Variable_n_ Cerebral Blood Flow (mL/100 g/min) Cerebral Blood Volume (mL/100 g) Controls before ACZ 6 56.01 ± 4.71 8.66 ± 0.76 Controls after ACZ 6 86.88 ± 11.08 ∗ 20.66 ± 9.58 ∗ Controls before 10% CO 2 6 52.74 ± 15.61 8.71 ± 1.32 Controls after 10% CO 2 6 62.26 ± 24.20 ∗ 14.82 ± 8.77 ∗ Gliomas before ACZ 10 80.56 ± 10.33 38.07 ± 11.50 Gliomas after ACZ 10 159.40 ± 10.32 ∗ 60.69 ± 15.05 ∗ Gliomas before 10% CO 2 10 52.74 ± 15.61 8.71 ± 1.33 Gliomas after 10% CO 2 10 125.15 ± 22.98 ∗ 51.04 ± 10.76 ∗
ACZ, acetazolamide; CO 2 , carbon dioxide.
Data are expressed as mean ± standard deviation.
Get Radiology Tree app to read full this article<
Get Radiology Tree app to read full this article<
Correlation in C6 Tumor of Percentage Change Induced by ACZ and VEGF and MVD
Get Radiology Tree app to read full this article<
Table 3
Pearson’s Correlations in C6 Tumors of Percentage Change Induced by Acetazolamide and Microvessel Density and Vascular Endothelial Growth Factor
Variable_r_ (CBF Percentage Change)r (CBV Percentage Change) Microvessel density 0.458 0.931 ‡ Vascular endothelial growth factor 0.516 ∗ 0.724 †
CBF, cerebral blood flow; CBV, cerebral blood volume.
Get Radiology Tree app to read full this article<
Get Radiology Tree app to read full this article<
Get Radiology Tree app to read full this article<
Table 4
Microvessel Density and Vascular Endothelial Growth Factor in Controls and Tumor Central Parenchyma
Variable Controls Tumor Central Parenchyma_P_ ( n = 6) ( n = 10) Microvessel density 2.09 ± 0.35 6.48 ± 1.93 .02 Vascular endothelial growth factor 3.13 ± 1.04 8.04 ± 2.69 .01
Data are expressed as mean ± standard deviation.
Get Radiology Tree app to read full this article<
Discussion
Get Radiology Tree app to read full this article<
Get Radiology Tree app to read full this article<
Get Radiology Tree app to read full this article<
Get Radiology Tree app to read full this article<
Get Radiology Tree app to read full this article<
Get Radiology Tree app to read full this article<
Get Radiology Tree app to read full this article<
Get Radiology Tree app to read full this article<
Get Radiology Tree app to read full this article<
Get Radiology Tree app to read full this article<
Conclusions
Get Radiology Tree app to read full this article<
Acknowledgments
Get Radiology Tree app to read full this article<
Get Radiology Tree app to read full this article<
References
1. Sica G., Lama G., Anile C., et. al.: Assessment of angiogenesis by CD105 and nestin expression in peritumor tissue of glioblastoma. Int J Oncol 2011; 38: pp. 41-49.
2. Chamberlain M.C.: Emerging clinical principles on the use of bevacizumab for the treatment of malignant gliomas. Cancer 2010; 116: pp. 3988-3999.
3. Folkman J.: Is angiogenesis an organizing principle in biology and medicine?. J Pediatr Surg 2007; 42: pp. 1-11.
4. Kozera G.M., Dubaniewicz M., Zdrojewski T., et. al.: Cerebral vasomotor reactivity and extent of white matter lesions in middle-aged men with arterial hypertension: a pilot study. Am J Hypertens 2010; 23: pp. 1198-1203.
5. Chen A., Shyr M.H., Chen T.Y., et. al.: Dynamic CT perfusion imaging with acetazolamide challenge for evaluation of patients with unilateral cerebrovascular steno-occlusive disease. AJNR Am J Neuroradiol 2006; 27: pp. 1876-1881.
6. Van der Heyden J., Waaijer A., Van Wouter E.S., et. al.: CT measurement of changes in cerebral perfusion in patients with asymptomatic carotid artery stenosis undergoing carotid stenting prior to cardiac surgery: “proof of principle.”. Eurointervention 2011; 6: pp. 1091-1097.
7. Zussman B.M., Boghosian G., Gorniak R.J., et. al.: The relative effect of vendor variability in CT perfusion results: a method comparison study. AJR Am J Roentgenol 2011; 197: pp. 468-473.
8. Balvay D., Tropres I., Billet R., et. al.: Mapping the zonal organization of tumor perfusion and permeability in a rat glioma model by using dynamic contrast-enhanced synchrotron radiation CT. Radiology 2009; 250: pp. 692-702.
9. Miles K.A.: Molecular imaging with dynamic contrast-enhanced computed tomography. Clin Radiol 2010; 65: pp. 549-556.
10. Lu N., Feng X.Y., Hao S.J., et. al.: 64-slice CT perfusion imaging of pancreatic adenocarcinoma and mass-forming chronic pancreatitis. Acad Radiol 2011; 18: pp. 81-88.
11. Ovali G.Y., Sakar A., Goktan C., et. al.: Thorax perfusion CT in non-small cell lung cancer. Comput Med Imaging Graph 2007; 31: pp. 686-691.
12. Burns J.D., Jacob J.T., Luetmer P.H., et. al.: CT perfusion evidence of early global cerebral hypoperfusion after aneurysmal subarachnoid hemorrhage with cardiac arrest. Neurocrit Care 2010; 12: pp. 261-264.
13. Kambadakone A.R., Sahani D.V.: Body perfusion CT: technique, clinical applications, and advances. Radiol Clin North Am 2009; 47: pp. 161-178.
14. Miao Y., Juhasz C., Wu J., et. al.: Clinical correlates of white matter blood flow perfusion changes in Sturge-Weber syndrome: a dynamic MR perfusion-weighted imaging study. AJNR Am J Neuroradiol 2011; 32: pp. 1280-1285.
15. Asdaghi N., Hameed B., Saini M., et. al.: Acute perfusion and diffusion abnormalities predict early new MRI lesions 1 week after minor stroke and transient ischemic attack. Stroke 2011; 42: pp. 2191-2195.
16. Park J.C., Kim J.E., Kang H.S., et. al.: CT perfusion with angiography as a substitute for both conventional digital subtraction angiography and acetazolamide-challenged SPECT in the follow-up of postbypass patients. Cerebrovasc Dis 2010; 30: pp. 547-555.
17. Sasaki M., Kudo K., Ogasawara K., et. al.: Tracer delay-insensitive algorithm can improve reliability of CT perfusion imaging for cerebrovascular steno-occlusive disease: comparison with quantitative single-photon emission CT. AJNR Am J Neuroradiol 2009; 30: pp. 188-193.
18. Riordan A.J., Prokop M., Viergever M.A., et. al.: Validation of CT brain perfusion methods using a realistic dynamic head phantom. Med Phys 2011; 38: pp. 3212-3221.
19. Meier P., Zierler K.L.: On the theory of the indicator-dilution method for measurement of blood flow and volume. J Appl Physiol 1954; 6: pp. 731-744.
20. Cenic A., Nabavi D.G., Craen R.A., et. al.: A CT method to measure hemodynamics in brain tumors: validation and application of cerebral blood flow maps. AJNR Am J Neuroradiol 2000; 21: pp. 462-470.
21. Axel L.: Cerebral blood flow determination by rapid-sequence computed tomography: theoretical analysis. Radiology 1980; 137: pp. 679-686.
22. Patlak C.S., Blasberg R.G., Fenstermacher J.D.: Graphical evaluation of blood-to-brain transfer constants from multiple-time uptake data. J Cereb Blood Flow Metab 1983; 3: pp. 1-7.
23. Cianfoni A., Cha S., Bradley W.G., et. al.: Quantitative measurement of blood-brain barrier permeability using perfusion-CT in extra-axial brain tumors. J Neuroradiol 2006; 33: pp. 164-168.
24. Hom J., Dankbaar J.W., Schneider T., et. al.: Optimal duration of acquisition for dynamic perfusion CT assessment of blood-brain barrier permeability using the Patlak model. AJNR Am J Neuroradiol 2009; 30: pp. 1366-1370.
25. Hopyan J., Ciarallo A., Dowlatshahi D., et. al.: Certainty of stroke diagnosis: incremental benefit with CT perfusion over noncontrast CT and CT angiography. Radiology 2010; 255: pp. 142-153.
26. Andaluz N., Choutka O., Vagal A., et. al.: Patient selection for revascularization procedures in adult Moyamoya disease based on dynamic perfusion computerized tomography with acetazolamide challenge (PCTA). Neurosurg Rev 2010; 33: pp. 225-232.
27. Jin N., Deng J., Chadashvili T., et. al.: Carbogen gas-challenge BOLD MR imaging in a rat model of diethylnitrosamine-induced liver fibrosis. Radiology 2010; 254: pp. 129-137.
28. Kang K.H., Kim H.S., Kim S.Y.: Quantitative cerebrovascular reserve measured by acetazolamide-challenged dynamic CT perfusion in ischemic adult Moyamoya disease: initial experience with angiographic correlation. AJNR Am J Neuroradiol 2008; 29: pp. 1487-1493.
29. Vagal A.S., Leach J.L., Fernandez-Ulloa M., et. al.: The acetazolamide challenge: techniques and applications in the evaluation of chronic cerebral ischemia. AJNR Am J Neuroradiol 2009; 30: pp. 876-884.
30. Guan L.M., Qi X.X., Xia B., et. al.: Early changes measured by CT perfusion imaging in tumor microcirculation following radiosurgery in rat C6 brain gliomas. J Neurosurg 2011; 114: pp. 1672-1680.
31. Jain R., Narang J., Gutierrez J., et. al.: Correlation of immunohistologic and perfusion vascular parameters with MR contrast enhancement using image-guided biopsy specimens in gliomas. Acad Radiol 2011; 18: pp. 955-962.
32. Miles K.A.: Brain perfusion: computed tomography applications. Neuroradiology 2004; 46: pp. s194-s200.
33. Miles K.A.: Tumour angiogenesis and its relation to contrast enhancement on computed tomography: a review. Eur J Radiol 1999; 30: pp. 198-205.
34. Schramm P., Xyda A., Klotz E., et. al.: Dynamic CT perfusion imaging of intra-axial brain tumours: differentiation of high-grade gliomas from primary CNS lymphomas. Eur Radiol 2010; 20: pp. 2482-2490.
35. Smith L.M., Elkins J.S., Dillon W.P., et. al.: Perfusion-CT assessment of the cerebrovascular reserve: a revisit to the acetazolamide challenges. J Neuroradiol 2008; 35: pp. 157-164.
36. Tomura N., Sasaki K., Kidani H., et. al.: Reduced perfusion reserve in leukoaraiosis demonstrated using acetazolamide challenge 123I-IMP SPECT. J Comput Assist Tomogr 2007; 31: pp. 884-887.
37. Kawamura Y., Ashizaki M., Saida S., et. al.: Usefulness of rate of increase in SPECT counts in one-day method of N-isopropyl-4-iodoamphetamine [123I] SPECT studies at rest and after acetazolamide challenge using a method for estimating time-dependent distribution at rest. Ann Nucl Med 2008; 22: pp. 457-463.
38. Aamand R., Skewes J., Moller A., et. al.: Enhancing effects of acetazolamide on neuronal activity correlate with enhanced visual processing ability in humans. Neuropharmacology 2011; 61: pp. 900-908.
39. Tawfik A.M., Razek A.A., Elsorogy L.G., et. al.: Perfusion CT of head and neck cancer: effect of arterial input selection. AJR Am J Roentgenol 2011; 196: pp. 1374-1380.