
Rationale and Objectives
The purpose of this study is to review the apparent diffusion coefficient (ADC) values of benign and metastatic abdominal lymph nodes on diffusion-weighted imaging (DWI).
Materials and Methods
Twenty-eight patients with a total of 40 benign (20 patients) and 16 malignant (8 patients) lymph nodes who underwent DWI MRI of the abdomen (b = 0.600) were enrolled in the study. ADC values of the lymph nodes were measured and comparison was made between benign and malignant groups.
Results
Mean ADC value of lymph nodes was 2.38 ± 0.29 and 1.84 ± 0.37 × 10 −3 mm 2 /sec in the benign and malignant groups, respectively. There was a significant statistical difference between the ADC values of benign and malignant lymph nodes ( P < .0005).
Conclusion
A wide range of ADC values exist in patients with metastatic abdominal lymph nodes, with a tendency of higher ADC values in benign lymph nodes.
Evaluation of lymph node metastases is important for oncologic staging. Histopathologic analysis is the most accurate way to determine the composition of lymph nodes and can differentiate between benign and malignant involvement. Tissue sampling can be very challenging in the abdomen and inadequate samples are not uncommon. This may lead to false-negative results ( ). Imaging has been used for staging of oncology patients, including lymph node assessment. Lymph nodes can be detected on imaging by their increased size, but standard imaging modalities may be indeterminate for the nature of enlargement. Positron emission tomography (PET) and single-photon emission computed tomography have been used to differentiate benign from malignant lymph nodes according to the amount of radioactive tracer uptake ( ). Despite their increased specificity, false-negative and false-positive diagnoses may occur. Diffusion-weighted imaging (DWI) has been used in oncologic imaging for the depiction and characterization of tumors as well as differentiating benign from malignant lesions ( ). In this study, we reviewed the apparent diffusion coefficient (ADC) values of lymph nodes visualized on routine abdomen MRI images and their relationship with the final clinical diagnosis.
Materials and methods
Patients
This study was performed retrospectively and is Health Insurance Portability and Accountability Act–compliant. The institutional review board approved the study and waived the requirement for informed consent for the retrospective patient data review. After a review of medical, radiologic, and pathologic records obtained between September 2004 and January 2007 in our institution, 28 patients with reported abdominal lymph nodes on MRI were included in the study who had their final diagnoses determined by histopathology, integrated 18 F-fluoro-2-deoxyglucose (FDG) PET computed tomography (CT), or follow-up imaging. Time interval between final diagnosis and MRI was no longer than 4 weeks in all of the malignant cases. None of the patients in the malignant group had been treated for their diseases prior to imaging.
Get Radiology Tree app to read full this article<
Imaging
Get Radiology Tree app to read full this article<
Image Analysis
Get Radiology Tree app to read full this article<
Get Radiology Tree app to read full this article<
Get Radiology Tree app to read full this article<
Statistical Analysis
Get Radiology Tree app to read full this article<
Results
Get Radiology Tree app to read full this article<
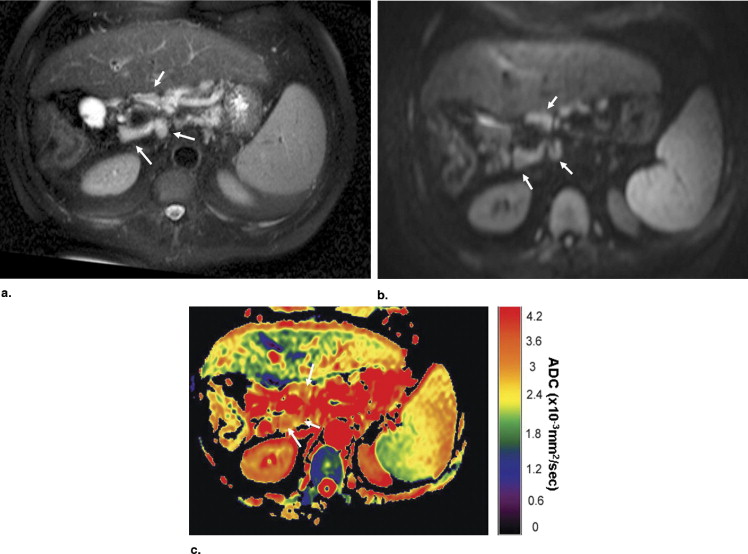
Table 1
Locations, Size, and ADC Value of Benign Lymph Nodes
Underlying Disease Locations Mean Diameter (mm) Mean ADC ⁎ Short Axis Long Axis Hepatitis C Celiac, celiac 8.7 11.2 2.92 Hepatitis C Portacaval, hepatic hilar 12.0 17.3 2.18 Chronic pancreatitis Pyloric, peripancreatic 11.7 14.0 2.42 Hepatitis B and C Hepatic hilar 8.5 13.9 2.02 Hepatitis C Portacaval, celiac, celiac 16.1 22.0 2.22 NASH Periportal, periportal, periportal 10.9 22.1 2.28 PSC Hepatic, celiac, hepatic 12.0 20.3 2.49 Chronic pancreatitis SMA node 10.0 12.0 2.57 Chronic pancreatitis SMA node 8.4 8.8 2.09 Chronic pancreatitis SMA node 11.6 16.0 2.02 Granulomatous hepatitis Hepatic hilar, hepatic, hepatic, portacaval 11.5 15.5 2.09 Chronic pancreatitis Pyloric, paraaortic 17.0 28.5 2.04 PBC Celiac, celiac, hepatic hilar, hepatic hilar 9.4 12.7 2.34 Hepatitis C Portacaval 15.8 18.4 2.81 Hepatitis C Portacaval 9.2 18.4 2.27 Crohn’s disease Mesenteric 12.9 15.8 2.56 Hepatitis C Celiac, hepatic hilar 9.6 14.4 2.80 Hepatitis B Celiac, hepatic hilar 11.8 17.0 2.76 Hepatitis C Celiac, portacaval, hepatic hilar 10.6 15.3 2.19 Hepatitis C Hepatic 9.1 13.5 2.48
ADC, apparent diffusion coefficient; NASH, nonalcoholic steato hepatitis; SMA, superior mesenteric artery; PBC, primary biliary cirrhosis.
Get Radiology Tree app to read full this article<
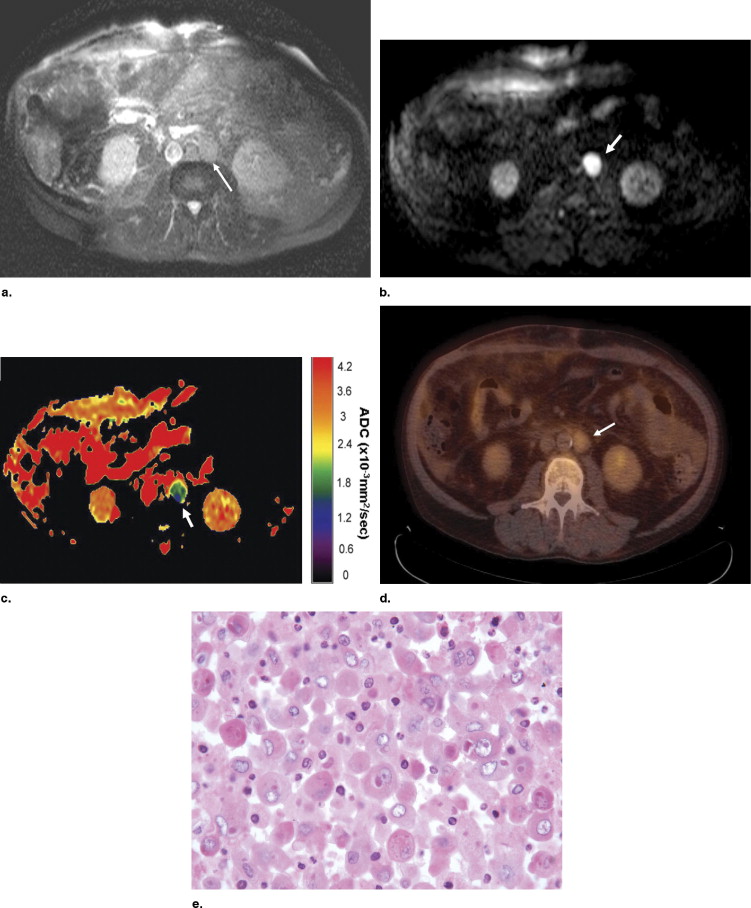
Table 2
Locations, Size, and ADC Value of Malignant Lymph Nodes
Underlying Disease Location Mean Diameter (mm) Mean ADC ⁎ Short Axis Long Axis Esophageal small-cell carcinoma Gastric 21.8 32.2 2.31 Hepatocellular carcinoma Paraaortic, paracaval 19.2 22.8 1.78 Lung cancer (small cell) Paraaortic, juxtaphrenic, left gastric 12.7 14.6 1.66 Cholangiocarcinoma Hepatic hilar 11.6 11.6 1.98 Pancreatic adenocarcinoma Celiac, celiac 12.1 14.9 1.26 Gastrinoma Paraaortic, paraaortic 13.7 15.8 1.44 Pancreatic adenocarcinoma Paraaortic, paraaortic, celiac 8.9 10.2 2.16 Renal cell carcinoma Retrocrural, paraaortic 16.1 19.7 2.13
ADC = apparent diffusion coefficient.
Get Radiology Tree app to read full this article<
Get Radiology Tree app to read full this article<
Get Radiology Tree app to read full this article<
Get Radiology Tree app to read full this article<
Discussion
Get Radiology Tree app to read full this article<
Get Radiology Tree app to read full this article<
Get Radiology Tree app to read full this article<
Get Radiology Tree app to read full this article<
References
1. Chojniak R., Isberner R.K., Viana L.M., et. al.: Computed tomography guided needle biopsy: experience from 1,300 procedures. Sao Paulo Med J 2006; 124: pp. 10-14.
2. Abdel Razek A.A., Soliman N.Y., Elkhamary S., et. al.: Role of diffusion-weighted MR imaging in cervical lymphadenopathy. Eur Radiol 2006; 16: pp. 1468-1477.
3. Yoshikawa T., Kawamitsu H., Mitchell D.G., et. al.: ADC measurement of abdominal organs and lesions using parallel imaging technique. AJR Am J Roentgenol 2006; 187: pp. 1521-1530.
4. Veit P., Ruehm S., Kuehl H., et. al.: Lymph node staging with dual-modality PET/CT: enhancing the diagnostic accuracy in oncology. Eur J Radiol 2006; 58: pp. 383-389.
5. Curvo-Semedo L., Diniz M., Miguéis J., et. al.: USPIO-enhanced magnetic resonance imaging for nodal staging in patients with head and neck cancer. J Magn Reson Imaging 2006; 24: pp. 123-131.
6. Thoeny H.C., De Keyzer F.: Extracranial applications of diffusion-weighted magnetic resonance imaging. Eur Radiol 2007; 17: pp. 1385-1393.
7. Koh D.M., Collins D.J.: Diffusion-weighted MRI in the body: applications and challenges in oncology. AJR Am J Roetgenol 2007; 188: pp. 1622-1635.
8. Low R.N., Gurney J.: Diffusion-weighted MRI (DWI) in the oncology patient: value of breathhold DWI compared to unenhanced and gadolinium-enhanced MRI. J Magn Reson Imaging 2007; 25: pp. 848-858.
9. Ichikawa T., Haradome H., Hachiya J., et. al.: Diffusion-weighted MR imaging with single-shot echo-planar imaging in the upper abdomen: preliminary clinical experience in 61 patients. Abdom Imaging 1999; 24: pp. 456-461.
10. Tsushima Y., Takano A., Taketomi-Takahashi A., et. al.: Body diffusion-weighted MR imaging using high b-value for malignant tumor screening: usefulness and necessity of referring to T2-weighted images and creating fusion images. Acad Radiol 2007; 14: pp. 643-650.
11. Ichikawa T., Erturk S.M., Motosugi U., et. al.: High-b value diffusion-weighted MRI for detecting pancreatic adenocarcinoma: preliminary results. AJR Am J Roentgenol 2007; 188: pp. 409-414.
12. Sumi M., Van Cauteren M., Nakamura T.: MR microimaging of benign and malignant nodes in the neck. AJR Am J Roentgenol 2006; 186: pp. 749-757.