
Rationale and Objectives
To test whether individually measured arterial input function (AIF) provides more accurate prostate cancer diagnosis then population average AIF when dynamic contrast-enhanced (DCE) magnetic resonance imaging (MRI) data are acquired with limited temporal resolution.
Materials and Methods
Twenty-six patients with a high clinical suspicion for prostate caner and no prior treatment underwent DCE MRI examination at 3.0 T before biopsy. DCE MRI data were fitted to a pharmacokinetic model using three forms of AIF: an individually measured, a local population average, and a literature double exponential population average. Receiver operating characteristic (ROC) analysis was used to correlate MRI with the biopsy results. Goodness of fit (χ 2 ) for the three AIFs was compared using nonparametric Mann-Whitney test.
Results
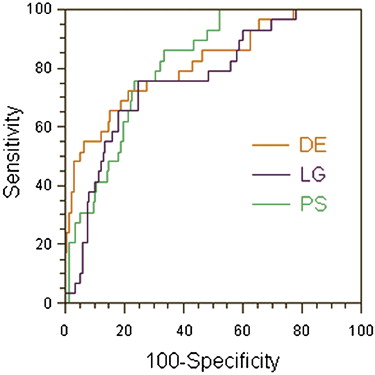
Average volume transfer constant (K trans ) values were significantly higher in tumor than in normal peripheral zone for all three AIFs. The individually measured and the local population average AIFs had the highest sensitivity (76%), whereas the double exponential AIF had the highest specificity (82%). The areas under the ROC curves were not significantly different between any of the AIFs (0.81, 0.76, and 0.81 for the individually measured, local population average, and double exponential AIFs, respectively). χ 2 was not significantly different for the three AIFs; however, it was significantly higher in enhancing than in nonenhancing regions for all three AIFs.
Conclusions
These results suggest that, when DCE MRI data are acquired with limited temporal resolution, experimentally measured individual AIF is not significantly better than population average AIF in predicting the biopsy results in prostate cancer.
Magnetic resonance imaging (MRI) has been used in prostate cancer diagnosis with varying success for more than 20 years . In particular, dynamic contrast enhanced MRI (DCE MRI) is one of the techniques that have shown the potential to provide accurate tumor detection and delineation . In addition, quantitative analysis of T 1 -weighted DCE MRI has been used to study the vascular characteristics of the prostate cancer and their changes after neoadjuvant therapy .
Studies have shown that cancers, principally in the peripheral zone of the prostate gland, enhance more rapidly than normal tissues after administration of a low molecular weight contrast agent . The mechanism of differentiating tumors from normal prostatic tissue with DCE MRI is not entirely clear. Several researchers suggested that the microvessel density plays a decisive role in this mechanism , because the contrast agent uptake in the tissue is dependent on the microvessel density , and microvessel density is a recognized prognostic factor for prostate cancer .
Get Radiology Tree app to read full this article<
Get Radiology Tree app to read full this article<
Materials and methods
Patient Selection and Biopsy
Get Radiology Tree app to read full this article<
Get Radiology Tree app to read full this article<
MRI Examinations
Get Radiology Tree app to read full this article<
Get Radiology Tree app to read full this article<
Data Processing
Get Radiology Tree app to read full this article<
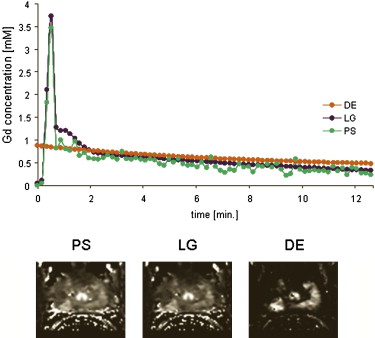
Arterial Input Function
Get Radiology Tree app to read full this article<
Get Radiology Tree app to read full this article<
Statistical Data Analysis
Get Radiology Tree app to read full this article<
Results
Get Radiology Tree app to read full this article<
Get Radiology Tree app to read full this article<
Table 1
Average Values (Mean ± Standard Deviation) of DCE MRI Parameters
PCa PZ K trans (min −1 ) v e v p K trans (min −1 ) v e v p PS 0.16 ± 0.06 ∗ 0.22 ± 0.05 0.01 ± 0.02 0.08 ± 0.06 0.23 ± 0.01 0.02 ± 0.02 LG 0.15 ± 0.07 ∗ 0.20 ± 0.05 0.01 ± 0.02 † 0.09 ± 0.07 0.23 ± 0.10 0.02 ± 0.02 DE 1.86 ± 1.19 ∗ 0.31 ± 0.08 0.02 ± 0.04 ‡ 0.61 ± 0.83 0.30 ± 0.11 0.04 ± 0.03
DCE, dynamic contrast enhanced; MRI, magnetic resonance imaging; PS, patient-specific; LG, local Gaussian; DE, double exponential population average; K trans , volume transfer constant; v e , fractional volume of the extravascular extracellular space; v p , fractional plasma volume; PCa, prostatic adenocarcinoma ( n = 29); PZ, normal peripheral zone ( n = 213).
Get Radiology Tree app to read full this article<
Get Radiology Tree app to read full this article<
Get Radiology Tree app to read full this article<
Get Radiology Tree app to read full this article<
Get Radiology Tree app to read full this article<
Get Radiology Tree app to read full this article<
Get Radiology Tree app to read full this article<
Table 2
Performance Measures for the Three AIFs
PS LG DE Sensitivity 76% (22/29) (68%–82%) 76% (22/29) (68%–82%) 65% (19/29) (58%–73%) Specificity 77% (167/217) (70%–83%) 76% (164/217) (68%–82%) 82% (177/217) (75%–87%) PPV 31% (22/72) (24%–38%) 29% (22/75) (23%–37%) 32% (19/59) (25%–40%) NPV 96% (167/174) (91%–98%) 96% (164/171) (91%–98%) 95% (177/187) (90%–97%) Accuracy 77% (189/246) (69%– 3%) 76% (186/246) (69%–83%) 80% (196/246) (73%–85%)
AIF, arterial input functions; PS, patient-specific AIF; LG, average of individual measured AIFs fitted to double Gaussian plus exponential function; DE, population average double exponential AIF; PPV, positive predictive value; NPV, negative predictive value.
95% confidence intervals are provided in parentheses.
Get Radiology Tree app to read full this article<
Get Radiology Tree app to read full this article<
Get Radiology Tree app to read full this article<
Get Radiology Tree app to read full this article<
Table 3
The Median Values of the Goodness of Fit (χ 2 ) for the Three AIFs
PS LG DE TP 0.2962 (0.1070–0.9060) 0.2470 (0.0795–0.7537) 0.2493 (0.0903–1.4474) TN 0.1764 (0.0390–1.2353) 0.1609 (0.0391–1.2426) 0.1539 (0.0337–1.2359) FP 0.2106 (0.0832–0.9487) 0.2216 (0.0562–0.9952) 0.1823 (0.0395–1.0267) FN 0.1073 (0.0691–0.2736) 0.0750 (0.0529–0.1361) 0.0753 (0.0367–0.5300)
TP, true positives (enhancing regions with positive biopsy); TN, true negatives (nonenhancing regions with negative biopsies); FP, false positives (enhancing regions with negative biopsies); FN, false negatives (nonenhancing regions with positive biopsies); PS, patient-specific AIF; LG, average of individual measured AIFs fitted to double Gaussian plus exponential function; DE, population average double exponential AIF.
Get Radiology Tree app to read full this article<
Discussion
Get Radiology Tree app to read full this article<
Get Radiology Tree app to read full this article<
Get Radiology Tree app to read full this article<
Get Radiology Tree app to read full this article<
Get Radiology Tree app to read full this article<
Get Radiology Tree app to read full this article<
Get Radiology Tree app to read full this article<
Get Radiology Tree app to read full this article<
Get Radiology Tree app to read full this article<
References
1. Hricak H., Dooms G.C., Jeffrey R.B., et. al.: Prostatic carcinoma: staging by clinical assessment, CT and MR imaging. Radiology 1987; 162: pp. 331-336.
2. Barentsz J.O., Engelbrecht M., Jager G.J., et. al.: Fast dynamic gadolinium-enhanced MR imaging of urinary bladder and prostate cancer. J Magn Reson Imaging 1999; 10: pp. 295-304.
3. Buckley D.L., Roberts C., Parker G.J., et. al.: Prostate cancer: evaluation of vascular characteristics with dynamic contrast-enhanced T1-weighted MR imaging—initial experience. Radiology 2004; 233: pp. 709-715.
4. Padhani A.R., MacVicar A.D., Gapinski C.J., et. al.: Effects of androgen deprivation on prostatic morphology and vascular permeability evaluated with MR imaging. Radiology 2001; 218: pp. 265-374.
5. Engelbrecht M.R., Huisman H.J., Laheij R.J., et. al.: Discrimination of prostate cancer from normal peripheral zone and central gland tissue by using dynamic contrast-enhanced MR imaging. Radiology 2003; 229: pp. 248-254.
6. Jager G.J., Ruijter E.T., van de Kaa C.A., et. al.: Dynamic TurboFLASH subtraction technique for contrast-enhanced MR imaging of the prostate: correlation with histopathologic results. Radiology 1997; 203: pp. 645-652.
7. Padhani A.R., Gapinski C.J., Macvicar D.A., et. al.: Dynamic contrast enhanced MRI of prostate cancer: correlation with morphology and tumour stage, histological grade and PSA. Clin Radiol 2000; 55: pp. 99-109.
8. Noworolski S.M., Henry R.G., Vigneron D.B., et. al.: Dynamic contrast-enhanced MRI in normal and abnormal prostate tissues as defined by biopsy, MRI, and 3D MRSI. Magn Reson Med 2005; 53: pp. 249-255.
9. Muramoto S., Uematsu H., Kimura H., et. al.: Differentiation of prostate cancer from benign prostate hypertrophy using dual-echo dynamic contrast MR imaging. Eur J Radiol 2002; 44: pp. 52-58.
10. Choyke P.L., Dwyer A.J., Knopp M.V.: Functional tumor imaging with dynamic contrast-enhanced magnetic resonance imaging. J Magn Reson Imaging 2003; 17: pp. 509-520.
11. Brawer M.K., Deering R.E., Brown M., et. al.: Predictors of pathologic stage in prostatic carcinoma. The role of neovascularity. Cancer 1994; 73: pp. 678-687.
12. Bostwick D.G., Wheeler T.M., Blute M., et. al.: Optimized microvessel density analysis improves prediction of cancer stage from prostate needle biopsies. Urology 1996; 48: pp. 47-57.
13. Rijpkema M., Kaanders J.H., Joosten F.B., et. al.: Method for quantitative mapping of dynamic MRI contrast agent uptake in human tumors. J Magn Reson Imaging 2001; 14: pp. 457-463.
14. Hawighorst H., Knapstein P.G., Weikel W., et. al.: Angiogenesis of uterine cervical carcinoma: characterization by pharmacokinetic magnetic resonance parameters and histological microvessel density with correlation to lymphatic involvement. Cancer Res 1997; 57: pp. 4777-4786.
15. Hawighorst H., Knopp M.V., Debus J., et. al.: Pharmacokinetic MRI for assessment of malignant glioma response to stereotactic radiotherapy: initial results. J Magn Reson Imaging 1998; 8: pp. 783-788.
16. Evelhoch J.L.: Key factors in the acquisition of contrast kinetic data for oncology. J Magn Reson Imaging 1999; 10: pp. 254-259.
17. Parker G.J., Padhani A.R.: T1-weighted dynamic contrast enhanced MRI.Tofts P.S.Quantitative MRI of the brain-measuring changes caused by disease.2003.John Wiley and Sons LtdChichester, UK:pp. 341-364.
18. Tofts P.S., Berkowitz B., Schnall M.D.: Quantitative analysis of dynamic Gd-DTPA enhancement in breast tumors using a permeability model. Magn Reson Med 1995; 33: pp. 564-568.
19. Parker G.J., Roberts C., Macdonald A., et. al.: Experimentally-derived functional form for a population-averaged high-temporal-resolution arterial input function for dynamic contrast-enhanced MRI. Magn Reson Med 2006; 56: pp. 993-1000.
20. Parker G.J., Suckling J., Tanner S.F., et. al.: Probing tumor microvascularity by measurement, analysis and display of contrast agent uptake kinetics. J Magn Reson Imaging 1997; 7: pp. 564-574.
21. Tofts P.S., Brix G., Buckley D.L., et. al.: Estimating kinetic parameters from dynamic contrast-enhanced T(1)-weighted MRI of a diffusable tracer: standardized quantities and symbols. J Magn Reson Imaging 1999; 10: pp. 223-232.
22. Kozlowski P., Chang S.D., Jones E.C., et. al.: Combined diffusion-weighted and dynamic contrast-enhanced MRI for prostate cancer diagnosis—correlation with biopsy and histopathology. J Magn Reson Imaging 2006; 24: pp. 108-113.
23. Mould R.F.: Sensitivity and specificity. Introductory medical statistics.1998.Institute of Physics PublishingBristol, UK 232–233
24. Newcombe R.G.: Two-sided confidence intervals for the single proportion: comparison of seven methods. Stat Med 2008; 17: pp. 857-872.
25. DeLong E.R., DeLong D.M., Clarke-Pearson D.L.: Comparing the areas under two or more correlated receiver operating characteristics curves: a nonparametric approach. Biometrics 1988; 44: pp. 837-845.
26. Inaba T.: Quantitative measurements of prostatic blood flow and blood volume by positron emission tomography. J Urol 1992; 148: pp. 1457-1460.
27. McGrath D.M., Bradley D.P., Tessier J.L., et. al.: Comparison of model-based arterial input functions for dynamic contrast-enhanced MRI in tumor bearing rats. Magn Reson Med 2009; 61: pp. 1173-1184.
28. Haider M.A., Chung P., Sweet J., et. al.: Dynamic contrast-enhanced magnetic resonance imaging for localization of recurrent prostate cancer after external beam radiotherapy. Int J Radiat Oncol Biol Phys 2008; 70: pp. 425-430.
29. Hara N., Okuizumi M., Koike H., et. al.: Dynamic contrast-enhanced magnetic resonance imaging (DCE-MRI) is a useful modality for the precise detection and staging of early prostate cancer. Prostate 2005; 62: pp. 140-147.
30. Langer D.L., van der Kwast T.H., Evans A.J., et. al.: Prostate cancer detection with multi-parametric MRI: logistic regression analysis of quantitative T2, diffusion-weighted imaging, and dynamic contrast-enhanced MRI. J Magn Reson Imaging 2009; 30: pp. 327-334.