
Rationale and Objectives
The ability to perform cerebral perfusion imaging (CPI) in the angiography suite has provided a new tool for diagnosis and treatment of neurovascular patients but requires comparable contrast perfusion to each cerebral hemisphere. In the angiography suite, contrast injection may be performed via an intra-arterial or intravenous (IV) route. The purpose of this study was to investigate whether a difference exists between contrast injection in the aortic arch (AA) and a peripheral vein (IV), particularly in the setting of stroke.
Materials and Methods
Using three canines, both AA and IV injection protocols compatible with CPI were performed prospectively at three time points after creation of a stroke. The common carotid arteries in the resulting image data sets were segmented and the means and distributions of corresponding pixel intensities analyzed with Student’s t -test. Using similar techniques, the internal carotid arteries of three patients (one female, two males, ages 69, 29, and 20) undergoing AA contrast injection with cone beam computed tomography (CBCT) cerebral imaging were analyzed and compared retrospectively with those of three random patients (one female, two males, ages 19, 57, and 35) undergoing standard head CT scans using IV contrast administration. All acquisitions followed institutionally approved protocols and informed consent.
Results
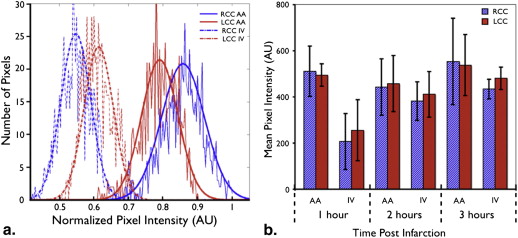
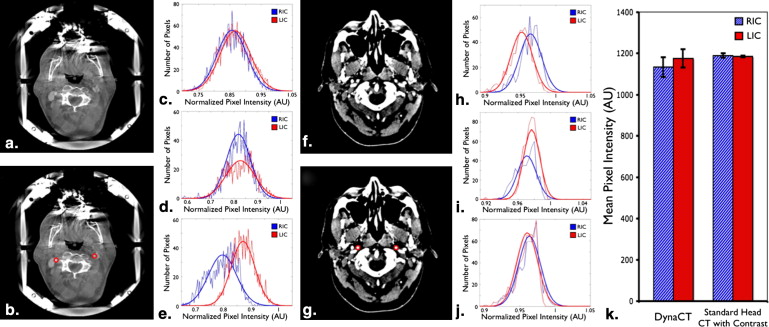
No statistical significance ( P < .05) was found when mean values for the right and left carotid artery pixel intensities were compared in the canine model or the clinical studies in which patients underwent imaging after AA or IV contrast administration.
Conclusions
No statistically significant difference exists between right and left carotid artery filling density using either AA or IV contrast injection methods, making both suitable for CPI in the angiography suite.
Conventional digital subtraction angiography (DSA) highlights abnormalities in vascular anatomy that may be pathologic, whereas advances in technology and medical knowledge have led to the development of imaging techniques that yield clinically useful physiologic information . Examples of the latter include positron emission tomography, functional magnetic resonance imaging (fMRI), and perfusion computed tomography (CT). In cerebral perfusion imaging (CPI), measurements of cerebral blood volume (CBV), mean transit time (MTT), and cerebral blood flow (CBF) make up parameters used to describe the physiologic tissue perfusion of the brain. Such information is very helpful in assessing patients suffering acute stroke, vasospasm, and intracranial tumors . In fact, perfusion CT and perfusion MRI techniques are being considered as tools to extend the window for thrombolysis in acute stroke .
There exist several endovascular treatment options for acute stroke in the angiography suite, including intra-arterial (IA) thrombolysis and mechanical embolectomy . With these treatment methods available in the angiography suite and the strong inverse correlation between time to treatment and good outcomes, clearly it would be advantageous to have the multimodal imaging capabilities for stroke work up in the same room where therapy can take place. With the advent of Food and Drug Administration–approved C-arm-mounted flat-panel detectors in angiography suites (Artis zee biplane, Siemens Healthcare, Germany), the ability to acquire three-dimensional cone beam computed tomography (CBCT) images in addition to traditional angiographic images from standard C-arm systems inside the angiography suite is now being incorporated into routine angiography protocols . These systems are capable of producing CBV maps in ischemic stroke models comparable to conventional perfusion CT and, with some alterations to image acquisition protocols, are even able to provide comparable temporal MTT and CBF information .
Get Radiology Tree app to read full this article<
Materials and methods
Canine Model
Get Radiology Tree app to read full this article<
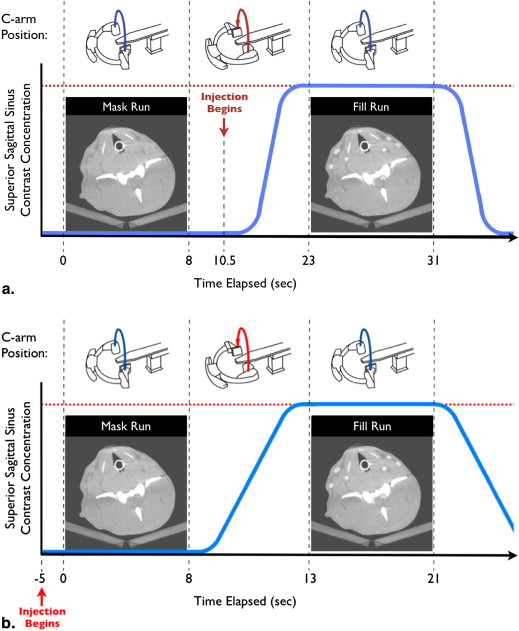
Canine CBCT Image Acquisition
Get Radiology Tree app to read full this article<
Get Radiology Tree app to read full this article<
Get Radiology Tree app to read full this article<
Get Radiology Tree app to read full this article<
Human CBCT Image Acquisition
Get Radiology Tree app to read full this article<
Get Radiology Tree app to read full this article<
Human Standard Head CT with Contrast
Get Radiology Tree app to read full this article<
Image Analysis
Get Radiology Tree app to read full this article<
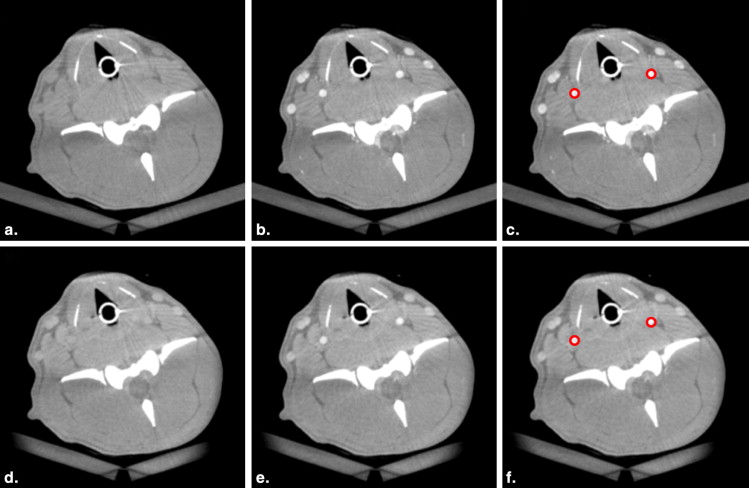
Table 1
Segmented Mean Data, Percentage Differences, and P Values for Three Canine Stroke Models at Different Time Points after Infarction
Mean(SD−standarddeviation)[n−numberofpixels/animals] Mean
(
SD
−
standard
deviation
)
[
n
−
number
of
pixels
/
animals
] Time after infarction 1 hour 2 hours 3 hours Contrast route AA IV AA IV AA IV Canine 1 RCC 431 (28.8) [851] 101 (28.9) [825] 344 (36.0) [892] 328 (51.8) [789] 407 (36.9) [899] 399 (41.5) [899] LCC 449 (37.2) [851] 123 (21.8) [785] 355 (33.6) [756] 337 (42.4) [893] 437 (33.6) [957] 438 (34.8) [899] % difference 4.17 20.0 3.15 2.85 7.17 9.34 Canine 2 RCC 620 (55.0) [740] 316 (49.4) [777] 522 (44.9) [740] 389 (33.8) [740] 726 (52.6) [777] 463 (36.2) [740] LCC 533 (53.5) [740] 335 (36.8) [777] 509 (34.0) [740] 430 (29.0) [740] 669 (44.4) [777] 519 (35.7) [740] % difference 15.0 6.03 2.5 10.1 8.17 11.3 Canine 3 RCC 495 (59.3) [724] 212 (57.7) [491] 538 (34.6) [315] 475 (90.8) [402] 487 (28.1) [348] 464 (48.1) [340] LCC 508 (38.3) [820] 315 (74.7) [693] 563 (24.5) [378] 512 (76.8) [527] 528 (26.0) [464] 501 (54.4) [525] % difference 2.65 39.0 4.45 7.40 7.89 7.63 Average RCC 511 (96.1) [3] 207 (108) [3] 443 (108) [3] 382 (74.0) [3] 554 (166) [3] 434 (37.4) [3] LCC 495 (43.1) [3] 255 (117) [3] 458 (108) [3] 412 (87.2) [3] 538 (117) [3] 481 (42.5) [3]P value .78 .63 .93 .68 .97 .25
AA, aortic arch; IV, intravenous; LCC, left common carotid artery; RCC, right common carotid artery.
Table 2
Segmented Mean Data for Patients Imaged Using C-arm CBCT and Standard Head CT with Contrast
Mean(SD−standarddeviation)[n−numberofpixels/animals] Mean
(
SD
−
standard
deviation
)
[
n
−
number
of
pixels
/
animals
] C-arm CBCT Standard Head CT with Contrast (AA Injection) (IV Injection) Patient 1 RIC 1120 (61.1) [1947] 1200 (19.4) [513] LIC 1130 (63.4) [1966] 1180 (19.0) [537] % difference 13.5 9.33 Patient 2 RIC 1180 (74.4) [1457] 1180 (14.0) [430] LIC 1190 (89.6) [1209] 1190 (12.0) [578] % difference 7.20 4.49 Patient 3 RIC 1100 (70.5) [1335] 1190 (18.9) [671] LIC 1200 (59.3) [1527] 1190 (18.2) [671] % difference 8.03 2.33 Average RIC 1133 (42.0) [3] 1190 (10.0) [3] LIC 1176 (38.8) [3] 1186 (3.5) [3]P value .29 .65
AA, aortic arch; IV, intravenous; LIC, left internal carotid artery; RIC, right internal carotid artery.
Get Radiology Tree app to read full this article<
Results
Get Radiology Tree app to read full this article<
Get Radiology Tree app to read full this article<
Get Radiology Tree app to read full this article<
Get Radiology Tree app to read full this article<
Discussion
Get Radiology Tree app to read full this article<
Get Radiology Tree app to read full this article<
Get Radiology Tree app to read full this article<
Get Radiology Tree app to read full this article<
Get Radiology Tree app to read full this article<
Get Radiology Tree app to read full this article<
Get Radiology Tree app to read full this article<
Get Radiology Tree app to read full this article<
Get Radiology Tree app to read full this article<
Get Radiology Tree app to read full this article<
Conclusion
Get Radiology Tree app to read full this article<
Acknowledgments
Get Radiology Tree app to read full this article<
Appendix A
Get Radiology Tree app to read full this article<
References
1. Wintermark M., Sesay M., Barbier E., et. al.: Comparative overview of brain perfusion imaging techniques. Stroke 2005; 36: pp. e83-e99.
2. Hoeffner E.G., Case I., Jain R., et. al.: Cerebral perfusion CT: technique and clinical applications. Radiology 2004; 231: pp. 632-644.
3. Logothetis N.K.: What we can do and what we cannot do with fMRI. Nature 2008; 453: pp. 869-878.
4. Hacke W., Furlan A.J., Al-Rawi Y., et. al.: Intravenous desmoteplase in patients with acute ischaemic stroke selected by MRI perfusion-diffusion weighted imaging or perfusion CT (DIAS-2): a prospective, randomized, double-blind, placebo-controlled study. Lancet Neurol 2009; 8: pp. 141-150.
5. Gandhi C.D., Christiano L.D., Prestigiacomo C.J.: Endovascular management of acute ischemic stroke. Neurosurg Focus 2009; 26: pp. E2.
6. Smith W.S., Sung G., Starkman S., et. al.: Safety and efficacy of mechanical embolectomy in acute ischemic stroke: results of the MERCI trial. Stroke 2005; 36: pp. 1432-1438.
7. Yoo A.J., Frei D., Tateshima S., et. al.: The Penumbra Stroke System: a technical review. J NeuroIntervent Surg 2012; 4: pp. 199-205.
8. Zellerhoff M., Scholz B., Ruhrnschopf E.P., et. al.: Low contrast 3D-reconstruction from C-arm data. Proc SPIE 2005; 5745: pp. 646-655.
9. Heran N.S., Song J.K., Namba K., et. al.: The utility of DynaCT in neuroendovascular procedures. AJNR Am J Neuroradiol 2006; 27: pp. 330-332.
10. Benndorf G., Strother C.M., Claus B., et. al.: Angiographic CT in cerebrovascular stenting. AJNR Am J Neuroradiol 2005; 26: pp. 1813-1818.
11. Ahmed A.S., Zellerhoff M., Strother C.M., et. al.: C-arm CT measurement of cerebral blood volume: an experimental study in canines. AJNR Am J Neuroradiol 2009; 30: pp. 917-922.
12. Bley T., Strother C.M., Pulfer K., et. al.: C-arm CT measurements of cerebral blood volume in ischemic stroke: an experimental study in canines. AJNR Am J Neuroradiol 2010; 31: pp. 536-540.
13. Ganguly A., Fieselmann A., Marks M., et. al.: Cerebral CT perfusion using an interventional C-arm imaging system: cerebral blood flow measurements. AJNR Am J Neuroradiol 2011; 32: pp. 1525-1531.
14. Bae K.T.: Intravenous contrast medium administration and scan timing at CT: considerations and approaches. Radiology 2010; 256: pp. 32-61.
15. Radvany M.G., Ehtiati T., Huang J., et. al.: Aortic arch injection with C-arm cone beam CT for radiosurgery treatment planning of cerebral arteriovenous malformations: technical note. J NeuroIntervent Surg 2012; 4: pp. e28.
16. Seg3D: Volumetric Image Segmentation and Visualization [Internet]. Salt Lake City (Utah): Scientific Computing and Imaging Institute. Available from: http://www.sed3d.org . Accessed October 15, 2011.
17. Bae K.T.: Peak contrast enhancement in CT and MR angiography: when does it occur and why? Pharmacokinetic study in a porcine model. Radiology 2003; 227: pp. 809-816.
18. Kurzweg U.H., Howell G., Jaeger M.J.: Enhanced dispersion in oscillatory flows. Phys Fluids 1984; 27: pp. 1046-1048.
19. Hendrikse J., van Raamt A.F., van der Graaf Y., et. al.: Distribution of cerebral blood flow in the Circle of Willis. Radiology 2005; 235: pp. 184-189.
20. Alnaes M.S., Isaksen J., Mardal K.A., et. al.: Computation of hemodynamics in the Circle of Willis. Stroke 2007; 38: pp. 2500-2505.
21. Kerber C.W., Liepsch D.: Flow dynamics for radiologists II. Practical considerations in the live human. AJNR Am J Neuroradiol 1994; 15: pp. 1076-1086.
22. Lieber B.B., Sadasivan C., Hao Q., et. al.: The mixability of angiographic contrast with arterial blood. Med Phys 2009; 36: pp. 5064-5078.
23. Yasuda R., Royalty K., Puffer K., et. al.: C-Arm CT measurement of cerebral blood volume using intra-arterial injection of contrast medium: An experimental study in canines. AJNR Am J Neuroradiol 2012; 33: pp. 1696-1701.
24. Mabon R.F., Soder P.D., Carpenter W.A., et. al.: Fluid dynamics in cerebral angiography. Radiology 1978; 128: pp. 669-676.
25. Revuelta A., Martinez-Bazan C., Sanchez A.L., et. al.: Laminar Craya-Curtet jets. Phys Fluids 2004; 16: pp. 208-211.
26. Barrett J., Keat N.: Artifacts in CT: recognition and avoidance. RadioGraphics 2004; 24: pp. 1679-1691.