
Rationale and Objectives
To compare initial evaluations of chest dual-energy subtraction digital tomosynthesis (DES-DT) and dual-energy subtraction radiography (DES-R) for detection of pulmonary nodules.
Materials and Methods
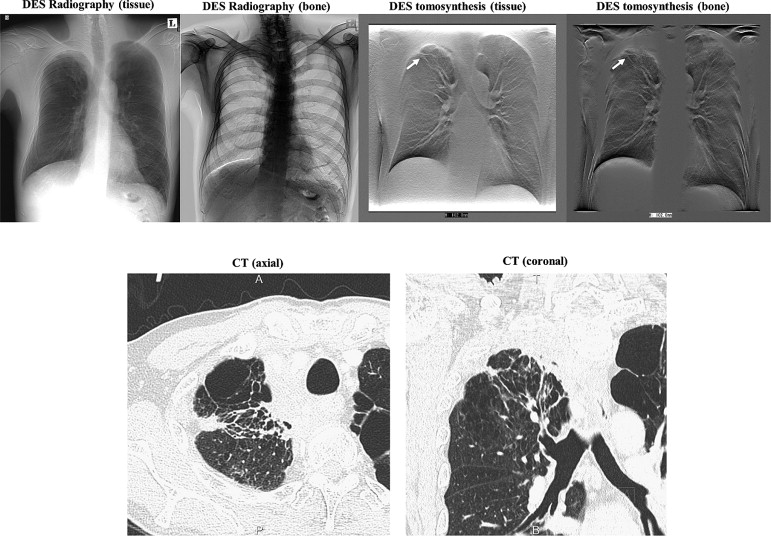
DES-DT and DES-R systems with pulsed x-rays and rapid kV switching were used to evaluate pulmonary nodules (>4–6 mm, 2 nodules; >6–8 mm, 2 nodules; >8 mm, 32 nodules). Multidetector computed tomography was used as a reference. A filtered back-projection algorithm was used to reconstruct low-voltage (60 kVp), high-voltage (120 kVp), and soft-tissue or bone-subtracted tomograms of the desired layer thicknesses from the image data acquired during a single tomographic scan. DES-R images were processed from the low- and high-voltage images. To detect the pulmonary nodules, we used both systems to examine 36 patients with and 36 patients without pulmonary nodules. Two radiologists and three doctors of pulmonary medicine (average experience, 18 years) performed receiver operating characteristic (ROC) curve analysis to evaluate the results.
Results
The ROC analysis results suggested that the detection ability was significantly better for DES-DT than for DES-R ( P < .0001; 95% confidence interval: DES-DT, 0.94 [0.83–0.99]; DES-R, 0.76 [0.68–0.85]; sensitivity: DES-DT, 87.7 ± 2.9%; DES-R, 53.8 ± 3.5%; specificity: DES-DT, 78.3 ± 5.6%; DES-R, 78.4 ± 3.4%; accuracy: DES-DT, 83.1 ± 3.8%, DES-R, 66.1 ± 2.0%). When the nodules were no longer superimposed over the normal structures, their characteristics and distribution could be observed much more clearly.
Conclusion
Compared with DES-R, DES-DT provided greater sensitivity for detection of pulmonary nodules, particularly for the larger ones.
Lung cancer is currently the primary cause of cancer death, and the incidence continues to increase worldwide. Because of its high sensitivity, normal-dose helical computed tomography (CT) is currently considered the gold standard for lung cancer detection. Previous studies have shown that low-dose helical CT could detect early-stage lung cancer, thereby decreasing morbidity . CT is advantageous because it is not susceptible to the problem of reduced accuracy resulting from overlapping anatomy. However, CT has disadvantages, such as higher radiation doses and costs compared with chest radiography. The advantages of chest radiography include short examination time, low cost, and easy access; however, low sensitivity and specificity are its main disadvantages. In chest radiography, a three-dimensional view of the chest is projected onto a two-dimensional image; therefore, for many analyses, detection of pathological findings is limited by overlapping anatomy rather than quantum noise. Chest radiography has been shown to have relatively low sensitivity for detection of pulmonary nodules. This poor sensitivity precludes its use as a screening method despite its low cost, low dose, and the widespread availability of radiographic devices.
Digital tomosynthesis (DT) imaging has been shown to provide greater contrast than radiography for images of similarly sized nodules. Three recent studies found that the detectability of pulmonary nodules was considerably higher with chest DT than with chest radiography; in one report, sensitivity was found to be increased, particularly for nodules smaller than 9 mm . Another study reported that DT is an advantageous technique for detecting pulmonary nodules . DT was also shown to have considerably improved sensitivity for detection of known small lung nodules in three size groups (<5, 5–10, and >10 mm) relative to that of chest radiography . According to these reports, DT was better than radiography for detection of lung nodules.
Get Radiology Tree app to read full this article<
Get Radiology Tree app to read full this article<
Get Radiology Tree app to read full this article<
Materials and methods
DES-DT and DES-R Systems
Get Radiology Tree app to read full this article<
Get Radiology Tree app to read full this article<
Reference Method
Get Radiology Tree app to read full this article<
Table 1
Pattern of Lesion
Diagnosis_n_ Mean Size (mm) ± SE Adenocarcinoma 22 14.4 ± 1.7 Squamous cell carcinoma 2 23.3 ± 11.8 Non–small-cell carcinoma 1 10.3 ∗ Small-cell carcinoma 4 16.4 ± 2.2 Tuberculosis 2 10.5 ± 1.7 Bronchioalveolar carcinoma 1 15.8 ∗ Mycobacterium avium complex 1 43.6 ∗ Metastasis from liver angiosarcoma 1 17.2 ∗ Inflammatory reactive change 1 7.9 ∗ Metastatic carcinoma from breast Cancer 1 27.8 ∗
SE, standard error.
Get Radiology Tree app to read full this article<
Get Radiology Tree app to read full this article<
Detection Study
Get Radiology Tree app to read full this article<
Statistical Analysis
Get Radiology Tree app to read full this article<
Results
Get Radiology Tree app to read full this article<
Get Radiology Tree app to read full this article<
Get Radiology Tree app to read full this article<
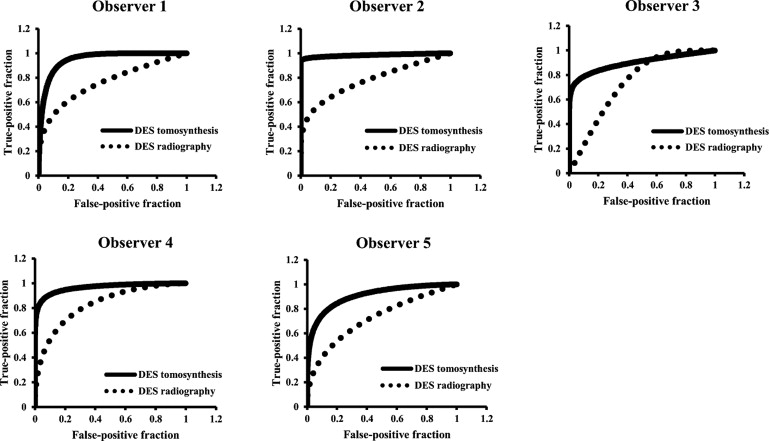
Table 2
AUC in ROCs for Each Modality and Observer
Observer AUC in ROC DES-DT DES-R_P_ ∗ 1 0.95 0.75 2 0.98 0.78 3 0.90 0.74 4 0.96 0.83 5 0.90 0.73 Average (95% CI) 0.94 (0.83–0.99) 0.76 (0.68–0.85) <.0001
AUC, area under the receiver operating characteristic (ROC) curve; CI, confidence interval; DES-DT, dual-energy subtraction digital tomosynthesis; DES-R, dual-energy subtraction radiography.
Get Radiology Tree app to read full this article<
Get Radiology Tree app to read full this article<
Get Radiology Tree app to read full this article<
Table 3
Diagnostic Performance and Confidence
DES-DT DES-R Observer 1 Sensitivity (%) 91.66 55.55 Specificity (%) 77.77 75.00 Accuracy (%) 84.72 65.27 Diagnostic confidence: Number TP TN FP FN Number TP TN FP FN Score 0–10 28 26 2 24 23 1 Score 11–20 5 2 3 8 4 4 Score 21–30 4 1 3 5 1 4 Score 31–40 9 8 1 14 7 7 Score 41–50 26 25 1 21 13 8 Observer 2 Sensitivity (%) 91.66 41.66 Specificity (%) 100.00 88.88 Accuracy (%) 95.83 65.27 Diagnostic confidence: Number TP TN FP FN Number TP TN FP FN Score 0–10 33 33 32 32 Score 11–20 3 3 2 2 2 Score 21–30 1 1 7 5 2 Score 31–40 4 4 3 2 1 Score 41–50 31 29 2 28 13 15 Observer 3 Sensitivity (%) 80.55 52.77 Specificity (%) 69.44 69.44 Accuracy (%) 75.00 61.11 Diagnostic confidence: Number TP TN FP FN Number TP TN FP FN Score 0–10 25 23 2 29 23 6 Score 11–20 7 2 5 5 2 3 Score 21–30 5 1 4 5 3 2 Score 31–40 3 1 2 5 2 3 Score 41–50 32 28 4 28 17 11 Observer 4 Sensitivity (%) 94.44 63.88 Specificity (%) 75.00 83.33 Accuracy (%) 84.72 73.61 Diagnostic confidence: Number TP TN FP FN Number TP TN FP FN Score 0–10 23 22 1 31 29 2 Score 11–20 11 5 6 4 1 3 Score 21–30 3 1 2 3 2 1 Score 31–40 1 1 6 5 1 Score 41–50 34 33 1 28 18 10 Observer 5 Sensitivity (%) 80.55 55.55 Specificity (%) 69.44 75.00 Accuracy (%) 75.00 65.27 Diagnostic confidence: Number TP TN FP FN Number TP TN FP FN Score 0–10 23 22 1 28 23 5 Score 11–20 12 3 9 7 4 3 Score 21–30 2 1 1 1 1 Score 31–40 7 5 2 13 8 5 Score 41–50 28 24 4 23 12 11
DES-DT, dual-energy subtraction digital tomosynthesis; DES-R, dual-energy subtraction radiography; FN, false negative; FP, false positive; TN, true negative; TP, true positive.
Get Radiology Tree app to read full this article<
Get Radiology Tree app to read full this article<
Table 4
Subgroup Analysis of the Sensitivity (%) by the Size of the Nodules
Nodule Size ≦4 mm ( n = 0) >4–6 mm ( n = 2) >6–8 mm ( n = 2) >8 mm ( n = 32) Total ( n = 36) DES-DT Observer 1 — 50 100 93.75 81.25 Observer 2 — 50 100 96.75 81.25 Observer 3 — 50 100 81.25 77.08 Observer 4 — 50 100 93.75 81.25 Observer 5 — 50 100 81.25 77.08 Average — 50 100 88.75 79.58 DES-R Observer 1 — 50 50 56.25 52.08 Observer 2 — 50 50 40.62 46.87 Observer 3 — 50 50 50 50 Observer 4 — 50 100 62.5 70.83 Observer 5 — 100 50 53.12 67.70 Average — 60 60 52.5 57.5
DES-DT, dual-energy subtraction digital tomosynthesis; DES-R, dual-energy subtraction radiography.
Get Radiology Tree app to read full this article<
Discussion
Get Radiology Tree app to read full this article<
Get Radiology Tree app to read full this article<
Get Radiology Tree app to read full this article<
Get Radiology Tree app to read full this article<
Get Radiology Tree app to read full this article<
Get Radiology Tree app to read full this article<
Get Radiology Tree app to read full this article<
Get Radiology Tree app to read full this article<
Get Radiology Tree app to read full this article<
Acknowledgments
Get Radiology Tree app to read full this article<
Get Radiology Tree app to read full this article<
References
1. Yankelevitz D.F., Reeves A.P., Kostis W.J., et. al.: Small pulmonary nodules: volumetrically determined growth rates based on CT evaluation. Radiology 2000; 217: pp. 251-256.
2. Vikgren J., Zachrisson S., Svalkvist A., et. al.: Comparison of chest tomosynthesis and chest radiography for detection of pulmonary nodules: human observer study of clinical cases. Radiology 2008; 217: pp. 251-256.
3. Zachrisson S., Vikgren J., Svalkvist A., et. al.: Effect of clinical experience of chest tomosynthesis on detection of pulmonary nodules. Acta Radiologica 2009; 50: pp. 884-891.
4. James T.D., Mcadams H.P., Song J.W., et. al.: Digital tomosynthesis of the chest for lung nodule detection: interim sensitivity results from an ongoing NIH-sponsored trial. Med Phys 2008; 35: pp. 2554-2557.
5. Godwin J.D.: The solitary pulmonary nodule. Radiol Clin North Am 1983; 21: pp. 709-721.
6. Littleton J.T.: Pluridirectional tomography in diagnosis and management of early bronchogenic carcinoma.Littleton J.T.Sectional imaging methods. A comparison.1983.University Park PressBaltimore, MD:pp. 155-173.
7. Siegelman S.S., Khouri N.F., Leo F.P., et. al.: Solitary pulmonary nodules. CT assessment. Radiology 1986; 160: pp. 307-312.
8. Siegelman S.S., Zerhouni E.A., Loe F.P., et. al.: CT of the solitary pulmonary nodule. AJR Am J Roentgenol 1980; 135: pp. 1-13.
9. Fraser R.G., Hickey N.M., Niklason L.T., et. al.: Calcification in pulmonary nodules. Detection with dual-energy digital radiography. Radiology 1986; 160: pp. 595-601.
10. McLendon R.E., Roggli V.L., Foster W.L., et. al.: Carcinoma of the lung with osseous stromal metaplasia. Arch Pathol Lab Med 1985; 109: pp. 1051-1053.
11. Brody W.R., Butt G., Hall A., et. al.: A method for selective tissue and bone visualization using dual-energy scanned projection radiography. Med Phys 1981; 8: pp. 659-667.
12. Zerhouni E.A., Caskey C., Khouri N.F.: The pulmonary nodules. Semin Ultrasound CT MR 1988; 9: pp. 67-78.
13. Hickey N.M., Niklason L.T., Sabbagh E., et. al.: Dual-energy digital radiographic quantification of calcium in simulated pulmonary nodules. AJR Am J Roentgenol 1987; 148: pp. 19-24.
14. Ishigaki T., Sakuma S., Horikawa Y., et. al.: One-shot dual-energy subtraction imaging. Radiology 1986; 161: pp. 271-273.
15. Ishigaki T., Sakuma S., Ikeda M.: One-shot dual-energy subtraction chest imaging with computed radiography. Radiology 1988; 168: pp. 67-72.
16. Nishitani H., Umezu Y., Ogawa K., et. al.: Dual-energy projection radiography using condenser X-ray generator and digital radiography apparatus. Radiology 1986; 161: pp. 533-535.
17. Gomi T., Nakajima M., Fujiwara H., et. al.: Comparison of chest dual-energy subtraction digital tomosynthesis imaging and dual-energy subtraction radiography to detect simulated pulmonary nodules with and without calcifications. Acad Radiol 2011; 18: pp. 191-196.
18. Gomi T., Hirano H.: Clinical potential of digital linear tomosynthesis imaging of total joint arthroplasty. J Digit Imaging 2008; 21: pp. 312-322.
19. MacMahon H., Austin J.H., Gamsu G., et. al.: Guidelines for management of small pulmonary nodules detected on CT scans: a statement from the Fleischner Society. Radiology 2005; 237: pp. 2313-2330.
20. Derbaum K. DBM MRMC software 2.2. Available at: http://perception.radiology.uiowa.edu . Accessed January 7, 2009.
21. Hanley J.A., McNeil B.J.: The meaning and use of the area under receiver operating characteristic (ROC) curves. Radiology 1982; 143: pp. 29-36.
22. Hanley J.A., McNeil B.J.: A method of comparing the areas under receiver operating characteristic curves derived from the same cases. Radiology 1983; 148: pp. 839-843.
23. Gomi T., Nakajima M., Fujiwara H., et. al.: Comparison between chest digital tomosynthesis and CT as a screening method to detect artificial pulmonary nodules: a phantom study. Br J Radiol 2012; 85: pp. e622-e629.
24. Valencia R., Denecke T., Lehmkuhl L., et. al.: Value of axial and coronal maximum intensity projection (MIP) images in the detection of pulmonary nodules by multislice spiral CT: comparison with axial 1-mm and 5-mm slices. Eur Radiol 2006; 16: pp. 325-332.
25. Peloschek P., Sailer J., Weber M., et. al.: Pulmonary nodules: sensitivity of maximum intensity projection versus that of volume rendering of 3D multidetector CT data. Radiology 2007; 243: pp. 561-569.