
Rationale and Objectives
Delayed cerebral ischemia (DCI) is a devastating condition that occurs secondary to aneurysmal subarachnoid hemorrhage (A-SAH). The purpose is to compare computed tomography perfusion (CTP) and digital subtraction angiography (DSA) for determining DCI in A-SAH.
Materials and Methods
A retrospective study of A-SAH patients admitted at our institution between December 2004 and December 2008 was performed. CTP and DSA were obtained at days 6–8 after aneurysm rupture. Both qualitative and quantitative analyses of CT perfusion deficits were performed. DSA was categorized as presence or absence of vasospasm. The reference standard for determining DCI was based on clinical deterioration or infarction on CT or MRI. The test characteristics of CTP and DSA were calculated and their graphs of conditional probabilities were constructed using Bayesian analysis.
Results
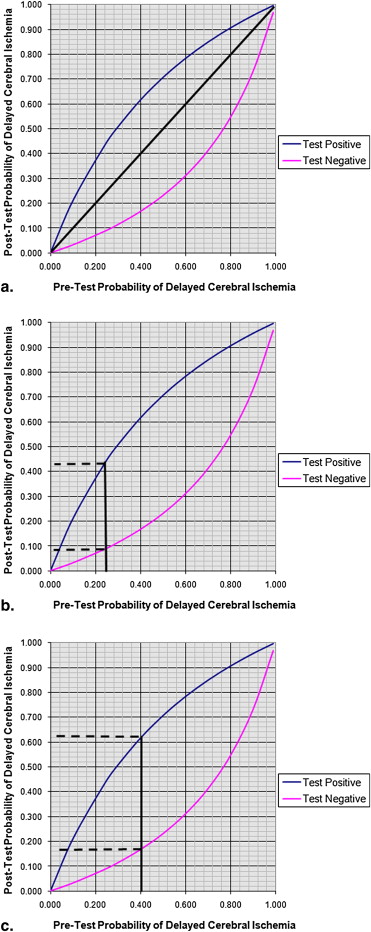
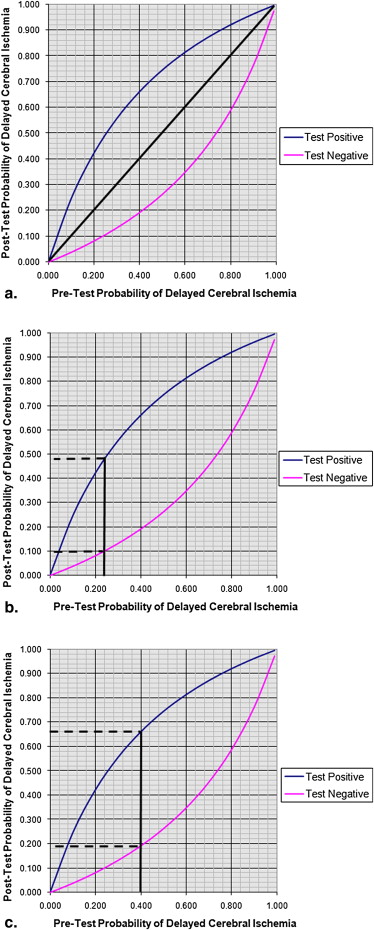
Fifty-seven patients were included; 79% (45/57) had DCI. Seventy percent (40/57) had CTP perfusion deficits; 80% (36/45) of the DCI and 33% (4/12) of no DCI patients. Sixty-three percent (36/57) had DSA demonstrating vasospasm; 73% (33/45) of the DCI and 25% (3/12) of no DCI patients. Quantitative analysis of the CTP data revealed a significant difference in cerebral blood flow values for the DCI (29.4 mL/100 g/minute) and no DCI groups (40.5 mL/100 g/minute, P = .0213). The sensitivity, specificity, and positive and negative predictive values for CTP were 0.80 (95% CI 0.68–0.92), 0.67 (95% CI 0.40–0.93), 0.90 (95% CI 0.82–0.96), 0.47 (95% CI 0.27–0.62), and for DSA were 0.73 (95% CI 0.60–0.86), 0.75 (95% CI 0.50–0.99), 0.92 (95% CI 0.82–0.98), and 0.43 (95% CI 0.26–0.53), respectively.
Conclusion
CTP and DSA have similar test characteristics and Bayesian analysis for determining DCI in A-SAH patients.
Cerebral vasospasm is a significant cause of morbidity in patients with aneurysmal subarachnoid hemorrhage (A-SAH), occurring in 20%–50% of patients after successful surgical or endovascular treatment of the ruptured aneurysm . Several terms have been used in the literature to describe this entity, including symptomatic vasospasm, angiographic vasospasm, transcranial Doppler vasospasm, and delayed cerebral ischemia (DCI). In the past, the gold standard for vasospasm has been accepted as arterial narrowing documented on digital subtraction angiography (DSA). However, the presence of angiographic vasospasm does not always correlate with neurological deterioration or the development of infarction .
Conversely, DCI has been shown to be the most clinically relevant term because of its strong associations with poor clinical outcome measures such as cognitive impairment and reduced quality of life . DCI is defined as an otherwise unexplained clinical deterioration and/or new infarction demonstrated on imaging examinations. Clinical deterioration may manifest by alterations in consciousness, worsening on Glasgow coma scale, or new neurologic deficits. Other potential causes of clinical deterioration, such as hemorrhage, seizure activity, or hydrocephalus, are not included in this definition. The second component of DCI is the presence of a new infarction documented on imaging examinations. This definition does not include infarctions present on the admission or the immediate postoperative imaging exams . An important limitation to using this definition in clinical practice is that the diagnosis of DCI is retrospectively obtained once a neurologic deficit or infarction has already occurred. As a result, interventions to reduce the subsequent morbidity and mortality may have limited usefulness . It has also been reported that the presence of DCI is associated with a more complicated hospital course resulting in prolonged hospitalization and extended length of stay in the intensive care unit . Thereby, assessing the probability of a patient with DCI prior to developing a permanent neurological deficit and/or infarction is important for identifying patients that will maximally benefit from medical or interventional treatment.
Get Radiology Tree app to read full this article<
Get Radiology Tree app to read full this article<
Materials and methods
Study Population
Get Radiology Tree app to read full this article<
Study Design
Get Radiology Tree app to read full this article<
CTP Scanning Protocol and Data Processing
Get Radiology Tree app to read full this article<
Get Radiology Tree app to read full this article<
Get Radiology Tree app to read full this article<
Get Radiology Tree app to read full this article<
DSA
Get Radiology Tree app to read full this article<
Reference Standard
Get Radiology Tree app to read full this article<
Statistical Analysis
Get Radiology Tree app to read full this article<
Results
Study Population Characteristics
Get Radiology Tree app to read full this article<
Table 1
Clinical and Demographic Characteristics of the Study Population
Study Population n = 57 All
n = 57 DCI
n = 45 No DCI
n = 12 Age (years) median
range 51 28–80 55 29–80 48 28–78 Gender % (n) % (n) % (n) Male 25 (14/57) 27 (12/45) 17 (2/12) Female 75 (43/57) 73 (33/45) 83 (10/12) Aneurysm location Anterior 95 (54/57) 93 (42/45) 100 (12/12) Posterior 5 (3/57) 7 (3/45) 0 (0/12) Treatment type Surgical clipping 65 (37/57) 62 (28/45) 75 (9/12) Coil embolization 35 (20/57) 38 (17/45) 25 (3/12) Hunt Hess grade Low (Grades 1 and 2) 46 (26/57) 44 (20/45) 50 (6/12) High (Grades 3, 4, and 5) 54 (31/57) 56 (25/45) 50 (6/12)
Get Radiology Tree app to read full this article<
Get Radiology Tree app to read full this article<
Table 2
Imaging Characteristics of the Study Population
Study Population (n = 57) All
n = 57 DCI
n = 45 No DCI
n = 12 Day of CTP median 7 7 6 Qualitative CTP deficit % (n) 70 (40/57) 80 (36/45) 33 (4/12) Time-frame between symptoms and CTP in days median 0 0 0 Day of DSA median 8 8 9 Timeframe between CTP and DSA in days median 1 1 3
CTP, computed tomography perfusion; DSA, digital subtraction angiography.
Get Radiology Tree app to read full this article<
Get Radiology Tree app to read full this article<
Table 3
Comparison of Test Characteristics for CTP and DSA
CTP DSA Sensitivity 0.80 (95% CI 0.68–0.92) 0.73 (95% CI 0.60–0.86) Specificity 0.67 (95% CI 0.40–0.93) 0.75 (95% CI 0.50–0.99) PPV 0.90 (95% CI 0.82–0.96) 0.92 (95% CI 0.82–0.98) NPV 0.47 (95% CI 0.27–0.62) 0.43 (95% CI 0.26–0.53) LR + 2.4 (95% CI 1.06–5.41) 2.9 (95% CI 1.08–7.94) LR - 0.3 (95% CI 0.15–0.61) 0.4 (95% CI 0.20–0.64) Odds ratio 8.0 (95% CI 1.96–32.6) 8.25 (95% CI 1.91–35.67)
CTP, computed tomography perfusion; DSA, digital subtraction angiography; LR +, likelihood ratio of a positive result; LR -, likelihood ratio of a negative result; NPV, negative predictive value; PPV, positive predictive value.
Get Radiology Tree app to read full this article<
Get Radiology Tree app to read full this article<
Get Radiology Tree app to read full this article<
Discussion
Get Radiology Tree app to read full this article<
Get Radiology Tree app to read full this article<
Get Radiology Tree app to read full this article<
Get Radiology Tree app to read full this article<
Get Radiology Tree app to read full this article<
Get Radiology Tree app to read full this article<
Get Radiology Tree app to read full this article<
Conclusion
Get Radiology Tree app to read full this article<
Get Radiology Tree app to read full this article<
References
1. Pluta R.M., Hansen-Schwartz J., Dreier J., et. al.: Cerebral vasospasm following subarachnoid hemorrhage: time for a new world of thought. Neurol Res 2009; 31: pp. 151-158.
2. Frontera J.A., Fernandez A., Schmidt J.M., et. al.: Defining vasospasm after subarachnoid hemorrhage: what is the most clinically relevant definition?. Stroke 2009; 40: pp. 1963-1968.
3. Claassen J., Bernardini G.L., Kreiter K., et. al.: Effect of cisternal and ventricular blood on risk of delayed cerebral ischemia after subarachnoid hemorrhage: the Fisher scale revisited. Stroke 2001; 32: pp. 2012-2020.
4. Laumer R., Steinmeier R., Gonner F., et. al.: Cerebral hemodynamics in subarachnoid hemorrhage evaluated by transcranial Doppler sonography. Part 1. Reliability of flow velocities in clinical management. Neurosurgery 1993; 33: pp. 1-8. discussion 8–9
5. Nolan C.P., Macdonald R.L.: Can angiographic vasospasm be used as a surrogate marker in evaluating therapeutic interventions for cerebral vasospasm?. Neurosurg Focus 2006; 21: pp. E1.
6. Vergouwen M.D., Vermeulen M., van Gijn J., et. al.: Definition of delayed cerebral ischemia after aneurysmal subarachnoid hemorrhage as an outcome event in clinical trials and observational studies: proposal of a multidisciplinary research group. Stroke 2010; 41: 2391–2295
7. Harrigan M.R., Magnano C.R., Guterman L.R., et. al.: Computed tomographic perfusion in the management of aneurysmal subarachnoid hemorrhage: new application of an existent technique. Neurosurgery 2005; 56: pp. 304-317.
8. Nabavi D.G., LeBlanc L.M., Baxter B., et. al.: Monitoring cerebral perfusion after subarachnoid hemorrhage using CT. Neuroradiology 2001; 43: pp. 7-16.
9. Wintermark M., Ko N.U., Smith W.S., et. al.: Vasospasm after subarachnoid hemorrhage: utility of perfusion CT and CT angiography on diagnosis and management. AJNR Am J Neuroradiol 2006; 27: pp. 26-34.
10. Wintermark M., Maeder P., Thiran J.P., et. al.: Quantitative assessment of regional cerebral blood flows by perfusion CT studies at low injection rates: a critical review of the underlying theoretical models. Eur Radiol 2001; 11: pp. 1220-1230.
11. Sanelli P.C., Lev M.H., Eastwood J.D., et. al.: The effect of varying user-selected input parameters on quantitative values in CT perfusion maps. Acad Radiol 2004; 11: pp. 1085-1092.
12. Wintermark M., Lau B.C., Chien J., et. al.: The anterior cerebral artery is an appropriate arterial input function for perfusion-CT processing in patients with acute stroke. Neuroradiology 2008; 50: pp. 227-236.
13. Murphy B.D., Fox A.J., Lee D.H., et. al.: Identification of penumbra and infarct in acute ischemic stroke using computed tomography perfusion-derived blood flow and blood volume measurements. Stroke 2006; 37: pp. 1771-1777.
14. Powsner R.A., O’Tuama L.A., Jabre A., et. al.: SPECT imaging in cerebral vasospasm following subarachnoid hemorrhage. J Nucl Med 1998; 39: pp. 765-769.
15. Maceneaney P.M., Malone D.E.: The meaning of diagnostic test results: a spreadsheet for swift data analysis. Clin Radiol 2000; 55: pp. 227-235.
16. The Evidence-Based Radiology Group (St. Vincent’s University Hospital, Ireland). http://evidencebasedradiology.net . Accessed November 01 2010.
17. de Rooij N.K., Linn F.H., van der Plas J.A., et. al.: Incidence of subarachnoid haemorrhage: a systematic review with emphasis on region, age, gender and time trends. J Neurol Neurosurg Psychiatry 2007; 78: pp. 1365-1372.
18. Eden S.V., Meurer W.J., Sanchez B.N., et. al.: Gender and ethnic differences in subarachnoid hemorrhage. Neurology 2008; 71: pp. 731-735.
19. Warnock N.G., Gandhi M.R., Bergvall U., et. al.: Complications of intraarterial digital subtraction angiography in patients investigated for cerebral vascular disease. Br J Radiol 1993; 66: pp. 855-858.
20. Fergusen S., Macdonald R.L.: Predictors of cerebral infarction in patients with aneurysmal subarachnoid hemorrhage. Neurosurgery 2007; 60: pp. 658-667. discussion 667
21. Dankbaar J.W., de Rooij N.K., Velthuis B.K., et. al.: Diagnosing delayed cerebral ischemia with different CT modalities in patients with subarachnoid hemorrhage with clinical deterioration. Stroke 2009; 40: pp. 3493-3498.
22. Joseph L., Reinhold C.: Fundamentals of clinical research for radiologists. Introduction to probability theory and sampling distributions. AJR Am J Roentgenol 2003; 180: pp. 917-923.
23. Heffernan E.J., Dodd J.D., Malone D.E.: Cardiac multidetector CT: technical and diagnostic evaluation with evidence-based practice techniques. Radiology 2008; 248: pp. 366-377.
24. Dodd J.D.: Evidence-based practice in radiology: steps 3 and 4–appraise and apply diagnostic radiology literature. Radiology 2007; 242: pp. 342-354.
25. Hunt W.E., Hess R.M.: Surgical risk as related to time of intervention in the repair of intracranial aneurysms. J Neurosurg 1968; 28: pp. 14-20.
26. Hijdra A., van Gijn J., Nagelkerke N.J., et. al.: Prediction of delayed cerebral ischemia, rebleeding, and outcome after aneurysmal subarachnoid hemorrhage. Stroke 1988; 19: pp. 1250-1256.