
Rationale and Objectives
The aim of this study was to compare the diagnostic accuracy of 64-slice computed tomographic coronary angiography (CTCA) in groups of patients with low, intermediate, and high risk for coronary artery disease (CAD) events.
Materials and Methods
The institutional review board approved this study; written informed consent was obtained from all patients. Eighty-eight consecutive patients with suspected CAD (40 women; mean age, 64.3 ± 9.4 years; range, 39–82) underwent CTCA, calcium scoring, and invasive coronary angiography and were grouped according to their Framingham 10-year risk for hard coronary events into low (<10%), intermediate (10%–20%), and high (>20%) risk categories. Significant stenoses (luminal diameter narrowing ≥50%) were assessed on an intention-to-diagnose-basis; no coronary segment was excluded and nonevaluative segments were rated false positive. To determine differences between groups, Kruskal-Wallis tests were performed for individually determined values of diagnostic performance.
Results
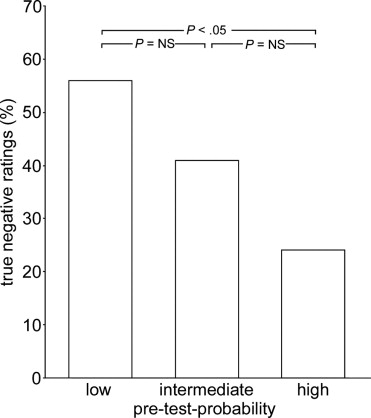
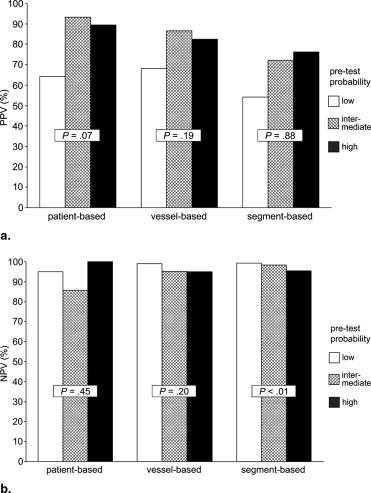
Per-patient sensitivity, specificity, negative predictive, and positive predictive values were 90.0%, 79.2%, 95.0%, and 64.3%, respectively, with low (n = 34), 87.5%, 92.3%, 85.7%, and 93.3%, respecitively, with intermediate (n = 29), and 100%, 75.0%, 100%, and 89.5%, respectively, with high risk (n = 25), with a trend toward higher positive predictive value ( P = .07). Per-segment negative predictive value was lower with high pretest probability ( P < .01). Mean calcium-score units were 90, 220, and 312 ( P = .23), and the prevalence of CAD was 29.4%, 55.2%, and 68.0% ( P < .01) with low, intermediate, and high risk.
Conclusion
Sensitivity and specificity of CTCA are not influenced by the prevalence of CAD, whereas the negative predictive value is lower and the positive predictive value tends to be higher in patients with a high prevalence of CAD.
Sixty-four–slice computed tomography (CT) has been shown to be a reliable noninvasive tool to document or rule out significant coronary artery lesions ( ). In particular, the high negative predictive value (NPV) of CT coronary angiography (CTCA), demonstrated in all studies ( ), has been suggested to obviate the need for invasive coronary angiography (ICA) in patients whose symptoms or abnormal stress test results require ruling out the presence of coronary artery disease (CAD) ( ). Although some guidelines ( ) allow consideration of CTCA in patients with a low pretest probability, others have suggested CTCA as an appropriate tool in patients with an intermediate risk for CAD ( ). In high pretest populations, CTCA is not considered a useful tool, because the likelihood for the necessity of a subsequent ICA is high.
However, most studies that determined the diagnostic accuracy of 64-slice CTCA have included patients with known CAD ( ) and patient cohorts with high prevalences of CAD (56%–85%) ( ), not taking into account the pretest probability or the risk to develop coronary events in those patients with suspected CAD ( ).
Get Radiology Tree app to read full this article<
Materials and methods
Patients
Get Radiology Tree app to read full this article<
Get Radiology Tree app to read full this article<
CT Data Acquisition and Postprocessing
Get Radiology Tree app to read full this article<
CT Image Reconstruction and Analysis
Get Radiology Tree app to read full this article<
Get Radiology Tree app to read full this article<
Get Radiology Tree app to read full this article<
Invasive Coronary Angiography
Get Radiology Tree app to read full this article<
Statistical Analysis
Get Radiology Tree app to read full this article<
Get Radiology Tree app to read full this article<
Results
Get Radiology Tree app to read full this article<
Table 1
Patient Demographics
All Patients Low Risk for CAD Events Intermediate Risk for CAD Events High Risk for CAD Events Significance P -Value No. of patients 88 34 29 25 Female/male (n) 40/48 24/10 10/19 6/19 χ 2 : <.001 Diabetes (n) 16 1 5 10 χ 2 : <.001 Nicotine abuse (n) 36 6 17 13 χ 2 : <.01 Age (y) 64.3 ± 9.4 (39–82) 62.7 ± 11.3 (39–81) 64.4 ± 7.8 (47–79) 66.5 ± 7.9 (49–82) ANOVA: .30 BMI (kg/m 2 ) 23.2 ± 3.9 (13.3–35.8) 22.2 ± 4.7 (13.3–35.8) 23.3 ± 2.9 (18.2–29.7) 24.2 ± 3.9 (18.7–34.0) ANOVA: .17 LDL (mmol/L) 2.9 ± 1.1 (1.4–7.4) 2.4 ± 0.8 (1.5–4.5) 2.9 ± 0.9 (1.4–5.0) 3.7 ± 1.4 (1.5–7.4) ANOVA: .001 HDL (mmol/L) 1.4 ± 0.4 (0.3–2.4) 1.7 ± 0.4 (0.7–2.4) 1.3 ± 0.3 (0.8–2.0) 1.2 ± 0.3 (0.3–1.8) ANOVA: <.001 Diastolic BP (mm Hg) 79 ± 12 (45–110) 77 ± 10 (55–96) 77 ± 12 (45–99) 83 ± 12 (60–110) ANOVA: .16 Systolic BP (mm Hg) 135 ± 20 (70–190) 129 ± 18 (70–160) 132 ± 18 (100–167) 147 ± 20 (120–190) ANOVA: <.01 Framingham risk score 7 (6, 17) 6 (3, 9) 7 (6, 12) 11 (9, 17) K-W: <.001 10-Year risk (%) 11 (7, 40) 6 (5, 9) 11 (11, 18) 24 (22, 40) K-W: <.001 At CTCA scanning HR (beats/min) 63.0 ± 9.2 (46–90) 63.2 ± 8.6 (48–76) 62.2 ± 9.0 (46–78) 63.8 ± 10.4 (47–90) ANOVA: 1.0 HR variability (beats/min) 4.5 ± 4.4 (0.5–22.2) 4.9 ± 4.7 (0.8–22.2) 3.9 ± 4.1 (0.8–16.1) 4.6 ± 4.7 (0.5–18.9) ANOVA: 1.0 Calcium score 173 (5, 635) 90 (1,589) 220 (37, 635) 312 (95, 1196) K-W: .23 Overall image quality score 1, 2, 3, 4, 5
K-W: .25 Best recon. interval 30%, 35%, 40%, 55%, 60%, 65%, 70%
K-W: .36
Quantitative variables are expressed as mean ± standard deviation (range); categorical variables are expressed as frequencies, or median (25th, 75th percentiles).
BMI, body mass index; LDL, low-density lipoprotein; HDL, high-density lipoprotein; BP, blood pressure; CTCA, computed tomography coronary angiography; HR, heart rate; recon., reconstruction; K-W, Kruskal-Wallis.
Get Radiology Tree app to read full this article<
Get Radiology Tree app to read full this article<
Diagnostic Accuracy of CTCA: Overall and in Groups With Low, Intermediate, and High Pretest Probability for CAD
Get Radiology Tree app to read full this article<
Table 2
Prevalence of CAD in Groups with Low, Intermediate, and High Risk for CAD Events
Analysis Low Risk for CAD Events Intermediate Risk for CAD Events High Risk for CAD Events Significance P -Value Patient based (n = 88) 29.4% (10/34) 55.2% (16/29) 68.0% (17/25) χ 2 : <.01 Vessel based (n = 351) 13.2% (18/136) 26.1% (30/115) 36.0% (36/100) χ 2 : <.001 Segment based (n = 1191) 4.7% (22/466) 9.6% (37/386) 16.2% (55/339) χ 2 : <.001
CAD, coronary artery disease.
Get Radiology Tree app to read full this article<
Get Radiology Tree app to read full this article<
Get Radiology Tree app to read full this article<
Get Radiology Tree app to read full this article<
Get Radiology Tree app to read full this article<
Table 3
Diagnostic Accuracy in Groups with Low, Intermediate, and High Pretest Probability for CAD
All Patients (absolute values; 95% CI) Low Risk for CAD Events (absolute values; 95% CI) Intermediate Risk for CAD Events (absolute values; 95% CI) High Risk for CAD Events (absolute values; 95% CI) Significance P -Value Patient based: Sensitivity 93.0% (40/43; 80.9–98.5) 90.0% (9/10; 55.5–98.8) 87.5% (14/16; 61.7–98.5) 100% (17/17; NA) .33 Specificity 82.2% (37/45; 67.9–92.0) 79.2% (19/24; 57.9–92.9) 92.3% (12/13; 63.9–99.8) 75.0% (6/8; 34.9–96.8) .51 NPV 92.5% (37/40; 79.6–98.4) 95.0% (19/20; 75.1–99.9) 85.7% (12/14; 57.2–98.2) 100% (6/6; NA) .45 PPV 83.3% (40/48; 69.8–92.5) 64.3% (9/14; 35.1–87.2) 93.3% (14/15; 68.1–99.8) 89.5% (17/19; 66.9–98.7) .07 Accuracy 87.5% (77/88; 78.7–93.6) 82.4% (28/34; 65.5–93.2) 89.7% (26/29; 72.7–97.8) 92.0% (23/25; 73.9–99.0) .44 Vessel based: Sensitivity 90.5% (76/84; 82.1–95.8) 94.4% (17/18; 72.7–99.9) 86.7% (26/30; 69.3–96.2) 91.7% (33/36; 77.5–98.3) .64 Specificity 92.9% (248/267; 89.1–95.7) 93.2% (110/118; 87.1–97.0) 95.3% (81/85; 88.4–98.7) 89.1% (57/64; 78.8–95.5) .34 NPV 96.9% (248/256; 93.9–98.6) 99.1% (110/111; 95.1–99.9) 95.3% (81/85; 88.4–98.7) 95.0% (57/60; 86.1–98.9) .20 PPV 80.0% (76/95; 70.5–87.5) 68.0% (17/25; 46.5–85.1) 86.7% (26/30; 69.3–96.2) 82.5% (33/40; 67.2–92.7) .19 Accuracy 92.3% (324/351; 89.0–94.9) 93.4% (127/136; 87.8–96.9) 93.0% (107/115; 86.8–96.9) 90.0% (90/100; 82.4–95.1) .59 Segment based: Sensitivity 80.7% (92/114; 72.3–87.5) 86.4% (19/22; 65.1–97.1) 83.8% (31/37; 67.9–93.8) 76.4% (42/55; 62.9–86.8) .51 Specificity 96.2% (1036/1077; 94.9–97.3) 96.4% (428/444; 94.2–97.9) 96.6% (337/349; 94.1–98.2) 95.4% (271/284; 92.3–97.5) .73 NPV 97.9% (1036/1058; 96.9–98.7) 99.3% (428/431; 97.9–99.9) 98.3% (337/343; 96.2–99.4) 95.4% (271/284; 92.3–97.5) <.01 PPV 69.2% (92/133; 60.6–76.9) 54.3% (19/35; 36.7–71.2) 72.1% (31/43; 56.3–84.7) 76.4% (42/55; 62.9–86.8) .88 Accuracy 94.7% (1128/1191; 93.3–95.9) 95.9% (447/466; 93.7–97.5) 95.3% (368/386; 92.7–97.2) 92.3% (313/339; 88.9–94.9) .06
CAD, coronary artery disease; CI, confidence interval; NA, not available; NS, not significant; NPV, negative predictive value; PPV, positive predictive value.
Get Radiology Tree app to read full this article<
Discussion
Get Radiology Tree app to read full this article<
Get Radiology Tree app to read full this article<
Prevalence of CAD
Get Radiology Tree app to read full this article<
Get Radiology Tree app to read full this article<
Sensitivity and Specificity of CTCA
Get Radiology Tree app to read full this article<
Table 4
Diagnostic Accuracy of 64-Slice CTCA
Authors Prevalence (%) Patients (n) Accuracy Sensitivity Specificity NPV PPV Patient based Meijboom et al. ( ) 85 104 96 100 75 100 96 Ehara et al. ( ) 88 67 97 98 86 86 98 Pugliese et al. ( ) 71 35 97 100 90 100 96 Leschka et al. ( ) 70 67 NA 100 NA 100 NA Nikolaou et al. ( ) 57 72 90 97 79 96 86 Raff et al. ( ) 57 70 93 95 90 93 93 Present study 49 88 88 93 82 93 83 Leber et al. ( ) 42 59 NA 88 NA NA NA Ropers et al. ( ) 31 84 89 96 91 98 83 Segment based Ehara et al. ( ) 34 884 93 91 94 95 89 Leschka et al. ( ) 18 1005 97 94 97 99 87 Pugliese et al. ( ) 14 494 96 99 96 100 78 Nikolaou et al. ( ) 13 923 94 82 95 97 69 Meijboom et al. ( ) 13 1525 91 92 91 99 60 Present study 10 1191 95 81 96 98 69 Raff et al. ( ) 10 935 94 86 95 98 66 Leber et al. ( ) 8 798 96 79 97 98 72 Ropers et al. ( ) 4 1083 96 93 97 100 56
CTCA, computed tomography coronary angiography; PPV, positive predictive value; NPV, negative predictive value; NA, not available.
Get Radiology Tree app to read full this article<
Get Radiology Tree app to read full this article<
NPV and PPV of CTCA
Get Radiology Tree app to read full this article<
Clinical Implications
Get Radiology Tree app to read full this article<
Study Limitations
Get Radiology Tree app to read full this article<
Get Radiology Tree app to read full this article<
Get Radiology Tree app to read full this article<
Conclusions
Get Radiology Tree app to read full this article<
Get Radiology Tree app to read full this article<
References
1. Leschka S., Alkadhi H., Plass A., et. al.: Accuracy of MSCT coronary angiography with 64-slice technology: First experience. Eur Heart J 2005; 26: pp. 1482-1487.
2. Leber A.W., Knez A., von Ziegler F., et. al.: Quantification of obstructive and nonobstructive coronary lesions by 64-slice computed tomography: A comparative study with quantitative coronary angiography and intravascular ultrasound. J Am Coll Cardiol 2005; 46: pp. 147-154.
3. Raff G.L., Gallagher M.J., O’Neill W.W., et. al.: Diagnostic accuracy of noninvasive coronary angiography using 64-slice spiral computed tomography. J Am Coll Cardiol 2005; 46: pp. 552-557.
4. Mollet N.R., Cademartiri F., van Mieghem C.A., et. al.: High-resolution spiral computed tomography coronary angiography in patients referred for diagnostic conventional coronary angiography. Circulation 2005; 112: pp. 2318-2323.
5. Pugliese F., Mollet N.R., Runza G., et. al.: Diagnostic accuracy of non-invasive 64-slice CT coronary angiography in patients with stable angina pectoris. Eur Radiol 2006; 16: pp. 575-582.
6. Nikolaou K., Knez A., Rist C., et. al.: Accuracy of 64-MDCT in the diagnosis of ischemic heart disease. AJR Am J Roentgenol 2006; 187: pp. 111-117.
7. Ong T.K., Chin S.P., Liew C.K., et. al.: Accuracy of 64-row multidetector computed tomography in detecting coronary artery disease in 134 symptomatic patients: Influence of calcification. Am Heart J 2006; 151: pp. 1321-1326.
8. Ehara M., Surmely J.F., Kawai M., et. al.: Diagnostic accuracy of 64-slice computed tomography for detecting angiographically significant coronary artery stenosis in an unselected consecutive patient population: Comparison with conventional invasive angiography. Circ J 2006; 70: pp. 564-571.
9. Ropers D., Rixe J., Anders K., et. al.: Usefulness of multidetector row spiral computed tomography with 64- × 0.6-mm collimation and 330-ms rotation for the noninvasive detection of significant coronary artery stenoses. Am J Cardiol 2006; 97: pp. 343-348.
10. Meijboom W.B., Mollet N.R., van Mieghem C.A., et. al.: 64-slice Computed tomography coronary angiography in patients with non-ST elevation acute coronary syndrome. Heart 2007; 93: pp. 1386-1392.
11. Budoff M.J., Achenbach S., Blumenthal R.S., et. al.: Assessment of coronary artery disease by cardiac computed tomography: A scientific statement from the American Heart Association Committee on Cardiovascular Imaging and Intervention, Council on Cardiovascular Radiology and Intervention, and Committee on Cardiac Imaging, Council on Clinical Cardiology. Circulation 2006; 114: pp. 1761-1791.
12. Fox K., Garcia M.A., Ardissino D., et. al.: Guidelines on the management of stable angina pectoris: executive summary: The Task Force on the Management of Stable Angina Pectoris of the European Society of Cardiology. Eur Heart J 2006; 27: pp. 1341-1381.
13. ACCF/ACR/SCCT/SCMR/ASNC/NASCI/SCAI/SIR 2006 Appropriateness criteria for cardiac computed tomography and cardiac magnetic resonance imaging: A report of the American College of Cardiology Foundation Quality Strategic Directions Committee Appropriateness Criteria Working Group. J Am Coll Radiol 2006; 3: pp. 751-771.
14. Expert Panel on Detection, Evaluation and Treatment of High Blood Cholesterol in Adults. JAMA 2001; 285: pp. 2486-2497.
15. Flohr T., Ohnesorge B.: Heart rate adaptive optimization of spatial and temporal resolution for electrocardiogram-gated multislice spiral CT of the heart. J Comput Assist Tomogr 2001; 25: pp. 907-923.
16. Austen W.G., Edwards J.E., Frye R.L., et. al.: A reporting system on patients evaluated for coronary artery disease. Circulation 1975; 51: pp. 5-40.
17. Leschka S., Wildermuth S., Boehm T., et. al.: Noninvasive coronary angiography with 64-section CT: Effect of average heart rate and heart rate variability on image quality. Radiology 2006; 241: pp. 378-385.
18. Landis J.R., Koch G.G.: The measurement of observer agreement for categorical data. Biometrics 1977; 33: pp. 159-174.
19. Meijboom W.B., van Mieghem C.A., Mollet N.R., et. al.: 64-Slice computed tomography coronary angiography in patients with high, intermediate, or low pretest probability of significant coronary artery disease. J Am Coll Cardiol 2007; 50: pp. 1469-1475.
20. Garcia M.J., Lessick J., Hoffmann M.H.: Accuracy of 16-row multidetector computed tomography for the assessment of coronary artery stenosis. JAMA 2006; 296: pp. 403-411.
21. Hausleiter J., Meyer T., Hadamitzky M., et. al.: Non-invasive coronary computed tomographic angiography for patients with suspected coronary artery disease: The Coronary Angiography by Computed Tomography with the Use of a Submillimeter resolution (CACTUS) trial. Eur Heart J 2007; 28: pp. 3034-3041.
22. Diamond G.A., Forrester J.S.: Analysis of probability as an aid in the clinical diagnosis of coronary-artery disease. N Engl J Med 1979; 300: pp. 1350-1358.
23. Arad Y., Goodman K.J., Roth M., et. al.: Coronary calcification, coronary disease risk factors, C-reactive protein, and atherosclerotic cardiovascular disease events: The St. Francis Heart Study. J Am Coll Cardiol 2005; 46: pp. 158-165.
24. Kuettner A., Trabold T., Schroeder S., et. al.: Noninvasive detection of coronary lesions using 16-detector multislice spiral computed tomography technology: Initial clinical results. J Am Coll Cardiol 2004; 44: pp. 1230-1237.
25. Cademartiri F., La Grutta L., Runza G., et. al.: Influence of convolution filtering on coronary plaque attenuation values: Observations in an ex vivo model of multislice computed tomography coronary angiography. Eur Radiol 2007; 17: pp. 1842-1849.
26. Gaemperli O., Schepis T., Valenta I., et. al.: Cardiac image fusion from stand-alone SPECT and CT: Clinical experience. J Nucl Med 2007; 48: pp. 696-703.
27. Namdar M., Hany T.F., Koepfli P., et. al.: Integrated PET/CT for the assessment of coronary artery disease: A feasibility study. J Nucl Med 2005; 46: pp. 930-935.
28. Kern M.J., Lerman A., Bech J.W., et. al.: Physiological assessment of coronary artery disease in the cardiac catheterization laboratory: A scientific statement from the American Heart Association Committee on Diagnostic and Interventional Cardiac Catheterization, Council on Clinical Cardiology. Circulation 2006; 114: pp. 1321-1341.
29. Scheffel H., Alkadhi H., Plass A., et. al.: Accuracy of dual-source CT coronary angiography: First experience in a high pre-test probability population without heart rate control. Eur Radiol 2006; 16: pp. 2739-2747.