
Rationale and Objectives
Analog film radiographs are typically used to classify pneumoconiosis to allow comparison with standard film radiographs. The aim of this study was to determine if digital radiography is comparable to film for the purpose of classifying pneumoconiotic pleural abnormalities.
Materials and Methods
Subjects were 200 asbestos-exposed patients, from whom digital and film chest radiographs were obtained along with chest high-resolution computed tomographic scans. Using a crossover design, radiographs were independently read on two occasions by seven readers, using conventional International Labour Organization standards for film and digitized standards for digital. High-resolution computed tomographic scans were read independently by three readers. Areas under the receiver-operating characteristic curves were calculated using high-resolution computed tomographic ratings as the gold standard for disease status. Mixed linear models were fit to estimate the effects of order of presentation, occasion, and modality, treating the seven readers as a random effect. Comparing digital and film radiography for each reader and occasion, crude agreement and agreement beyond chance (κ) were also calculated.
Results
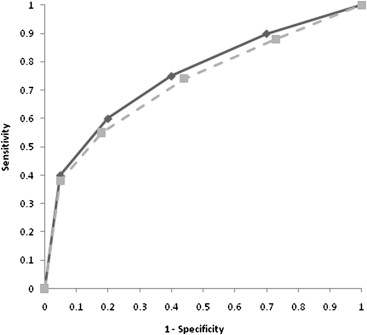
The linear models showed no statistically significant sequence effect for order of presentation ( P = .73) or occasion ( P = .28). Most important, the difference between modalities was not statistically significant (digital vs film, P = .54). The mean area under the curve for film was 0.736 and increased slightly to 0.741 for digital. Mean crude agreement for the presence of pleural abnormalities consistent with pneumoconiosis across all readers and occasions was 78.3%, while the mean κ value was 0.49.
Conclusions
These results indicate that digital radiography is not statistically different from analog film for the purpose of classifying pneumoconiotic pleural abnormalities, when appropriate standards are used.
The respiratory system is the most important route of entry for occupational exposure to particulates . Inhalation exposure to inorganic particulates may result in one of many occupational respiratory diseases collectively known as pneumoconioses . Chest radiographs were commonly used to detect pneumoconiosis throughout much of the 20th century. Worldwide, radiographs used to detect pneumoconiosis are typically coded using the International Labour Organization (ILO) classification , which requires comparison with a set of standard radiographs. This standard set consists of 22 radiographs, providing differing types in terms of shape, size, and severity of abnormalities that were identified in patients with pneumoconiosis. The ILO classification system currently requires the use of analog films, given the previous limited availability of digital standard radiographs . However, most radiology departments in the United States have transitioned from the use of film in recent years. This has been due to several advantages of digital radiography, including decreased processing time, remote reading capability, and enhanced image quality compared to film. This widespread adoption of digital radiography in many countries has created a need to validate its use for classifying pneumoconiosis.
Only a small number of validation studies have been conducted, but their results suggest that digital radiography is a suitable replacement for film for classifying parenchymal abnormalities . Of these studies, two examined the adequacy of digital radiography for classifying pleural abnormalities . However, neither study used a gold standard for the presence of abnormalities, leaving it unclear which modality was superior.
Get Radiology Tree app to read full this article<
Materials and methods
Subject Recruitment
Get Radiology Tree app to read full this article<
Get Radiology Tree app to read full this article<
Image Collection
Get Radiology Tree app to read full this article<
Standard ILO Radiographic Images
Get Radiology Tree app to read full this article<
Image Reading
Get Radiology Tree app to read full this article<
Get Radiology Tree app to read full this article<
Get Radiology Tree app to read full this article<
Get Radiology Tree app to read full this article<
Get Radiology Tree app to read full this article<
Statistical Analyses
Get Radiology Tree app to read full this article<
Get Radiology Tree app to read full this article<
Get Radiology Tree app to read full this article<
Get Radiology Tree app to read full this article<
Results
Subject Characteristics
Get Radiology Tree app to read full this article<
Table 1
Characteristics of Study Subjects ( n = 200)
Variable_n_ % Men 143 71.5 BMI category (kg/m 2 ) Normal (18.5 ≤ BMI < 25) 24 12.0 Overweight (25 ≤ BMI < 30) 68 34.0 Obese (30 ≤ BMI < 40) 91 45.5 Morbidly obese (≥40) 17 8.5 Exposure category Occupational 46 23.0 Household contact 51 25.5 Community 103 51.5 Smoking status Never 67 33.5 Current/former 133 66.5 Mean ± SD Median (range) Age 62.8 ± 10.5 63.0 (37.1–89.5) BMI 31.7 ± 7.0 30.4 (19.5–70.3)
BMI, body mass index; SD, standard deviation.
Get Radiology Tree app to read full this article<
Reading Results
Get Radiology Tree app to read full this article<
Table 2
Expert Interreader Agreement for the Presence of Any Pleural Abnormalities on HRCT
Reader Comparison ∗ Number Agreeing Number of Pairs Percentage Agreeing Simple κ Lower CL Upper CL X vs Y 163 200 81.5 0.64 0.53 0.74 X vs Z 169 200 84.5 0.69 0.59 0.79 Y vs Z 174 200 87.0 0.73 0.64 0.83
CL, confidence limit; HRCT, high-resolution computed tomography.
Get Radiology Tree app to read full this article<
Get Radiology Tree app to read full this article<
Get Radiology Tree app to read full this article<
Table 3
Selected Results of ILO Classification Overall and by Image Modality
Outcome Overall ( n = 5200) Film ( n = 2600) Digital ( n = 2600) χ 2 ( P )n %n %n % Image quality ∗ Good 3311 63.8 1599 61.6 1712 66.0 10.9 (<.01) Acceptable, with no technical defect 1802 34.7 957 36.9 845 32.6 Acceptable, with some technical defect 79 1.5 41 1.6 38 1.5 Any parenchymal abnormalities No 4528 87.1 2304 88.6 2224 85.5 10.9 (<.01) Yes 672 12.9 296 11.4 376 14.5 Certainty of presence of pleural abnormalities Definitely present 1245 24.2 635 24.6 610 23.7 8.8 (.12) Probably present 864 16.8 457 17.7 407 15.8 Unsure 928 18.0 432 16.7 496 19.3 Probably absent 1077 20.9 542 21.0 535 20.8 Definitely absent 1039 20.2 519 20.1 520 20.2 Presence of pleural abnormalities No 2327 44.8 1139 43.8 1188 45.7 1.8675 (.17) Yes 2873 55.3 1461 56.2 1412 54.3
ILO, International Labour Organization.
Get Radiology Tree app to read full this article<
Get Radiology Tree app to read full this article<
Reliability
Get Radiology Tree app to read full this article<
Table 4
Crude Agreement and κ Results for Presence or Absence of Pleural Abnormalities and Reader Certainty of Their Presence on Digital Versus Film Radiographs within Readers and Reading Occasion
Reader/Occasion/Modality Comparison ∗ Number Agreeing Number of Pairs not Missing Crude Agreement (%) κ † Lower CL Upper CL Presence/absence Q1D × Q1F 144 200 72.0 0.44 0.31 0.56 Q2D × Q2F 131 200 65.5 0.25 0.11 0.38 R1D × R1F 153 200 76.5 0.48 0.35 0.61 R2D × R2F 161 200 80.5 0.58 0.46 0.69 S1D × S1F 156 200 78.0 0.31 0.16 0.47 T1D × T1F 153 200 76.5 0.48 0.35 0.60 T2D × T2F 159 200 79.5 0.53 0.41 0.66 U1D × U1F 174 200 87.0 0.73 0.64 0.83 U2D × U2F 158 200 79.0 0.58 0.47 0.69 V1D × V1F 165 200 82.5 0.64 0.53 0.75 V2D × V2F 171 200 85.5 0.68 0.57 0.79 W1D × W1F 151 200 75.5 0.41 0.28 0.55 W2D × W2F 160 200 80.0 0.32 0.17 0.48 Mean 157 78.3 0.49 Level of certainty ‡ Q1D × Q1F 84 199 42.2 0.48 0.40 0.57 Q2D × Q2F 77 199 38.7 0.41 0.32 0.49 R1D × R1F 98 198 49.5 0.56 0.48 0.64 R2D × R2F 107 200 53.5 0.55 0.46 0.63 S1D × S1F 72 190 37.9 0.38 0.29 0.47 T1D × T1F 91 198 46.0 0.48 0.39 0.56 T2D × T2F 102 198 51.5 0.55 0.48 0.63 U1D × U1F 109 198 55.1 0.60 0.53 0.68 U2D × U2F 106 192 55.2 0.59 0.51 0.67 V1D × V1F 116 200 58.0 0.67 0.60 0.74 V2D × V2F 110 200 55.0 0.63 0.55 0.70 W1D × W1F 84 182 46.2 0.48 0.38 0.57 W2D × W2F 108 199 54.3 0.50 0.42 0.58 Mean 97 49.5 0.53
CL, confidence limit.
Get Radiology Tree app to read full this article<
Get Radiology Tree app to read full this article<
Get Radiology Tree app to read full this article<
Table 5
Intrareader and Intraoccasion Crude Agreement for Subclassifications of Pleural Abnormalities for Film Versus Digital Radiography
Classification Variable Number Agreeing Number of Pairs ∗ Crude Agreement (%) Pleural plaque Site (R, L, O) In profile 6411 7800 82.1 Face on 6604 7800 84.7 Diaphragm 6405 7800 82.1 Other site 7328 7800 93.9 Calcification site (R, L, O) In profile 7527 7800 96.5 Face on 7178 7800 92.0 Diaphragm 7142 7800 91.6 Other site 7589 7800 97.3 Extent Site (R, L, O) 4222 5200 81.2 Extent (1, 2, or 3) 3711 5200 71.4 Width Site (R, L, O) 4300 5200 82.7 Width (a, b, or c) 3914 5200 75.3 Costophrenic angle obliteration Site (R, L, O) 7471 7800 95.8 Diffuse pleural thickening Site (R, L, O) In profile 7582 7800 97.2 Face on 7593 7800 97.3 Calcification site (R, L, O) In profile 7741 7800 99.2 Face on 7716 7800 98.9 Extent Site (R, L, O) 5036 5200 96.8 Extent (1, 2, or 3) 4982 5200 95.8 Width Site (R, L, O) 5069 5200 97.4 Width (a, b, or c) 5019 5200 96.5
L, left lung; O, abnormality absent; R, right lung.
Get Radiology Tree app to read full this article<
Get Radiology Tree app to read full this article<
Get Radiology Tree app to read full this article<
Validity
Get Radiology Tree app to read full this article<
Table 6
Mixed Model Crossover Analysis of AUCs Assuming Fixed Effects for Sequence, Occasion, and Modality and Random Effects for Readers
Effect Mean Label Estimate Standard Error Adjusted DF Comparison_P_ Sequence 1:FD 0.737 0.010 8.26 Sequence 2:DF 0.741 0.010 9.39 1:FD vs. 2:DF .73 Occasion 1 0.744 0.010 8.26 Occasion 2 0.734 0.010 9.39 1 vs. 2 .28 Modality F 0.736 0.001 8.76 Modality D 0.742 0.001 8.76 F vs. D .54
AUC, area under the curve; D, digital; F, film.
Get Radiology Tree app to read full this article<
Discussion
Get Radiology Tree app to read full this article<
Get Radiology Tree app to read full this article<
Get Radiology Tree app to read full this article<
Get Radiology Tree app to read full this article<
Get Radiology Tree app to read full this article<
Get Radiology Tree app to read full this article<
Get Radiology Tree app to read full this article<
Get Radiology Tree app to read full this article<
Get Radiology Tree app to read full this article<
Get Radiology Tree app to read full this article<
Conclusions
Get Radiology Tree app to read full this article<
Acknowledgments
Get Radiology Tree app to read full this article<
Appendix A
Imaging Methods
Get Radiology Tree app to read full this article<
Get Radiology Tree app to read full this article<
Get Radiology Tree app to read full this article<
Appendix B
Computed Radiographic Image Processing and Viewing
Get Radiology Tree app to read full this article<
Get Radiology Tree app to read full this article<
Get Radiology Tree app to read full this article<
Gradation Processing Multiobjective Frequency Processing GA GT GC GS MRB MRT MRE MDB MDT MDE 1.3 E 1.6 0.15 D R 0.0 A M 0.6
Get Radiology Tree app to read full this article<
Get Radiology Tree app to read full this article<
Get Radiology Tree app to read full this article<
Get Radiology Tree app to read full this article<
Appendix C
AUCs for All Reader, Occasion, and Modality Combinations
Get Radiology Tree app to read full this article<
Reader Reading Occasion Modality AUC SE AUC L AUC U Q 1 Digital 0.7643 0.0324 0.7008 0.8278 Q 1 Film 0.7831 0.0311 0.7222 0.8440 Q 2 Digital 0.7621 0.0324 0.6985 0.8257 Q 2 Film 0.7387 0.0344 0.6714 0.8060 R 1 Digital 0.7632 0.0319 0.7008 0.8257 R 1 Film 0.7626 0.0317 0.7005 0.8246 R 2 Digital 0.7607 0.0316 0.6988 0.8226 R 2 Film 0.7659 0.0325 0.7022 0.8295 S 1 Digital 0.6988 0.0366 0.6270 0.7705 S 1 Film 0.7189 0.0350 0.6504 0.7874 T 1 Digital 0.7173 0.0357 0.6474 0.7872 T 1 Film 0.7712 0.0325 0.7075 0.8349 T 2 Digital 0.7455 0.0341 0.6788 0.8123 T 2 Film 0.7301 0.0348 0.6620 0.7982 U 1 Digital 0.7525 0.0320 0.6899 0.8151 U 1 Film 0.6965 0.0347 0.6285 0.7646 U 2 Digital 0.7478 0.0325 0.6841 0.8115 U 2 Film 0.6752 0.0356 0.6054 0.7450 V 1 Digital 0.7442 0.0333 0.6790 0.8094 V 1 Film 0.7167 0.0348 0.6485 0.7848 V 2 Digital 0.7053 0.0340 0.6386 0.7719 V 2 Film 0.7101 0.0343 0.6429 0.7772 W 1 Digital 0.7774 0.0331 0.7124 0.8423 W 1 Film 0.7495 0.0338 0.6832 0.8157 W 2 Digital 0.7280 0.0344 0.6606 0.7954 W 2 Film 0.7740 0.0326 0.7102 0.8378
Individual readers are labeled Q to W.
AUC, area under the curve; AUC L , lower confidence limit of the area under the curve; AUC U , upper confidence limit of the area under the curve; SE, standard error, obtained from testing the hypothesis that the AUC obtained from readings for 200 subjects differs from 0.5 (the AUC that would result from random classification).
Get Radiology Tree app to read full this article<
References
1. Cohen R., Balzer K.: Industrial toxicity.Plog B.A.Niland J.Quinlan P.Fundamentals of industrial hygiene.1996.National Safety CouncilChicago:pp. 123-151.
2. Cowie R., Murray J., Becklake M.R.: Pneumoconioses.Mason R.J.Murray J.Broaddus V.C.Nadel J.Textbook of respiratory medicine.2005.Elsevier SaundersPhiladelphia:pp. 554-564.
3. International Labour Organization: Guidelines for the use of the ILO international classification of radiographs of pneumoconioses.2000 ed2002.International Labour OrganizationGeneva, Switzerland
4. Zahringer M., Piekarski C., Saupe M., et. al.: Comparison of digital selenium radiography with an analog screen-film system in the diagnostic process of pneumoconiosis according to ILO classification. Rofo 2001; 173: pp. 942-948.
5. Takashima Y., Suganuma N., Sakurazawa H., et. al.: A flat-panel detector digital radiography and a storage phosphor computed radiography: screening for pneumoconioses. J Occup Health 2007; 49: pp. 39-45.
6. Franzblau A., Kazerooni E.A., Sen A., et. al.: Comparison of digital radiographs with film radiographs for the classification of pneumoconiosis. Acad Radiol 2009; 16: pp. 669-677.
7. Laney A.S., Petsonk E.L., Wolfe A.L., et. al.: Comparison of storage phosphor computed radiography with conventional film-screen radiography in the recognition of pneumoconiosis. Eur Respir J 2010; 36: pp. 122-127.
8. Sen A., Lee S.Y., Gillespie B.W., et. al.: Comparing film and digital radiographs for reliability of pneumoconiosis classifications: a modeling approach. Acad Radiol 2010; 17: pp. 511-519.
9. Peipins L.A., Lewin M., Campolucci S., et. al.: Radiographic abnormalities and exposure to asbestos-contaminated vermiculite in the community of Libby, Montana, USA. Environ Health Perspect 2003; 111: pp. 1753-1759.
10. Larson T.C., Meyer C.A., Kapil V., et. al.: Workers with Libby amphibole exposure: retrospective identification and progression of radiographic changes. Radiology 2010; 255: pp. 924-933.
11. Kusaka Y., Hering K.G., Parker J.E.: HRCT for occupational and environmental respiratory diseases.2005.SpringerTokyo, Japan
12. Fleiss J., Levin B., Paik M.: Statistical methods for rates and proportions.2003.Wiley-InterscienceNew York
13. Landis J.R., Koch G.G.: The measurement of observer agreement for categorical data. Biometrics 1977; 33: pp. 159-174.
14. Obuchowski N.A.: Receiver operating characteristic curves and their use in radiology. Radiology 2003; 229: pp. 3-8.
15. Fleiss J.: Design and analysis of clinical experiments.1986.WileyNew York
16. Feinstein A.R., Cicchetti D.V.: High agreement but low kappa: I. The problems of two paradoxes. J Clin Epidemiol 1990; 43: pp. 543-549.
17. Hoenig J.M., Heisey D.M.: The abuse of power: the pervasive fallacy of power calculations for data analysis. Am Stat 2001; 55: pp. 19-24.
18. Mannino D.M., Kennedy R.D., Hodous T.K.: Pneumoconiosis: comparison of digitized and conventional radiographs. Radiology 1993; 187: pp. 791-796.
19. Cicchetti D.V., Feinstein A.R.: High agreement but low kappa: II. Resolving the paradoxes. J Clin Epidemiol 1990; 43: pp. 551-558.
20. Lee Y.C., Runnion C.K., Pang S.C., et. al.: Increased body mass index is related to apparent circumscribed pleural thickening on plain chest radiographs. Am J Ind Med 2001; 39: pp. 112-116.
21. Ramazzini C.: Asbestos is still with us: repeat call for a universal ban. Arch Environ Occup Health 2010; 65: pp. 121-126.
22. Liu H., Tang Z., Yang Y., et. al.: Identification and classification of high risk groups for coal workers’ pneumoconiosis using an artificial neural network based on occupational histories: a retrospective cohort study. BMC Public Health 2009; 9: pp. 366.