
Rationale and Objectives
The purpose of this study was to determine the acquisition and interpretation times of screen-film mammography and soft-copy digital mammography in a diagnostic mammography center.
Materials and Methods
The study was conducted in three phases for patients presenting for clinical diagnostic workup to a mammography clinic. In the first phase, technologist acquisition and processing times and radiologist interpretation time were measured for patients imaged with a screen-film mammographic system. During the second phase of the study, times were measured for patients imaged with a direct radiographic digital mammographic system, with interpretation performed on a soft-copy display system. During the third phase, 3 months after installation of the soft-copy display system, times were measured again for patients imaged on the same direct radiographic digital mammographic system, with interpretation with the same soft-copy system. The same four experienced breast imaging radiologists and seven technologists participated in all phases of the study. All data were entered into a database, and statistical analysis was conducted using weighted linear models and logarithmic transformation.
Results
Times were obtained for 295 patients. There were 100 patients each for phases 1 and 2 and 95 patients for phase 3. Diagnostic mammographic acquisition times with processing were 13.02 min/case for screen film (phase 1), 8.16 min/case for digital (phase 2), and 10.66 min/case for digital (phase 3) ( P < .001 and P < .0001, respectively). In addition, the radiologist interpretation time for digital mammography in both phases was not significantly different from that for film mammography ( P = .2853 and P = .2893, respectively). There was no significant difference between phases 2 and 3 ( P = 1.0000). The mean interpretation times were 3.75 min/case for screen film, 2.14 min/case for digital (phase 2), and 2.26 min/case for digital (phase 3).
Conclusions
Digital mammography significantly shortened the acquisition time for diagnostic mammography. There was no significant difference in interpretation time compared to screen-film mammography in a diagnostic mammography setting.
Full-field digital mammography (FFDM) continues to increase in clinical use in the United States since its US Food and Drug Administration approval in 2000. As of December 2009, approximately 53% of US mammography facilities had one or more full-field digital mammographic units . This is a significant increase from 2005, when approximately 7% of US facilities used digital units .
For mammography centers that are currently considering whether to convert to FFDM, the initial impact on work flow continues to be a concern. FFDM offers the advantages of decoupling image acquisition, display, and storage , in addition to the elimination of wet chemical processing over screen-film mammography (SFM). The latter was the primary reason that led to a decrease in the acquisition time of FFDM compared to SFM in a screening mammography setting, as reported by Berns et al . However, they also reported an increase in interpretation time with FFDM .
Get Radiology Tree app to read full this article<
Materials and methods
Get Radiology Tree app to read full this article<
Get Radiology Tree app to read full this article<
Get Radiology Tree app to read full this article<
Get Radiology Tree app to read full this article<
Get Radiology Tree app to read full this article<
Get Radiology Tree app to read full this article<
Get Radiology Tree app to read full this article<
Get Radiology Tree app to read full this article<
Get Radiology Tree app to read full this article<
Get Radiology Tree app to read full this article<
Get Radiology Tree app to read full this article<
Get Radiology Tree app to read full this article<
Get Radiology Tree app to read full this article<
Results
Get Radiology Tree app to read full this article<
Get Radiology Tree app to read full this article<
Table 1
Reason for Diagnostic Mammography for Each Phase
Reason for Diagnostic Mammography Phase 1: SFM Phase 2: FFDM Phase 3: FFDM Total cases 100 100 95 Callback 18 (18.0%) 15 (15.0%) 13 (13.7%) Physical finding 39 (39.0%) 35 (35.0%) 41 (43.2%) Lumpectomy 22 (22.0%) 24 (24.0%) 25 (26.3%) Mastectomy 8 (8.0%) 9 (9.0%) 7 (7.4%) High risk 5 (5.0%) 7 (7.0%) 5 (5.2%) 6-mo follow-up 8 (8.0%) 10 (10.0%) 4 (4.2%)
FFDM, full-field digital mammography; SFM, screen-film mammography.
Table 2
Breast Density on Mammography for Each Phase
Breast Density Phase 1: SFM Phase 2: FFDM Phase 3: FFDM Total cases 100 100 95 Fatty 13 (13.0%) 11 (11.0%) 13 (13.7%) Scattered fibroglandular 45 (45.0%) 43 (43.0%) 39 (41.1%) Heterogeneously dense 36 (36.0%) 38 (38.0%) 36 (37.8%) Extremely dense 6 (6.0%) 8 (8.0%) 7 (7.4%)
FFDM, full-field digital mammography; SFM, screen-film mammography.
Get Radiology Tree app to read full this article<
Get Radiology Tree app to read full this article<
Get Radiology Tree app to read full this article<
Table 3
Total Acquisition Time (min) per Case
Phase Total Exams Variable Mean Standard Deviation Minimum Maximum 1 (SFM) 100 Acquisition time plus processing time 13.02 5.11 4.88 28.43 2 (FFDM) 100 Acquisition time ∗ 8.16 3.04 3.80 20.38 3 (FFDM) 95 Acquisition time ∗ 10.66 5.18 2.77 25.75
FFDM, full-field digital mammography; SFM, screen-film mammography.
Get Radiology Tree app to read full this article<
Get Radiology Tree app to read full this article<
Get Radiology Tree app to read full this article<
Get Radiology Tree app to read full this article<
Table 4
Total Image Interpretation Time (min) per Case
Phase Total Exams Variable Mean Standard Deviation Minimum Maximum 1 (SFM) 100 Interpretation time 4.73 6.25 0.42 30.23 2 (FFDM) 100 Interpretation time 2.15 1.34 0.35 5.45 3 (FFDM) 95 Interpretation time 2.31 1.90 0.08 10.35
FFDM, full-field digital mammography; SFM, screen-film mammography.
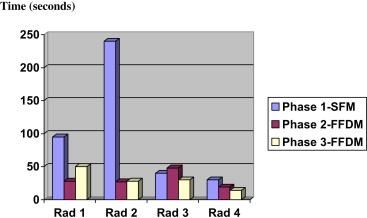
Table 5
Total Acquisition and Interpretation Times (min) per Case with Data for Radiologist 2 Excluded
Phase Total Exams Variable Mean Standard Deviation Minimum Maximum 1 (SFM) 88 Acquisition time plus processing time 13.03 4.93 5.73 28.43 Interpretation time 3.75 5.64 0.42 30.23 2 (FFDM) 97 Acquisition time 8.05 2.93 3.80 20.38 Interpretation time 2.14 1.31 0.35 5.45 3 (FFDM) 77 Acquisition time 10.75 5.44 2.77 25.75 Interpretation time 2.26 2.03 0.08 10.35
FFDM, full-field digital mammography; SFM, screen-film mammography.
Get Radiology Tree app to read full this article<
Discussion
Get Radiology Tree app to read full this article<
Get Radiology Tree app to read full this article<
Get Radiology Tree app to read full this article<
Get Radiology Tree app to read full this article<
Get Radiology Tree app to read full this article<
Get Radiology Tree app to read full this article<
Get Radiology Tree app to read full this article<
Get Radiology Tree app to read full this article<
Get Radiology Tree app to read full this article<
Get Radiology Tree app to read full this article<
Get Radiology Tree app to read full this article<
Get Radiology Tree app to read full this article<
Get Radiology Tree app to read full this article<
Get Radiology Tree app to read full this article<
Conclusions
Get Radiology Tree app to read full this article<
References
1. US Food and Drug Administration. 2009 scorecard statistics. Available at: http://www.fda.gov/Radiation-EmittingProducts/MammographyQualityStandardsActandProgram/DocumentArchives/ucm128078.htm . Accessed December 13, 2009.
2. US Food and Drug Administration. 2005 scorecard statistics. Available at: http://www.fda.gov/Radiation-EmittingProducts/MammographyQualityStandardsActandProgram/DocumentArchives/ucm128123.htm#0405 . Accessed December 13, 2009.
3. Nishikawa R.M., Mawdsley G.E., Fenster A., Yaffe M.J.: Scanned-projection digital mammography. Med Phys 1987; 14: pp. 717-727.
4. Berns E.A., Hendrick R.E., Solari M., et. al.: Digital and screen-film mammography: comparison of image acquisition and interpretation times. AJR Am J Roentgenol 2006; 187: pp. 38-41.
5. US Food and Drug Administration. Mammography Quality Standards Act and program. Available at: http://www.fda.gov/Radiation-EmittingProducts/MammographyQualityStandardsActandProgram/default.htm . Accessed June 20, 2009.
6. Dobson A.J.: An introduction to generalized linear models.1990.Chapman and HallLondon
7. Haygood T.M., Wang J., Atkinson E.N., et. al.: Timed efficiency of interpretation of digital and film-screen screening mammograms. AJR Am J Roentgenol 2009; 192: pp. 216-220.
8. Pisano E.D., Cole E.B., Kister E.O., et. al.: Interpretation of digital mammograms: comparison of speed and accuracy of soft-copy versus printed-film display. Radiology 2002; 223: pp. 483-488.
9. Hendrick R.E., Pisano E.D., Averbukh A., et. al.: Comparison of acquisition of parameters and breast dose in digital mammography and screen-film mammography in the American College of Radiology Imaging Network Digital Mammographic Imaging Screening Trial. AJR Am J Roentgenol 2010; 194: pp. 362-369.