
Rationale and Objectives
The aim of this study was to determine the accuracy and reproducibility of low-dose computed tomography (CT) and magnetic resonance (MR) for abdominal adipose tissue quantification on phantom and human studies.
Materials and Methods
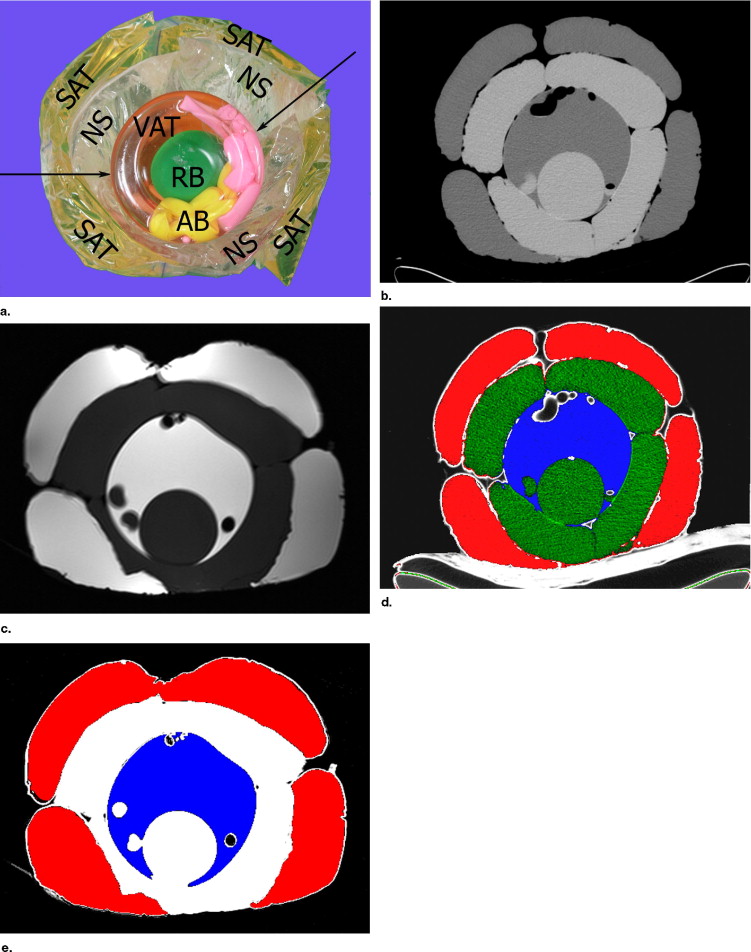
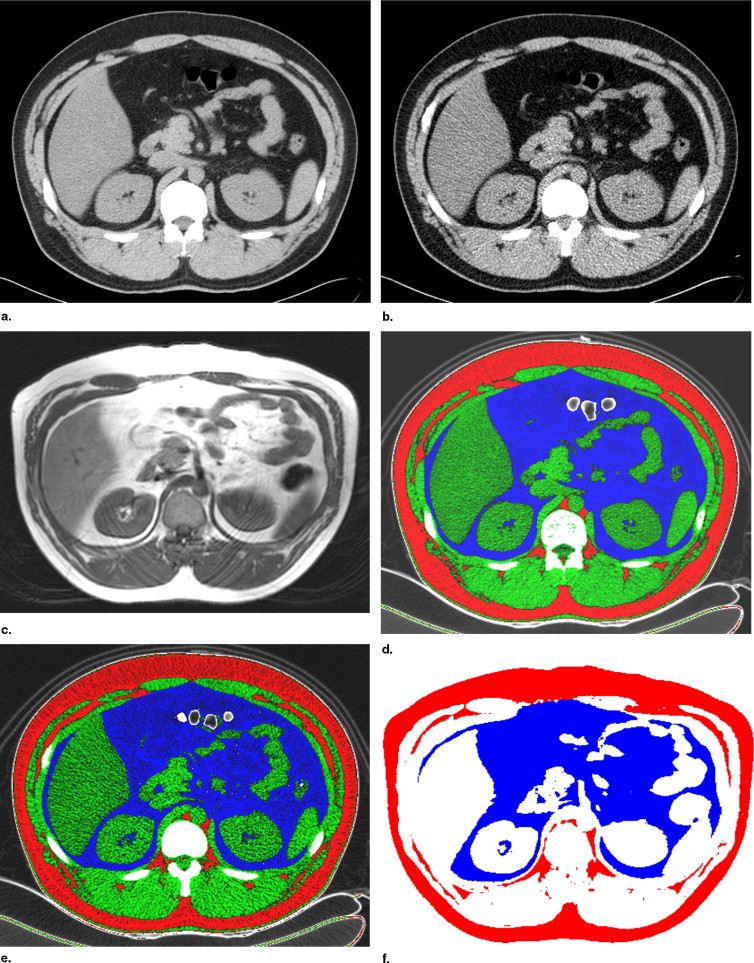
An adiposity phantom (with known internal/external oil volumes) was scanned at three different tube voltages (140, 120, and 90 kVp) using a 16-detector row CT scanner and was imaged using a T1-weighted spin echo MR sequence. For human studies, whole-volume coverage of the abdomen was obtained using CT (at 140 and 90 kVp) and T1-weighted spin echo MR imaging from five obese male volunteers (mean age, 40.6 years; mean body mass index, 30.2). The volumes of total, visceral, and subcutaneous adipose tissues (TAT, VAT, and SAT, respectively) were calculated independently by two radiologists for each CT scan and MR imaging using a computer-aided semiautomatic program.
Results
The estimated radiation dose could be reduced by approximately 75% with a 90-kVp protocol as compared with the 140-kVp protocol. Phantom studies showed that there was no statistically significant difference between the four methods in estimating the percentage predicted of the true volumes (measurement errors <4% for all methods, P > .05). In human studies, we found no statistically significant difference between the three methods in TAT, VAT, and SAT volumes ( P > .05). Inter- and intraobserver reproducibilities of the CT volume estimates using the 90-kVp protocol were better than those obtained from MR imaging (κ > 0.9 versus 0.4–0.5; coefficient of variation < 1% versus 15–22%).
Conclusion
Low-dose CT provides accurate and reproducible measurement of abdominal adipose tissue volumes with a relevant dose reduction.
There is growing evidence that obesity is related to several metabolic disturbances, such as diabetes, hypertension, and cardiovascular disease. In recent years, it has been suggested that the metabolic risks associated with obesity are more closely correlated with adipose tissue within the viscera (visceral adipose tissue, VAT) than subcutaneous adipose tissue (SAT) surrounding the abdomen ( ).
Therefore accurate and reproducible quantification of total and regional abdominal fat is of great importance for clinical and research purposes. Many indirect and direct methods have been used for the measurement of abdominal fat distribution, including anthropometry, bioelectrical impedance, and dual-energy x-ray absorptiometry ( ). It is generally accepted that computed tomography (CT) and magnetic resonance (MR) imaging are the best in vivo methods for directly assessing regional adipose tissue content in human subjects. CT is an excellent technique to measure cross-sectional areas of adipose tissue, but the exposure to ionizing radiation limits broad and repeated application in healthy subjects. Although MR offers specific advantages for measuring abdominal fat (such as that it does not require radiation exposure), its usage may be limited by accessibility and cost.
Get Radiology Tree app to read full this article<
Get Radiology Tree app to read full this article<
Materials and methods
Phantom Study
Phantom
Get Radiology Tree app to read full this article<
Get Radiology Tree app to read full this article<
CT
Get Radiology Tree app to read full this article<
MR
Get Radiology Tree app to read full this article<
Volunteer Study
Volunteers
Get Radiology Tree app to read full this article<
Get Radiology Tree app to read full this article<
CT
Get Radiology Tree app to read full this article<
MR
Get Radiology Tree app to read full this article<
Radiation Dose Measurement
Get Radiology Tree app to read full this article<
Fat Volume Measurements
Get Radiology Tree app to read full this article<
CT
Get Radiology Tree app to read full this article<
Table 1
Summary of CT Numbers of Vegetable Oil in Phantom and Adipose Tissue in Volunteers Obtained at 140, 120, and 90 kVp
Mean Attenuation Standard Deviation Minimum Value Maximum Value Vegetable oil in phantom 140 kVp −109.3 5.1 −133 −91 120 kVp −113.8 6.6 −148 −85 90 kVp −128.9 11.4 −164 −77 Fat tissue in volunteer 140 kVp −106.7 8.5 −143 −71 90 kVp −117.1 16.2 −169 −55
Get Radiology Tree app to read full this article<
Get Radiology Tree app to read full this article<
Get Radiology Tree app to read full this article<
MR
Get Radiology Tree app to read full this article<
Get Radiology Tree app to read full this article<
Statistical Analysis
Get Radiology Tree app to read full this article<
Results
Radiation Exposure in CT Scans
Get Radiology Tree app to read full this article<
Table 2
Summary of Radiation Dose Measurements at 140, 120, and 90 kVp
140 kVp 120 kVp 90 kVp Phantom CT dose index volume (mGy) 18.7 ± 0.2 12.0 ± 0.2 5.1 ± 0.1 Dose reduction (%) ⁎ 39.1 ± 0.4 73.4 ± 0.7 Volunteers (n = 5) CT dose index volume (mGy) 18.8 ± 0.2 5.0 ± 0.1 Dose length product (mGy cm) 953.2 ± 21.3 253.8 ± 38.7 Effective dose (mSv) 14.3 ± 1.8 3.8 ± 0.6 Dose reduction (%) ⁎ 73.5 ± 0.8
Note.—Data are mean ± standard deviation.
Get Radiology Tree app to read full this article<
Get Radiology Tree app to read full this article<
Phantom Study
Get Radiology Tree app to read full this article<
Table 3
Measured Volumes of Adipose Tissues using CT and MR in Phantom
CT protocol MR 140 kVp 120 kVp 90 kVp TAT 98.7 98.6 99.1 101.1 VAT 97.4 97.5 98.9 98.7 SAT 100.2 99.9 99.3 103.9 VAT/SAT 97.2 97.6 99.6 95.0
Data are mean estimate of true volumes (%). All data are not statistically significant.
TAT = total adipose tissue; VAT = visceral adipose tissue; SAT = subcutaneous adipose tissue.
Get Radiology Tree app to read full this article<
Volunteer Study
Get Radiology Tree app to read full this article<
Table 4
Measured Volumes of Adipose Tissues using CT and MR in 5 Volunteers
CT Protocol MR 140 kVp 90 kVp TAT (mL) 13,923 ± 1,965 13,938 ± 1,921 14,483 ± 2,292 VAT (mL) 5,665 ± 469 5,781 ± 430 5,859 ± 498 SAT (mL) 8,074 ± 1,282 8,177 ± 1,310 8,657 ± 1,420 VAT/SAT 0.73 ± 0.13 0.71 ± 0.14 0.68 ± 0.19
Data are mean ± standard deviation. All data are not statistically significant.
TAT = total adipose tissue; VAT = visceral adipose tissue; SAT = subcutaneous adipose tissue.
Get Radiology Tree app to read full this article<
Get Radiology Tree app to read full this article<
Discussion
Get Radiology Tree app to read full this article<
Get Radiology Tree app to read full this article<
Get Radiology Tree app to read full this article<
Get Radiology Tree app to read full this article<
Get Radiology Tree app to read full this article<
Get Radiology Tree app to read full this article<
Get Radiology Tree app to read full this article<
Get Radiology Tree app to read full this article<
Get Radiology Tree app to read full this article<
References
1. Abate N.: Insulin resistance and obesity. Diabetes Care 1996; 19: pp. 292-294.
2. Blair D., Habicht J.P., Sims E.A., et. al.: Evidence for an increased risk for hypertension with centrally located body fat and the effect of race and sex on this risk. Am J Epidemiol 1984; 119: pp. 526-540.
3. Kissebah A.H., Vydelingum N., Murray R., et. al.: Relation of body fat distribution to metabolic complications of obesity. J Clin Endocrinol Metab 1982; 54: pp. 254-260.
4. Fogelholm M., van Marken Lichtenbelt W.: Comparison of body composition methods: a literature analysis. Eur J Clin Nutr 1997; 51: pp. 495-503.
5. Deurenberg P., Yap M.: The assessment of obesity: methods for measuring body fat and global prevalence of obesity. Baillieres Best Pract Res Clin Endocrinol Metab 1999; 13: pp. 1-11.
6. Rogalla P., Meiri N., Hoksch B., et. al.: Low-dose spiral computed tomography for measuring abdominal fat volume and distribution in a clinical setting. Eur J Clin Nutr 1998; 52: pp. 597-602.
7. Starck G., Lonn L., Cederblad A., et. al.: Dose reduction for body composition measurements with CT. Appl Radiat Isot 1998; 49: pp. 561-563.
8. Hidajat N., Maurer J., Schroder R.J., et. al.: Relationships between physical dose quantities and patient dose in CT. Br J Radiol 1999; 72: pp. 556-561.
9. Sjostrom L., Kvist H., Cederbblad A., et. al.: Determination of total adipose tissue and body fat in women by computed tomography, 40K, and tritium. Am J Physiol 1986; 250: pp. E736-E745.
10. Goran M.I., Gower B.A.: Relation between visceral fat and disease risk in children and adolescents. Am J Clin Nutr 1999; 70: pp. 149S-156S.
11. Goran M.I., Nagy T.R., Treuth M.S., et. al.: Visceral fat in white and African American prepubertal children. Am J Clin Nutr 1997; 65: pp. 1703-1708.
12. Kvist H., Chowdhury B., Grangard U., et. al.: Total and visceral adipose-tissue volumes derived from measurements with computed tomography in adult men and women: predictive equations. Am J Clin Nutr 1988; 48: pp. 1351-1361.
13. Donnelly L.F., O’Brien K.J., Dardzinski B.J., et. al.: Using a phantom to compare MR techniques for determining the ratio of intraabdominal to subcutaneous adipose tissue. AJR Am J Roentgenol 2003; 180: pp. 993-998.
14. Chan Y.L., Leung S.S.F., Lam W.W.M., et. al.: Body fat estimation in children by magnetic resonance imaging, bioelectrical impedance, skinfold and body mass index: a pilot study. J Paediatr Child Health 1998; 34: pp. 22-28.
15. de Ridder C.M., de Boer R.W., Seidell J.C., et. al.: Body fat distribution in pubertal girls quantified by magnetic resonance imaging. Int J Obes 1992; 16: pp. 443-449.
16. Nakayama Y., Awai K., Funama Y., et. al.: Abdominal CT with low tube voltage: preliminary observations about radiation dose, contrast enhancement, image quality, and noise. Radiology 2005; 237: pp. 945-951.
17. Thomas C.K., Muhlenbruch G., Wildberger J.E., et. al.: Coronary artery calcium scoring with multislice computed tomography: in vitro assessment of a low tube voltage protocol. Invest Radiol 2006; 41: pp. 668-673.
18. Seidell J.C., Bakker C.J.G., van der Kooy K.: Imaging techniques for measuring adipose-tissue distribution-a comparison between computed tomography and 1.5-T magnetic resonance. Am J Clin Nutr 1990; 51: pp. 953-957.
19. Ross R., Leger L., Guardo R., et. al.: Adipose tissue volume measured by magnetic resonance imaging of and computerized tomography in rats. J Appl Physiol 1991; 70: pp. 2164-2172.
20. Machann J., Thamer C., Schnoedt B., et. al.: Standardized assessment of whole body adipose tissue topography by MRI. J Magn Reson Imaging 2005; 21: pp. 455-462.
21. Busetto L., Tregnaghi A., Bussolotto M., et. al.: Visceral fat loss evaluated by total body magnetic resonance imaging in obese women operated with laparoscopic adjustable silicone gastric banding. Int J Obes Relat Metab Disord 2000; 24: pp. 60-69.
22. Peng Q., McColl R.W., Wang J., et. al.: Water-saturated three-dimensional balanced steady-state free precession for fast abdominal fat quantification. J Magn Reson Imaging 2005; 21: pp. 263-271.