
Rationale and Objectives
The aim of this study was to compare the directly measured and the estimated computed tomography (CT) organ doses obtained from commercial radiation dose-tracking (RDT) software for CT performed with modulated tube current or automatic exposure control (AEC) technique and fixed tube current (mAs).
Materials and Methods
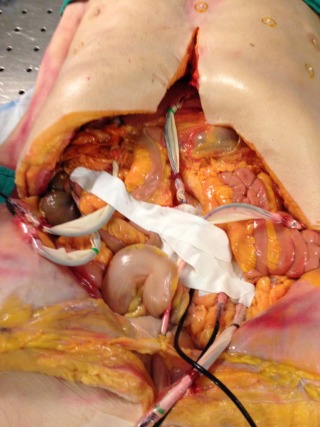
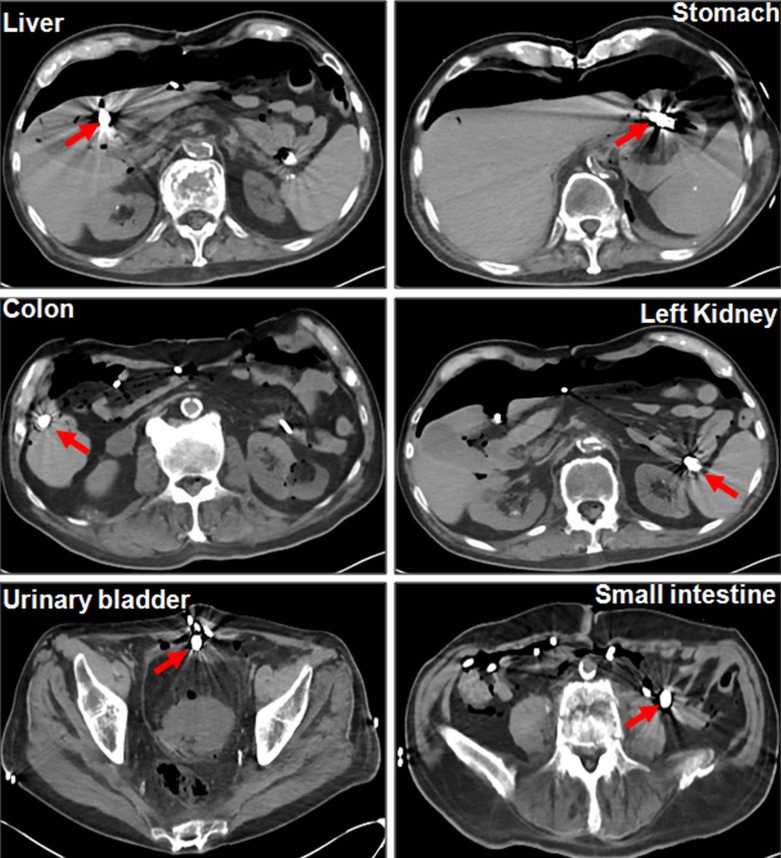
With the institutional review board (IRB) approval, the ionization chambers were surgically implanted in a human cadaver (88 years old, male, 68 kg) in six locations such as liver, stomach, colon, left kidney, small intestine, and urinary bladder. The cadaver was scanned with routine abdomen pelvis protocol on a 128-slice, dual-source multidetector computed tomography (MDCT) scanner using both AEC and fixed mAs. The effective and quality reference mAs of 100, 200, and 300 were used for AEC and fixed mAs, respectively. Scanning was repeated three times for each setting, and measured and estimated organ doses (from RDT software) were recorded (N = 3*3*2 = 18).
Results
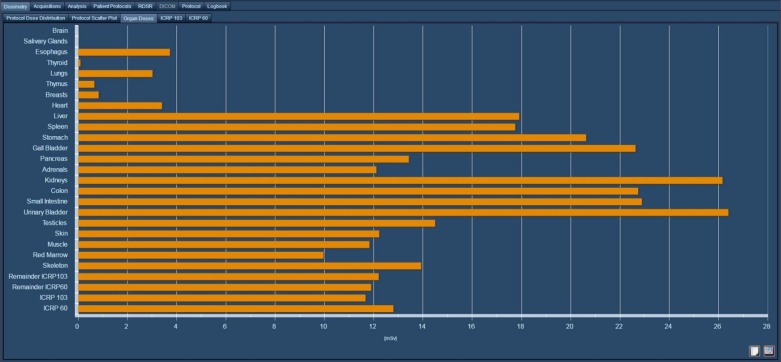
Mean CTDI vol for AEC and fixed mAs were 4, 8, 13 mGy and 7, 14, 21 mGy, respectively. The most estimated organ doses were significantly greater ( P < 0.01) than the measured organ doses for both AEC and fixed mAs. At AEC, the mean estimated organ doses (for six organs) were 14.7 mGy compared to mean measured organ doses of 12.3 mGy. Similarly, at fixed mAs, the mean estimated organ doses (for six organs) were 24 mGy compared to measured organ doses of 22.3 mGy. The differences among the measured and estimated organ doses were higher for AEC technique compared to the fixed mAs for most organs ( P < 0.01).
Conclusions
The most CT organ doses estimated from RDT software are greater compared to directly measured organ doses, particularly when AEC technique is used for CT scanning.
Introduction
Current computed tomography (CT) dose metrics, CT dose index volume (CTDI vol ), and dose length product (DLP) represent scanner output radiation doses to standardized 16- or 32-cm phantoms . These dose descriptors do not represent actual patient-absorbed doses because they are estimated using phantoms made up of uniform attenuation synthetic materials with two fixed sizes. On the other hand, human bodies are heterogeneous in tissue compositions, and their cross-sectional diameter covers a large range of values . Size-specific dose estimates (SSDE) has been recently proposed by the American Association of Physicists in Medicine (AAPM) in an effort to adapt CTDI vol to patients’ cross-sectional size in the body region being imaged .
Prior studies have used sophisticated mathematical models based on Monte Carlo simulation techniques to estimate organ doses . These techniques involve the use of advanced Monte Carlo simulations and voxelized patient models, which can take several hours of computations to estimate organ doses. Recently introduced commercial radiation dose-tracking (RDT) software (eXposure, Bayer Healthcare, Leverkusen, Germany) provides estimates of organ doses for CT examinations using precalculated organ dose data from first-generation phantoms, whereas other tools (such as VirtualDose TM , Virtual Phantoms Inc., Albany, NY) employ anatomically realistic family of phantoms. Rough organ doses can also be obtained using ImPACT dosimetry spreadsheet (freely available at www.ImPACTscan.org ), which uses precalculated Monte Carlo datasets obtained for multiple different scanner models using a simulated hermaphroditic phantom with mathematically modeled organs and tissues . These software tools must be benchmarked against experimental measurements for organ doses that are difficult to perform.
Get Radiology Tree app to read full this article<
Materials and Methods
Financial Disclosure
Get Radiology Tree app to read full this article<
Cadaver
Get Radiology Tree app to read full this article<
Dosimeters
Get Radiology Tree app to read full this article<
Get Radiology Tree app to read full this article<
Get Radiology Tree app to read full this article<
Scan Protocol
Get Radiology Tree app to read full this article<
Get Radiology Tree app to read full this article<
Get Radiology Tree app to read full this article<
Get Radiology Tree app to read full this article<
Get Radiology Tree app to read full this article<
Get Radiology Tree app to read full this article<
Organ Doses Estimation from RDT software
Get Radiology Tree app to read full this article<
Get Radiology Tree app to read full this article<
CT Numbers and Objective Image Noise
Get Radiology Tree app to read full this article<
Statistical Analysis
Get Radiology Tree app to read full this article<
Results
Get Radiology Tree app to read full this article<
Table 1
kV and mAs (Effective mAs) for AEC and Fixed mAs
kV mAs AEC 120 300 (187) 120 200 (118) 120 100 (58) Fixed mAs 120 300 120 200 120 100
Table 2
Mean (±SD) CTDI vol , DLP, Estimated Effective Dose, SSDE, and Image Noise with Both Fixed mAs and AEC Techniques
mAs Mean CTDI vol (±SD) mGy Mean DLP (±SD) mGy Mean Effective Dose (±SD) mSv SSDE mGy Image Noise AEC 300 (187) 13 ± 0.6 654 ± 5 9.8 ± 0.1 19 6 200 (118) 8 ± 0.1 412 ± 2 6.2 ± 0 12 7.7 100 (58) 4 ± 0 206 ± 1.2 3.1 ± 0 6 9.7 Fixed mAs 300 21 ± 0 1042 ± 0 15.6 ± 0 30 5.2 200 14 ± 0 696 ± 0 10.4 ± 0 20 5.6 100 7 ± 0 348 ± 0 5.2 ± 0 10 8.3
Table 3
Measured and Estimated Organ Doses (mGy) with Both Fixed mAs and AEC Techniques. The Numbers in Parenthesis Represent the % difference between Measured and Estimated Organ Doses
Type mAs CTDI vol
(mGy) Stomach (mGy) Liver (mGy) Left Kidney (mGy) Small Intestine (mGy) Colon (mGy) Urinary Bladder (mGy) AEC Measured 300 (187) 13 13.9 ± 0.6 16.8 ± 0.2 18.8 ± 0.2 13.2 ± 0.3 19.9 ± 0.3 30 ± 0.3 Estimated 300 (187) 13 23.6 ± 0.6 (41%) ( P < 0.001) 22.7 ± 0.8 (26%)
( P < 0.001) 24.9 ± 0.8 (38%)
( P = 0.3) 21.1 ± 0.1 (38%) ( P < 0.001) 20.9 ± 1.1 (5%) ( P = 0.2) 22.8 ± 2.3 (−32%) ( P = 0.005) Measured 200 (118) 8 9.5 ± 0.1 11.5 ± 0 12.4 ± 0 9 ± 0 13.5 ± 0 16 ± 0 Estimated 200 (118) 8 14.7 ± 0.1 (35%) ( P < 0.001) 14 ± 0.1 (18%) ( P < 0.001) 15.6 ± 0.1
(32%) ( P = 0.005) 13.3 ± 0.1 (32%) ( P < 0.001) 13.5 ± 0.1 (0%) ( P < 0.8) 15.1 ± 0.2 (−6%) ( P = 0.02) Measured 100 (58) 4 4.8 ± 0.5 5.7 ± 0.1 6.2 ± 0.1 4.5 ± 0.1 6.7 ± 0 8.2 ± 0.2 Estimated 100 (58) 4 7.2 ± 0 (33%) ( P < 0.001) 6.9 ± 0 (18%) ( P < 0.001) 7.7 ± 0
(32%) ( P = 0.004) 6.6 ± 0
(32%) ( P < 0.001) 6.7 ± 0 (1%) ( P < 0.6) 7.5 ± 0
(−9%) ( P = 0.006) Fixed mAs Measured 300 21 27.5 ± 0.5 36.2 ± 0.3 31.8 ± 0.4 27.6 ± 1.3 34.7 ± 0.1 41.3 ± 1.2 Estimated 300 21 37 ± 0
(26%) ( P < 0.001) 35.3 ± 0 (−2%) ( P < 0.009) 39.4 ± 0
(18%) ( P = 0.002) 33.7 ± 0
(18%) ( P < 0.002) 34.2 ± 0 (1%) ( P < 0.004) 38.4 ± 0
(−8%) ( P = 0.02) Measured 200 14 18.6 ± 0.5 24.7 ± 0.5 21.5 ± 0 18.2 ± 0.4 23.4 ± 0.1 27.7 ± 0.8 Estimated 200 14 23.8 ± 1.9 (22%) ( P = 0.01) 22.1 ± 3.1 (−12%) ( P = 0.2) 26 ± 2
(19%) ( P = 0.1) 22.5 ± 0.1 (19%) ( P < 0.001) 22.8 ± 0
(−3%) ( P < 0.001) 25.6 ± 0.3 (−8%) ( P = 0.01) Measured 100 7 9.1 ± 0.1 12.4 ± 0.1 10.7 ± 0.1 9.5 ± 0.3 11.8 ± 0 14.5 ± 0.1 Estimated 100 7 12 ± 0.3 (24%) ( P < 0.001) 11.3 ± 0.5 (−10%) ( P = 0.02) 13 ± 0.4
(15%) ( P = 0.01) 11.2 ± 0
(15%) ( P < 0.002) 11.4 ± 0
(−4%) ( P < 0.001) 12.9 ± 0.1 (−12%) ( P < 0.001)
Get Radiology Tree app to read full this article<
Get Radiology Tree app to read full this article<
Get Radiology Tree app to read full this article<
Get Radiology Tree app to read full this article<
Get Radiology Tree app to read full this article<
Table 4
The Extent of Variation between CTDI vol and Organ Doses (Both Measured and Estimated Organ Doses). The Numbers in Parenthesis Represent Organ Dose/CTDI vol . The Percentage Numbers Represent the Deviation of the Organ Dose from the CTDI vol
Type mAs CTDIvol (mGy) Stomach (mGy) Liver (mGy) Left Kidney (mGy) Small Intestine (mGy) Colon (mGy) Urinary Bladder (mGy) Ave (mGy) AEC Measured 300 (187) 13 13.9 ± 0.6
7%
(13.9/13) 16.8 ± 0.2
30%
(16.8/13) 18.8 ± 0.2
44%
(18.8/13) 13.2 ± 0.3
2%
(13.2/13) 19.9 ± 0.3
53%
(19.9/13) 30 ± 0.3
131%
(30/13) 18.8
44%
(18.8/13) Estimated 300 (187) 13 23.6 ± 0.6
82%
(23.6/13) 22.7 ± 0.8 75%
(22.7/13) 24.9 ± 0.8 92%
(19.3/13) 21.1 ± 0.1
62%
(21.1/13) 20.9 ± 1.1 61%
(21/13) 22.8 ± 2.3 75%
(22.8/13) 21.7
67%
(21.7/13) Measured 200 (118) 8 9.5 ± 0.1
19%
(9.5/8) 11.5 ± 0
44%
(11.5/8) 12.4 ± 0
56%
(12.4/8) 9 ± 0
13%
(9/8) 13.5 ± 0
69%
(13.5/8) 16 ± 0
100%
(16/8) 12
50%
(12/8) Estimated 200 (118) 8 14.7 ± 0.1
84%
(14.7/8) 14 ± 0.1
75%
(14/8) 15.5 ± 0.1 95%
(12/8) 13.3 ± 0.1
66%
(13.3/8) 13.5 ± 0.1
69%
(13.5/8) 15.1 ± 0.2
89%
(15.1/8) 13.8
72%
(13.8/8) Measured 100 (58) 4 4.8 ± 0.5
21%
(4.8/4) 5.7 ± 0.1
42%
(5.7/4) 6.2 ± 0.1
57%
(6.2/4) 4.5 ± 0.1
13%
(4.5/4) 6.7 ± 0
66%
(6.7/4) 8.2 ± 0.2
104%
(8.2/4) 6
50%
(6/4) Estimated 100 (58) 4 7.2 ± 0
80%
(7.2/4) 6.9 ± 0 73%
(6.9/4) 7.7 ± 0
93%
(5.9/4) 6.6 ± 0
65%
(6.6/4) 6.7 ± 0 68%
(6.7/4) 7.5 ± 0
88%
(7.5/4) 6.8
70%
(6.8/4) Fixed mAs Measured 300 21 27.5 ± 0.5
31%
(27.5/21) 36.2 ± 0.3
72%
(36.2/21) 31.8 ± 0.4
51%
(31.8/21) 27.6 ± 1.3
31%
(27.6/21) 34.7 ± 0.1
65%
(34.7/21) 41.3 ± 1.2
97%
(41.3/21) 33.2
47%
(33.2/21) Estimated 300 21 37 ± 0
76%
(37/21) 35.3 ± 0
68%
(35.3/21) 39.4 ± 0
88%
(30/21) 33.7 ± 0
61%
(33.7/21) 34.2 ± 0
63%
(34.2/21) 38.4 ± 0
83%
(38.4/21) 34.8
66%
(34.8/21) Measured 200 14 18.6 ± 0.5
33%
(18.6/14) 24.7 ± 0.5
76%
(24.7/14) 21.5 ± 0
53%
(21.5/14) 18.2 ± 0.4
30%
(18.2/14) 23.4 ± 0.1
67%
(23.4/14) 27.7 ± 0.8
98%
(27.7/14) 22.3
60%
(22.3/14) Estimated 200 14 23.8 ± 1.9
70%
(23.8/14) 22.1 ± 3.1
58%
(22.1/14) 26 ± 2
86%
(19.2/14) 22.5 ± 0.1
61%
(22.5/14) 22.8 ± 0
63%
(22.8/14) 25.6 ± 0.3
83%
(25.6/14) 22.7
62%
(22.7/14) Measured 100 7 9.1 ± 0.1
30%
(9.1/7) 12.4 ± 0.1
78%
(12.4/7) 10.7 ± 0.1
53%
(10.7/7) 9.5 ± 0.3
36%
(9.5/7) 11.8 ± 0
69%
(11.8/7) 14.5 ± 0.1
107%
(14.5/7) 11.4
62%
(11.4/7) Estimated 100 7 12 ± 0.3
71%
(12/7) 11.3 ± 0.5
61%
(11.3/7) 13 ± 0.4 86%
(9.6/7) 11.2 ± 0
60%
(11.2/7) 11.4 ± 0
63%
(11.4/7) 12.9 ± 0.1
84%
(12.9/7) 11.4
63%
(11.4/7)
Get Radiology Tree app to read full this article<
Discussion
Get Radiology Tree app to read full this article<
Get Radiology Tree app to read full this article<
Get Radiology Tree app to read full this article<
Get Radiology Tree app to read full this article<
Get Radiology Tree app to read full this article<
Get Radiology Tree app to read full this article<
Get Radiology Tree app to read full this article<
Acknowledgement
Get Radiology Tree app to read full this article<
References
1. McCollough C.H., Leng S., Yu L., et. al.: CT dose index and patient dose: they are not the same thing. Radiology 2011; 259: pp. 311-316.
2. Oono T., Araki F., Tsuduki S., et. al.: Monte Carlo calculation of patient organ doses from computed tomography. Radiol Phys Technol 2014; 7: pp. 176-182.
3. Dixon R.L.: A new look at CT dose measurement: beyond CTDI. Med Phys 2003; 30: pp. 1272-1280.
4. Abdullah A., Sun Z., Pongnapang N., et. al.: Comparison of computed tomography dose reporting software. Radiat Prot Dosimetry 2012; 151: pp. 153-157.
5. Dixon R.L., Ballard A.C.: Experimental validation of a versatile system of CT dosimetry using a conventional ion chamber: beyond CTDI100. Med Phys 2007; 34: pp. 3399-3413.
6. Li X., Zhang D., Liu B.: Monte Carlo assessment of CT dose equilibration in PMMA and water cylinders with diameters from 6 to 55 cm. Med Phys 2013; 40: pp. 31903-31910.
7. Brink J.A., Morin R.L.: Size-specific dose estimation for CT: how should it be used and what does it mean?. Radiology 2012; 265: pp. 666-668.
8. The American Association of Physicists in Medicine : Report of AAPM Task Group 111: the future of CT dosimetry. Comprehensive methodology for the evaluation of radiation dose in X-ray computed tomography. Available at: https://www.aapm.org/pubs/reports/RPT_111.pdf Accessed January 29, 2015
9. Deak P., van Straten M., Shrimpton P.C., et. al.: Validation of a Monte Carlo tool for patient-specific dose simulations in multi-slice computed tomography. Eur Radiol 2008; 18: pp. 759-772.
10. Ay M.R., Zaidi H.: Development and validation of MCNP4C-based Monte Carlo simulator for fan- and cone-beam X-ray CT. Phys Med Biol 2005; 50: pp. 4863-4885.
11. DeMarco J.J., Cagnon C.H., Cody D.D., et. al.: Estimating radiation doses from multidetector CT using Monte Carlo simulations: effects of different size voxelized patient models on magnitudes of organ and effective dose. Phys Med Biol 2007; 52: pp. 2583-2597.
12. Gu J., Bednarz B., Caracappa P.F., et. al.: The development, validation and application of a multi-detector CT (MDCT) scanner model for assessing organ doses to the pregnant patient and the fetus using Monte Carlo simulations. Phys Med Biol 2009; 54: pp. 2699-2717.
13. Staton R.J., Lee C., Lee C., et. al.: Organ and effective doses in newborn patients during helical multislice computed tomography examination. Phys Med Biol 2006; 51: pp. 5151-5166.
14. Turner A.C., Zankl M., DeMarco J.J., et. al.: The feasibility of a scanner-independent technique to estimate organ dose from MDCT scans: using CTDIvol to account for differences between scanners. Med Phys 2010; 37: pp. 1816-1825.
15. Turner A.C., Zhang D., Khatonabadi M., et. al.: The feasibility of patient size-corrected, scanner-independent organ dose estimates for abdominal CT exams. Med Phys 2011; 38: pp. 820-829.
16. Ding A., Mille M., Liu T., et. al.: Extension of RPI-adult male and female computational phantoms to obese patients and a Monte Carlo study of the effect on CT imaging dose. Phys Med Biol 2012; 57: pp. 2441-2459.
17. Minnit R., Shobe J., Seltzer S.M., et. al.: Absorbed dose to water calibration of ionization chambers in a 60 Co Gamma-ray beam. NIST Special Publication 250-74. Available at: http://www.nist.gov/calibrations/upload/sp250_74.pdf Accessed June 20, 2014
18. Christner J.A., Kofler J.M., McCollough C.H.: Estimating effective dose for CT using dose-length product compared with using organ doses: consequences of adopting International Commission on Radiological Protection publication 103 or dual-energy scanning. AJR Am J Roentgenol 2010; 194: pp. 881-889.
19. International Commission on Radiological Protection : 1990 recommendations of the International Commission on Radiological Protection. Ann ICRP 1991; 21: Publication no. 60
20. International Commission on Radiological Protection : 2007 recommendations of the International Commission on Radiological Protection. Ann ICRP 2007; 37: Publication no. 103
21. Ding A., Gao Y., Liu H., et. al.: VirtualDose: a software for reporting organ doses from CT for adult and pediatric patients. Phys Med Biol 2015; 60: pp. 5601-5625.
22. Zhang D, Padole A, Li X, et. al.: In vitro dose measurements in a human cadaver with abdomen/pelvis CT scans. Med Phys 2014; 41: pp. 091911.
23. Griglock T.M., Sinclair L., Mench A., et. al.: Determining organ doses from CT with direct measurements in postmortem subjects: part 1-methodology and validation. Radiology 2015; 277: pp. 463-470.
24. Bou Serhal C., van Steenberghe D., Bosmans H., et. al.: Organ radiation dose assessment for conventional spiral tomography: a human cadaver study. Clin Oral Implants Res 2001; 12: pp. 85-90.
25. Mueller J.W., Vining D.J., Jones A.K., et. al.: Journal club: in vivo ct dosimetry during CT colonography. AJR Am J Roentgenol 2014; 202: pp. 703-710.
26. Kalra M.K., Maher M.M., Toth T.L., et. al.: Comparison of Z-axis automatic tube current modulation technique with fixed tube current CT scanning of abdomen and pelvis. Radiology 2004; 232: pp. 347-353.
27. Mulkens T.H., Bellinck P., Baeyaert M., et. al.: Use of an automatic exposure control mechanism for dose optimization in multi-detector row CT examinations: clinical evaluation. Radiology 2005; 237: pp. 213-223.
28. Lee S., Yoon S.W., Yoo S.M., et. al.: Comparison of image quality and radiation dose between combined automatic tube current modulation and fixed tube current technique in CT of abdomen and pelvis. Acta Radiol 2011; 52: pp. 1101-1106.
29. Zhang D., Li X., Gao Y., et. al.: A method to acquire CT organ dose map using OSL dosimeters and ATOM anthropomorphic phantoms. Med Phys 2013; 40: pp. 8191-8199.
30. Söderberg M., Gunnarsson M.: Automatic exposure control in computed tomography–an evaluation of systems from different manufacturers. Acta Radiol 2010; 51: pp. 625-634.