
Rationale and objectives
We sought to explore the feasibility and diagnostic performance of dual-energy computed tomography (DECT) versus single-energy computed tomography (SECT) for the evaluation of myocardial perfusion in patients with intermediate to high likelihood of coronary artery disease.
Materials and Methods
The present prospective study involved patients with known or suspected coronary artery disease referred for myocardial perfusion imaging by single-photon emission computed tomography. Forty patients were included in the study protocol and scanned using DECT imaging ( n = 20) or SECT imaging ( n = 20). The same pharmacologic stress was used for DECT, SECT, and single-photon emission computed tomography scans.
Results
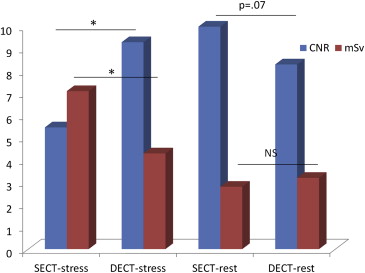
A total of 1360 left ventricular segments were evaluated by DECT and SECT. The contrast-to-noise ratio was similar between groups (DECT 8.8 ± 2.9 vs. SECT 7.7 ± 4.2; P = .22). The diagnostic performance of DECT was greater than that of SECT in identifying perfusion defects (area under the receiver operating characteristic curve of DECT 0.90 [0.86–0.94] vs SECT 0.80 [0.76–0.84]; P = .0004) and remained unaffected when including only segments affected by beam-hardening artifacts (area under the receiver operating characteristic curve = DECT 0.90 [0.84–0.96) vs. SECT 0.77 [0.69–0.84]; P = .007).
Conclusions
Our results suggest that myocardial perfusion by DECT imaging is feasible and might have improved diagnostic performance compared to SECT imaging for the assessment of myocardial CT perfusion. Furthermore, the diagnostic performance of DECT remained unaffected by the presence of beam-hardening artifacts.
Until recently, coronary computed tomography angiography (CCTA) was limited to the anatomic assessment of coronary obstructions in patients with low to intermediate likelihood of coronary artery disease (CAD), whereas the functional significance of coronary stenoses remained outside its scope. Several studies have demonstrated the ability of CCTA to perform myocardium perfusion studies by using stress vasodilator agents . However, the clinical use of stress myocardium computed tomography (CT) perfusion is somewhat limited, mostly by technical issues including beam-hardening artifacts (BHAs), which are originated by the polychromatic nature of x-rays and the energy dependency of x-ray attenuation, and are related to a considerable myocardial signal density (SD) drop at regions in close proximity to highly attenuated structures, thus resembling perfusion defects .
With the advent of dual-energy computed tomography (DECT) imaging, BHAs could be reduced with the generation of synthesized monochromatic image reconstruction . We therefore sought to explore the feasibility and diagnostic performance of DECT versus single-energy computed tomography (SECT) for the evaluation of myocardial perfusion defects assessed by single-photon emission computed tomography (SPECT) in patients with intermediate to high likelihood of CAD. Furthermore, we sought to compare the diagnostic performance of DECT versus SECT among myocardial regions with high prevalence of BHAs.
Methods
Study Population
Get Radiology Tree app to read full this article<
Get Radiology Tree app to read full this article<
Get Radiology Tree app to read full this article<
CT Perfusion Acquisition
Get Radiology Tree app to read full this article<
Get Radiology Tree app to read full this article<
Get Radiology Tree app to read full this article<
Dual-Energy CT
Get Radiology Tree app to read full this article<
Get Radiology Tree app to read full this article<
Single-Energy CT
Get Radiology Tree app to read full this article<
Get Radiology Tree app to read full this article<
SPECT Myocardial Perfusion Imaging
Get Radiology Tree app to read full this article<
CT Perfusion Analysis
Get Radiology Tree app to read full this article<
Get Radiology Tree app to read full this article<
Get Radiology Tree app to read full this article<
Get Radiology Tree app to read full this article<
Get Radiology Tree app to read full this article<
Get Radiology Tree app to read full this article<
Get Radiology Tree app to read full this article<
Get Radiology Tree app to read full this article<
Statistical Analysis
Get Radiology Tree app to read full this article<
Results
Get Radiology Tree app to read full this article<
Image Quality and Effective Radiation Dose
Get Radiology Tree app to read full this article<
Get Radiology Tree app to read full this article<
Get Radiology Tree app to read full this article<
Table 1
Effective Radiation Doses
Scan Radiation Dose (mSV)P Value SPECT vs. DECT SECT SPECT DECT SECT Stress 4.3 ± 1.0 7.1 ± 2.6 ∗ Rest 3.2 ± 0.4 2.8 ± 2.1 † Total 7.4 ± 1.1 9.9 ± 3.8 ‡ 8.8 ± 2.0 0.06 0.41
DECT, dual-energy computed tomography; SECT, single-energy computed tomography; SPECT, single-photon emission computed tomography.
Get Radiology Tree app to read full this article<
Get Radiology Tree app to read full this article<
Get Radiology Tree app to read full this article<
Get Radiology Tree app to read full this article<
Diagnostic Performance of DECT Versus SECT
Get Radiology Tree app to read full this article<
Get Radiology Tree app to read full this article<
Get Radiology Tree app to read full this article<
Get Radiology Tree app to read full this article<
Get Radiology Tree app to read full this article<
Get Radiology Tree app to read full this article<
Get Radiology Tree app to read full this article<
Table 2
Diagnostic Performance of SECT and DECT
Diagnostic performance SECT DECT SECT BHA DECT BHA Sensitivity (%) 70.3 (63.9–76.1) 82.8 (75.1–88.9) 69.1 (56.6–79.5) 86.6 (71.9–94.3) Specificity (%) 90.7 (87.6–93.2) 96.7 (94.9–98.1) 84.1 (76.5–89.7) 93.6 (88.2–96.7) Positive predictive value (%) 79.3 (73.0–84.7) 85.5 (78.0–91.2) 69.1 (56.6–79.5) 79.2 (64.6–89.0) Negative predictive value (%) 85.7 (82.2–88.7) 96.0 (94.1–97.5) 84.1 (76.5–89.7) 96.1 (91.2–98.4) Positive likelihood ratio 7.5 (5.6–10.2) 25.4 (16.1–40.2) 4.3 (2.8–6.6) 13.5 (7.3–24.8) Negative likelihood ratio 0.33 (0.27–0.40) 0.18 (0.12–0.25) 0.37 (0.26–0.52) 0.15 (0.07–0.31) Diagnostic odds ratio 23.1 (14.8–36.2) 142.9 (70.9–291.7) 11.8 (5.9–23.7) 92.5 (31.6–270.4) Area under the curve (ROC) 0.80 (0.76–0.84) 0.90 (0.86–0.94) 0.77 (0.69–0.84) 0.90 (0.84–0.96)
BHA, beam-hardening artifact; DECT, dual-energy computed tomography; ROC, receiver operating characteristic; SECT, single-energy computed tomography.
Get Radiology Tree app to read full this article<
Analysis Including Segments Affected by BHAs
Get Radiology Tree app to read full this article<
Get Radiology Tree app to read full this article<
Discussion
Get Radiology Tree app to read full this article<
Get Radiology Tree app to read full this article<
Get Radiology Tree app to read full this article<
Get Radiology Tree app to read full this article<
Get Radiology Tree app to read full this article<
Get Radiology Tree app to read full this article<
Get Radiology Tree app to read full this article<
Get Radiology Tree app to read full this article<
Get Radiology Tree app to read full this article<
Limitations
Get Radiology Tree app to read full this article<
Conclusions
Get Radiology Tree app to read full this article<
Get Radiology Tree app to read full this article<
References
1. Ko B.S., Cameron J.D., Leung M., et. al.: Combined CT coronary angiography and stress myocardial perfusion imaging for hemodynamically significant stenoses in patients with suspected coronary artery disease: a comparison with fractional flow reserve. JACC Cardiovasc Imaging 2012; 5: pp. 1097-1111.
2. Bamberg F., Becker A., Schwarz F., et. al.: Detection of hemodynamically significant coronary artery stenosis: incremental diagnostic value of dynamic CT-based myocardial perfusion imaging. Radiology 2011; 260: pp. 689-698.
3. Rocha-Filho J.A., Blankstein R., Shturman L.D., et. al.: Incremental value of adenosine-induced stress myocardial perfusion imaging with dual-source CT at cardiac CT angiography. Radiology 2010; 254: pp. 410-419.
4. Ko S.M., Choi J.W., Hwang H.K., et. al.: Diagnostic performance of combined noninvasive anatomic and functional assessment with dual-source CT and adenosine-induced stress dual-energy CT for detection of significant coronary stenosis. AJR Am J Roentgenol 2012; 198: pp. 512-520.
5. Rodríguez-Granillo G.A., Rosales M.A., Degrossi E., et. al.: Signal density of left ventricular myocardial segments and impact of beam hardening artifact: implications for myocardial perfusion assessment by multidetector CT coronary angiography. Int J Cardiovasc Imaging 2010; 26: pp. 345-354.
6. So A., Lee T.Y., Imai Y., et. al.: Quantitative myocardial perfusion imaging using rapid kVp switch dual-energy CT: preliminary experience. J Cardiovasc Comput Tomogr 2011; 5: pp. 430-442.
7. Gibbons R.J., Balady G.J., Bricker J.T., et. al., American College of Cardiology/American Heart Association Task Force on Practice Guidelines. Committee to Update the 1997 Exercise Testing Guidelines : ACC/AHA 2002 guideline update for exercise testing: summary article. A report of the American College of Cardiology/American Heart Association Task Force on Practice Guidelines (Committee to Update the 1997 Exercise Testing Guidelines). J Am Coll Cardiol 2002; 40: pp. 1531-1540.
8. Pryor D.B., Shaw L., McCants C.B., et. al.: Value of the history and physical in identifying patients at increased risk for CAD. Ann Intern Med 1993; 118: pp. 81-90.
9. Halliburton S.S., Abbara S., Chen M.Y., et. al.: Society of Cardiovascular Computed Tomography. SCCT guidelines on radiation dose and dose-optimization strategies in cardiovascular CT. J Cardiovasc Comput Tomogr 2011; 5: pp. 198-224.
10. Carrascosa P., Rodriguez-Granillo G.A., Capunay C., et. al.: Low-dose CT coronary angiography using iterative reconstruction with a 256-slice CT scanner. World J Cardiol 2013; 5: pp. 382-386.
11. Cerqueira M.D., Weissman N.J., Dilsizian V., et. al., American Heart Association Writing Group on Myocardial Segmentation and Registration for Cardiac Imaging : Standardized myocardial segmentation and nomenclature for tomographic imaging of the heart: a statement for healthcare professionals from the Cardiac Imaging Committee of the Council on Clinical Cardiology of the American Heart Association. Circulation 2002; 105: pp. 539-542.
12. Dorbala S., Di Carli M.F., Delbeke D., et. al.: SNMMI/ASNC/SCCT Guideline for Cardiac SPECT/CT and PET/CT 1.0. J Nucl Med 2013; 54: pp. 1485-1507.
13. Park S.H., Goo J.M., Jo C.H.: Receiver operating characteristic (ROC) curve: practical review for radiologists. Korean J Radiol 2004; 5: pp. 11-18.
14. Metz C.E.: Some practical issues of experimental design and data analysis in radiologic ROC studies. Invest Radiol 1989; 24: pp. 234-245.
15. Hanley J.A., McNeil B.J.: The meaning and use of the area under a receiver operating characteristic (ROC) curve. Radiology 1982; 143: pp. 29-36.
16. Arbab-Zadeh A., Miller J.M., Rochitte C.E., et. al.: Diagnostic accuracy of computed tomography coronary angiography according to pre-test probability of coronary artery disease and severity of coronary arterial calcification. The CORE-64 (Coronary Artery Evaluation Using 64-Row Multidetector Computed Tomography Angiography) International Multicenter Study. J Am Coll Cardiol 2012; 59: pp. 379-387.
17. Meijboom W.B., van Mieghem C.A.G., Mollet N.R., et. al.: 64-Slice computed tomography coronary angiography in patients with high, intermediate, or low pretest probability of significant coronary artery disease. J Am Coll Cardiol 2007; 50: pp. 1469-1475.
18. Pijls N.H., van Schaardenburgh P., Manoharan G., et. al.: Percutaneous coronary intervention of functionally nonsignificant stenosis: 5-year follow-up of the DEFER Study. J Am Coll Cardiol 2007; 49: pp. 2105-2111.
19. Tonino P.A., De Bruyne B., Pijls N.H., et. al., FAME Study Investigators : Fractional flow reserve versus angiography for guiding percutaneous coronary intervention. N Engl J Med 2009; 360: pp. 213-224.
20. Meijboom W.B., Van Mieghem C.A., van Pelt N., et. al.: Comprehensive assessment of coronary artery stenoses: computed tomography coronary angiography versus conventional coronary angiography and correlation with fractional flow reserve in patients with stable angina. J Am Coll Cardiol 2008; 52: pp. 636-643.
21. Rodríguez-Granillo G.A., Ingino C.A., Lylyk P.: Myocardial perfusion imaging and infarct characterization using multidetector cardiac computed tomography. World J Cardiol 2010; 2: pp. 198-204.
22. Yoon Y.E., Choi J.H., Kim J.H., et. al.: Noninvasive diagnosis of ischemia-causing coronary stenosis using CT angiography: diagnostic value of transluminal attenuation gradient and fractional flow reserve computed from coronary CT angiography compared to invasively measured fractional flow reserve. JACC Cardiovasc Imaging 2012; 5: pp. 1088-1096.
23. Arnoldi E., Lee Y.S., Ruzsics B., et. al.: CT detection of myocardial blood volume deficits: dual-energy CT compared with single-energy CT spectra. J Cardiovasc Comput Tomogr 2011; 5: pp. 421-429.
24. Min J.K., Leipsic J., Pencina M.J., et. al.: Diagnostic accuracy of fractional flow reserve from anatomic CT angiography. JAMA 2012; 308: pp. 1237-1245.
25. Labounty T.M., Leipsic J., Min J.K., et. al.: Effect of padding duration on radiation dose and image interpretation in prospectively ECG-triggered coronary CT angiography. AJR Am J Roentgenol 2010; 194: pp. 933-937.