
Rationale and Objectives
To evaluate a natural language processing (NLP) system built with open-source tools for identification of lumbar spine imaging findings related to low back pain on magnetic resonance and x-ray radiology reports from four health systems.
Materials and Methods
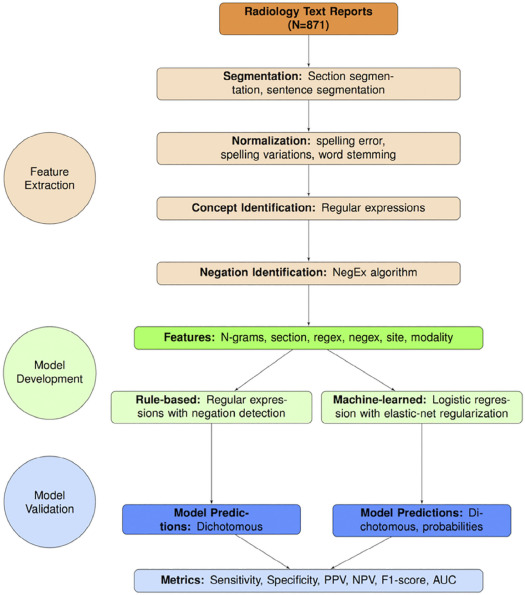
We used a limited data set (de-identified except for dates) sampled from lumbar spine imaging reports of a prospectively assembled cohort of adults. From N = 178,333 reports, we randomly selected N = 871 to form a reference-standard dataset, consisting of N = 413 x-ray reports and N = 458 MR reports. Using standardized criteria, four spine experts annotated the presence of 26 findings, where 71 reports were annotated by all four experts and 800 were each annotated by two experts. We calculated inter-rater agreement and finding prevalence from annotated data. We randomly split the annotated data into development (80%) and testing (20%) sets. We developed an NLP system from both rule-based and machine-learned models. We validated the system using accuracy metrics such as sensitivity, specificity, and area under the receiver operating characteristic curve (AUC).
Results
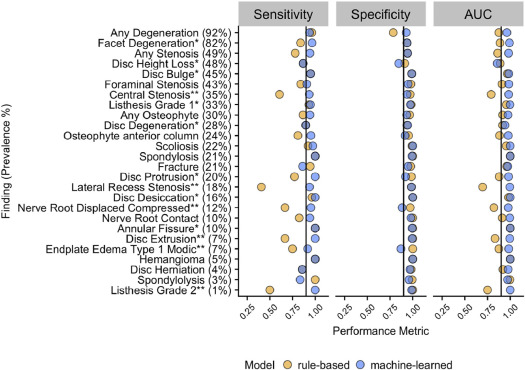
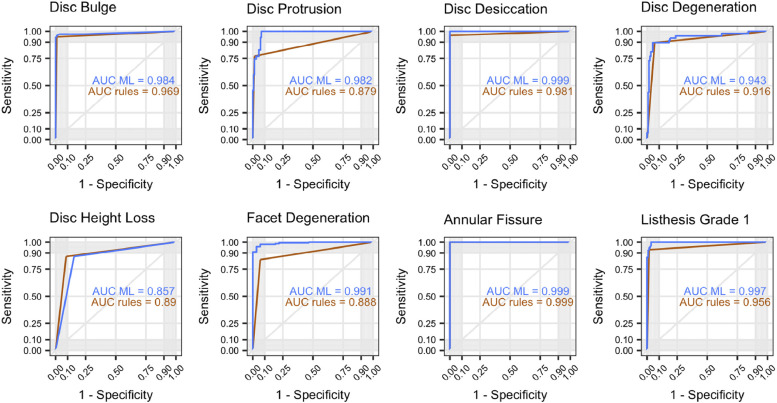
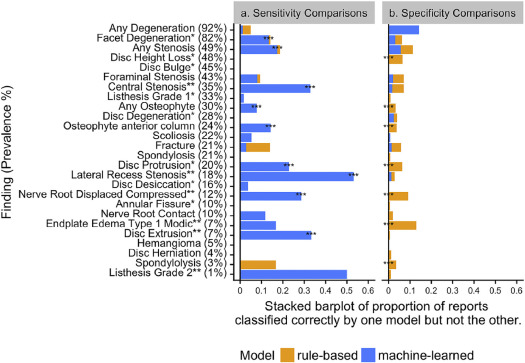
The multirater annotated dataset achieved inter-rater agreement of Cohen’s kappa > 0.60 (substantial agreement) for 25 of 26 findings, with finding prevalence ranging from 3% to 89%. In the testing sample, rule-based and machine-learned predictions both had comparable average specificity (0.97 and 0.95, respectively). The machine-learned approach had a higher average sensitivity (0.94, compared to 0.83 for rules-based), and a higher overall AUC (0.98, compared to 0.90 for rules-based).
Conclusions
Our NLP system performed well in identifying the 26 lumbar spine findings, as benchmarked by reference-standard annotation by medical experts. Machine-learned models provided substantial gains in model sensitivity with slight loss of specificity, and overall higher AUC.
Introduction
Low back pain (LBP) has an estimated global lifetime prevalence of almost 40% . In the United States, LBP is the second most common symptom prompting physician visits (after respiratory infections), with an estimated annual cost of over $100 billion . Despite numerous available interventions for this common and burdensome condition, LBP remains difficult to diagnose and to treat effectively . One difficulty in addressing LBP is substantial heterogeneity in its etiology, progression, and response to treatment. For instance, a clinical presentation of LBP could be caused by reasons ranging from minor muscle strains to malignant tumor .
The discovery of patient subgroups with similar prognoses and intervention recommendations is a research priority for advancing LBP care . Spine imaging findings may help define such subgroups. In most cases, imaging findings alone are insufficient to diagnose the underlying reasons for LBP. Furthermore, even when present, imaging findings are often of uncertain clinical significance given their frequent presence in asymptomatic individuals . Yet, certain imaging findings, such as endplate changes, are more prevalent in patients with LBP compared to nonclinical populations . To understand relationships between imaging findings and LBP, an important step is the accurate extraction of findings, such as stenosis and disc herniation, from large patient cohorts.
Get Radiology Tree app to read full this article<
Get Radiology Tree app to read full this article<
Materials and Methods
Reference-standard Dataset
Get Radiology Tree app to read full this article<
TABLE 1
Reference-standard Annotated Dataset
N in Dataset Average Document Length (number of words) Average Age in years Men (%) Kaiser Permanente of Washington x-ray 102 1073 ± 212 70.4 ± 13.9 40.2 MR 115 2141 ± 731 58.9 ± 14.4 51.3 Total 217 1639 ± 767 64.3 ± 15.2 46.1 Kaiser Permanente of Northern California x-ray 104 1054 ± 235 67.5 ± 16.8 39.4 MR 114 1953 ± 647 57.1 ± 15.0 47.4 Total 218 1524 ± 668 62.1 ± 16.9 43.6 Henry Ford Health System x-ray 103 1129 ± 323 67.2 ± 16.0 28.2 MR 115 2130 ± 986 59.2 ± 16.0 49.6 Total 218 1657 ± 901 63.0 ± 16.4 39.4 Mayo Clinic Health System x-ray 103 1094 ± 280 69.4 ± 16.2 38.8 MR 115 1722 ± 645 55.1 ± 15.4 41.7 Total 218 1425 ± 595 61.9 ± 17.3 40.4 All x-ray 413 1088 ± 266 68.6 ± 15.8 36.7 MR 458 1987 ± 782 57.6 ± 15.2 47.5 Total 871 1561 ± 746 62.8 ± 16.4 42.4
MR, magnetic resonance imaging.
Values after ± are standard deviations.
Get Radiology Tree app to read full this article<
Get Radiology Tree app to read full this article<
TABLE 2
List of 26 Findings Identified by NLP System
Type of Finding Imaging Finding RadLex ID Deformities Listhesis—Grade 1 \* RID4780 ‡ Listhesis—Grade 2 or higher † RID4780 ‡ Scoliosis RID4756 Fracture Fracture RID4658,4699,49608 Spondylosis RID5121 Anterior column degeneration Annular Fissure \* RID4716-7, RID4721-3 Disc Bulge \* RID5089 Disc Degeneration \* RID5086 Disc Desiccation \* RID5087 Disc Extrusion † RID5094-6 Disc Height Loss \* RID5088 Disc Herniation RID5090 Disc Protrusion \* RID5091-3 Endplate Edema or Type 1 Modic † RID5110 Osteophyte—anterior column RID5079 Posterior column degeneration Any Stenosis RID5028-34 Facet Degeneration \* NA Associated with leg pain Central Stenosis † RID5029-32 Foraminal Stenosis RID5034 Nerve Root Contact NA Nerve Root Displaced or Compressed † NA Lateral Recess Stenosis † NA Nonspecific findings and other Any Degeneration RID5085 Hemangioma RID3969 Spondylolysis RID5120 Any Osteophytes RID5076,RID5078-9,RID5081
Any stenosis refers to stenosis at any location (central, foraminal, or lateral recess) or not otherwise specified. Any degeneration refers to any of disc degeneration, facet degeneration, or degeneration not otherwise specified.
Get Radiology Tree app to read full this article<
Get Radiology Tree app to read full this article<
Get Radiology Tree app to read full this article<
Get Radiology Tree app to read full this article<
Get Radiology Tree app to read full this article<
NLP System
Get Radiology Tree app to read full this article<
Get Radiology Tree app to read full this article<
Get Radiology Tree app to read full this article<
Get Radiology Tree app to read full this article<
Get Radiology Tree app to read full this article<
Statistical Analyses
Get Radiology Tree app to read full this article<
Get Radiology Tree app to read full this article<
Get Radiology Tree app to read full this article<
Get Radiology Tree app to read full this article<
Results
Get Radiology Tree app to read full this article<
Reference-standard Dataset Characteristics
Get Radiology Tree app to read full this article<
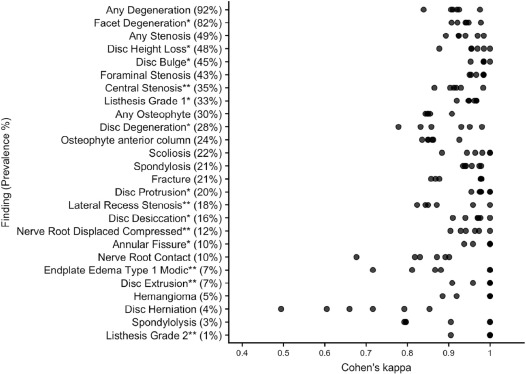
TABLE 3
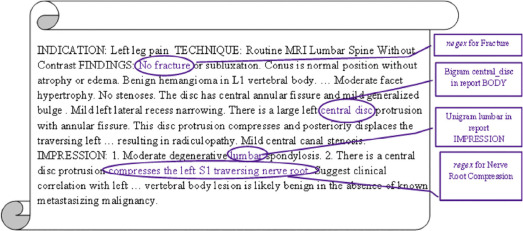
Text Excerpts from Reference-Standard Dataset
Finding Text Excerpts Disc herniation …degenerative change is evident at L2-L3 and… disc herniation is not excluded . Essentially unremarkable. L3-4: Minimal left posterior lateral focal herniation… right laminotomy. No definite disc herniation. Mild nonmasslike enhancing tissue… Endplate edema or type 1 Modic …S1 superior endplate with surrounding edema suggesting element of acuity… …high signal intensity on T2 and low signal intensity on T1 suggestive of acute to subacute superior endplate deformity.Minimal edema in the superior L5 endplate with more chronic appearance. Lateral recess stenosis Narrowing of the spine canal and lateral recesses and the right neuroforamen… …displaces the traversing left S1 nerve root in the left nerve root in the left lateral recess… …eccentric to the left with a left foraminal and far lateral component compressing the exiting left… Nerve root displaced or compressed Severe facet arthrosis with a diffusely bulging annulus causes moderate to severe central stenosis with redundant nerve roots above and below the interspace level. There is granulation tissue surrounding the descending right S1 nerve root… …has minimal mass effect on the descending left S1 nerve root…
Examples of report text from the reference-standard dataset show ambiguity in report text for the two findings with lower inter-rater agreement: Disc herniation (kappa = 0.49) and endplate edema (kappa = 0.72), and reports that were “missed” by rule-based but “found” by machine-learned models for lateral recess stenosis and nerve root displaced or compressed.
An ellipsis (…) indicates omitted raw text. Words in italics refer to ambiguous language.
Get Radiology Tree app to read full this article<
NLP System Performances
Get Radiology Tree app to read full this article<
Get Radiology Tree app to read full this article<
Get Radiology Tree app to read full this article<
Get Radiology Tree app to read full this article<
Comparison of Rules-based and Machine-Learned Models
Get Radiology Tree app to read full this article<
Get Radiology Tree app to read full this article<
Get Radiology Tree app to read full this article<
Get Radiology Tree app to read full this article<
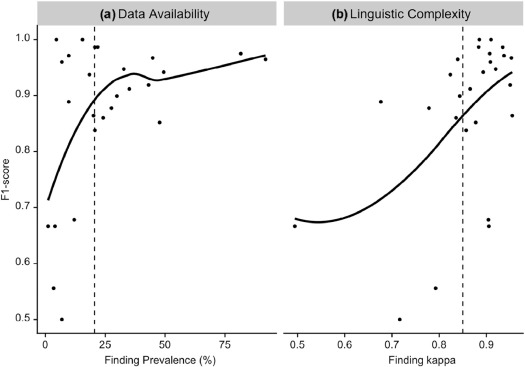
Effect of Data Availability and Linguistic Complexity on Machine-learned Models
Get Radiology Tree app to read full this article<
Get Radiology Tree app to read full this article<
Get Radiology Tree app to read full this article<
Get Radiology Tree app to read full this article<
Discussion
Get Radiology Tree app to read full this article<
Get Radiology Tree app to read full this article<
Get Radiology Tree app to read full this article<
Get Radiology Tree app to read full this article<
Get Radiology Tree app to read full this article<
Get Radiology Tree app to read full this article<
Get Radiology Tree app to read full this article<
Get Radiology Tree app to read full this article<
Get Radiology Tree app to read full this article<
Conclusions
Get Radiology Tree app to read full this article<
Acknowledgments
Get Radiology Tree app to read full this article<
Supplementary Data
Get Radiology Tree app to read full this article<
Appendix S1
Get Radiology Tree app to read full this article<
Get Radiology Tree app to read full this article<
Get Radiology Tree app to read full this article<
Appendix S2
Get Radiology Tree app to read full this article<
Get Radiology Tree app to read full this article<
References
1. Hoy D., Bain C., Williams G., et. al.: A systematic review of the global prevalence of low back pain. Arthritis Rheumatol 2012; 64: pp. 2028-2037. https://doi.org/10.1002/art.34347
2. Atlas S.J., Deyo R.A.: Evaluating and managing acute low back pain in the primary care setting. J Gen Intern Med 2001; 16: pp. 120-131. https://doi.org/10.1111/j.1525-1497.2001.91141.x
3. Katz J.N.: Lumbar disc disorders and low-back pain: socioeconomic factors and consequences. J Bone Joint Surg 2006; 88: pp. 21-24. https://doi.org/10.2106/JBJS.E.01273
4. Deyo R.A., Dworkin S.F., Amtmann D., et. al.: Report of the NIH Task Force on research standards for chronic low back pain. Eur Spine J 2014; 23: pp. 2028-2045. https://doi.org/10.1007/s00586-014-3540-3
5. Costa Lda C., Maher C.G., McAuley J.H., et. al.: Prognosis for patients with chronic low back pain: inception cohort study. BMJ 2009; 339: pp. b3829. https://doi.org/10.1136/bmj.b3829
6. Johnsson K.E., Rosen I., Uden A.: The natural course of lumbar spinal stenosis. Clin Orthop Relat Res 1992; 279: pp. 82-86.
7. Henschke N., Maher C.G., Refshauge K.M., et. al.: Low back pain research priorities: a survey of primary care practitioners. BMC Fam Pract 2007; 8: pp. 40. https://doi.org/10.1186/1471-2296-8-40
8. Hancock M.J., Maher C.G., Laslett M., et. al.: Discussion paper: what happened to the ‘bio’ in the bio-psycho-social model of low back pain?. Eur Spine J 2011; 20: pp. 2105-2110. https://doi.org/10.1007/s00586-011-1886-3
9. Brinjikji W., Luetmer P.H., Comstock B., et. al.: Systematic literature review of imaging features of spinal degeneration in asymptomatic populations. AJNR Am J Neuroradiol 2015; 36: pp. 811-816. https://doi.org/10.3174/ajnr.A4173
10. Jensen T.S., Karppinen J., Sorensen J.S., et. al.: Vertebral endplate signal changes (Modic change): a systematic literature review of prevalence and association with non-specific low back pain. Eur Spine J 2008; 17: pp. 1407-1422. https://doi.org/10.1007/s00586-008-0770-2
11. Danforth K.N., Early M.I., Ngan S., et. al.: Automated identification of patients with pulmonary nodules in an integrated health system using administrative health plan data, radiology reports, and natural language processing. J Thorac Oncol 2012; 7: pp. 1257-1262. https://doi.org/10.1097/JTO.0b013e31825bd9f5
12. Hripcsak G., Austin J.H., Alderson P.O., et. al.: Use of natural language processing to translate clinical information from a database of 889,921 chest radiographic reports. Radiology 2002; 224: pp. 157-163. https://doi.org/10.1148/radiol.2241011118
13. Jarvik J.G., Comstock B.A., James K.T., et. al.: Lumbar Imaging with Reporting of Epidemiology (LIRE)—protocol for a pragmatic cluster randomized trial. Contemp Clin Trials 2015; 45: pp. 157-163. https://doi.org/10.1016/j.cct.2015.10.003
14. Dreyer K.J., Kalra M.K., Maher M.M., et. al.: Application of recently developed computer algorithm for automatic classification of unstructured radiology reports: validation study. Radiology 2005; 234: pp. 323-329. https://doi.org/10.1148/radiol.2341040049
15. Jarvik J.J., Hollingworth W., Heagerty P., et. al.: The Longitudinal Assessment of Imaging and Disability of the Back (LAIDBack) study: baseline data. Spine 2001; 26: pp. 1158-1166.
16. Birkmeyer N.J., Weinstein J.N., Tosteson A.N., et. al.: Design of the spine patient outcomes research trial (SPORT). Spine 2002; 27: pp. 1361.
17. Centers for Medicare & Medicaid Services : ICD-9-CM Diagnosis and Procedure Codes: Abbreviated and Full Code Titles. Cms.gov. [Online]; Available at: https://www.cms.gov/medicare/coding/ICD9providerdiagnosticcodes/codes.html
18. Radiology Society of North America : RadLex. RadLex. [Online]; Available at http://www.rsna.org/radlex.aspx
19. Harris P.A., Taylor R., Thielke R., et. al.: Research electronic data capture (REDCap)—A metadata-driven methodology and workflow process for providing translational research informatics support. J Biomed Inform 2009; 42: pp. 377-381.
20. Kahn C.E., Jr Langlotz C.P., Burnside E.S., et. al.: Toward best practices in radiology reporting. Radiology 2009; 252: pp. 852-856. Available at: https://doi.org/10.1148/radiol.2523081992
21. Cohen J.A.: Educational and psychological measurement.1960.Sage Publications Sage CAThousand Oaks, CA:pp. 37-46. http://dx.doi.org/10.1177/001316446002000104 ISSN
22. Oracle Corporation : Java. Redwood Shores, CA. Oracle Corporation2016.
23. The Apache Software Foundation : Apache Lucene. Forest Hill, MD. The Apache Software Foundation2016.
24. Chapman W.W., Bridewell W., Hanbury P., et. al.: A simple algorithm for identifying negated findings and diseases in discharge summaries. J Biomed Inform 2001; 34: pp. 301-310. https://doi.org/10.1006/jbin.2001.1029
25. Porter M.F.: Porter Stemmer: The Porter Stemming algorithm Web site. [Online] January; Available at: https://tartarus.org/martin/PorterStemmer/def.txt
26. Cai T., Giannopoulos A.A., Yu S., et. al.: Natural language processing technologies in radiology research and clinical applications. Radiographics 2016; 36: pp. 176-191. https://doi.org/10.1148/rg.2016150080
27. Friedman P.J.: Radiologic reporting: structure. Am J Roentgenol 1983; 140: pp. 171-172. https://doi.org/10.2214/ajr.140.1.171
28. R Core Team : R: A language and environment for statistical computing.2013.R Foundation for Statistical ComputingVienna, Austria
29. Kuhn M.: caret: Classification and Regression Training. R package version 6.0–73 https://CRAN.R-project.org/package=caret
30. Zou H., Hastie T.: Regularization and variable selection via the elastic net. J R Stat Soc Series B Stat Methodol 2005; 67: pp. 301-320. https://doi.org/10.1111/j.1467-9868.2005.00503.x
31. Landis J.R., Koch G.G.: The measurement of observer agreement for categorical data. Biometrics 1977; pp. 159-174. https://doi.org/10.2307/2529310
32. Pons E., Braun L.M., Hunink M.G., et. al.: Natural language processing in radiology: a systematic review. Radiology 2016; 279: pp. 329-343. https://doi.org/10.1148/radiol.16142770
33. Bamber D.: The area above the ordinal dominance graph and the area below the receiver operating characteristic graph. J Math Psychol 1975; 12: pp. 387-415. https://doi.org/10.1016/0022-2496(75)90001-2
34. McNemar Q.: Note on the sampling error of the difference between correlated proportions or percentages. Psychometrika 1947; 12: pp. 153-157. https://doi.org/10.1007/BF02295996
35. Zech J., Pain M., Titano J., et. al.: Reports, natural language–based machine learning models for the annotation of Clinical Radiology. Radiology 2018; pp. 171093. https://doi.org/10.1148/radiol.2018171093
36. Mendonça E.A., Haas J., Shagina L., et. al.: Extracting information on pneumonia in infants using natural language processing of radiology reports. J Biomed Inform 2005; 38: pp. 314-321. https://doi.org/10.1016/j.jbi.2005.02.003
37. Yetisgen-Yildiz M., Gunn M.L., Xia F., et. al.: A text processing pipeline to extract recommendations from radiology reports. J Biomed Inform 2013; 46: pp. 354-362. https://doi.org/10.1016/j.jbi.2012.12.005
38. Carrell D.S., Halgrim S., Tran D.T., et. al.: Using natural language processing to improve efficiency of manual chart abstraction in research: the case of breast cancer recurrence. Am J Epidemiol 2014; 179: pp. 749-758. https://doi.org/10.1093/aje/kwt441
39. Jamaludin A., Lootus M., Kadir T., et. al.: Automation of reading of radiological features from magnetic resonance images (MRIs) of the lumbar spine without human intervention is comparable with an expert radiologist. Eur Spine J 2017; 26: pp. 1374-1383. https://doi.org/10.1007/s00586-017-4956-3