
Rationale and Objectives
To compare prostate volume measurements from 3-Tesla endorectal coil magnetic resonance imaging (ERC MRI) obtained with the prolate ellipsoid volume formula (EVF) and volumetry to pathology-based volume measurements.
Methods
The institutional review board waived informed consent for this retrospective, health insurance portability and accountability act (HIPAA) compliant study, which included 195 patients who underwent 3-T ERC MRI between January 2008 and October 2011 and had pathologic prostate measurements available. Two readers in consensus measured the prostate length, height, and width on each MRI. They estimated prostate volumes using the prolate EVF (length × height × width × [π/6]) and also by performing three-dimensional volumetry. Pathologic specimen mass and dimensions were used to calculate prostate volume. Agreement was measured with Lin’s concordance correlation coefficient (CCC). Volume differences were assessed using the Wilcoxon signed-rank test. Correct prostate-specific antigen (PSA) density classification rates were compared between EVF-based and volumetry-based PSA density levels using the exact McNemar test, with pathology-based PSA density as the reference standard.
Results
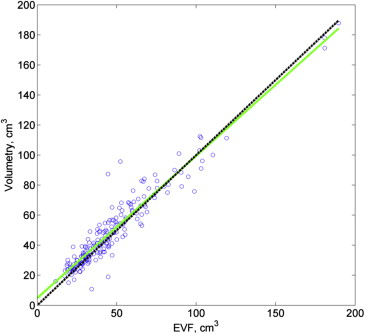
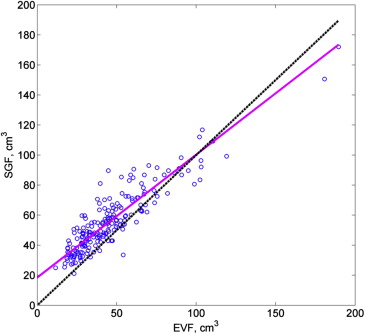
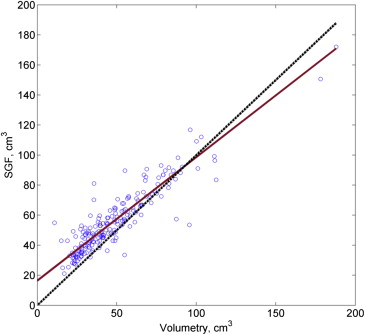
Concordance was high between EVF and volumetry measurements (CCC, 0.950 [95% confidence interval, 0.935–0.962]) and between both kinds of MRI measurements and pathology (both CCC > 0.80). Based on a cut-off of ≤0.15 ng/mL/cm 3 , use of EVF-based volume produced correct classification of 46 of 48 PSA density levels >15 ng/mL/cm 3 and 113 of 147 PSA density levels ≤15 ng/mL/cm 3 ; use of volumetry-based volume produced correct classification of 47 of 48 PSA density levels >15 ng/mL/cm 3 and 121 of 147 PSA density levels ≤15 ng/mL/cm 3 . Rates of underclassification ( P > .95) and overclassification ( P = .10) did not differ significantly between EVF and volumetry.
Conclusions
EVF appears to be suitable for measuring prostate volume from ERC-MRI.
The accurate measurement of in vivo prostate volume is important for a wide variety of clinical situations. For patients with benign prostatic hypertrophy (BPH), prostate volume measurements are used to monitor the condition and assess the efficacy of treatment . For patients with prostate cancer, prostate volume measurements have prognostic significance and may influence diagnosis and management. A number of recent studies have shown that prostate volume can be useful in models for predicting the presence of indolent or clinically “insignificant” tumors . Furthermore, accurate estimation of prostate volume is necessary to calculate the prostate-specific antigen (PSA) density (the PSA level divided by the prostate volume), which may be used to help distinguish BPH from prostate cancer and to predict adverse treatment outcomes . Ha et al. recently reported that among patients with low-risk prostate cancer (defined as a biopsy-derived Gleason score ≤6 in a single positive core, clinical stage ≤T1c, PSA ≤10 ng/mL, and unremarkable magnetic resonance imaging [MRI] results) who underwent radical prostatectomy, PSA density was a predictor of advanced disease (the reported cutoff was a PSA density of 0.085 ng/mL/cm 3 ). Although a range of PSA density cutoffs have been reported in the literature, Epstein et al. found that a PSA density of 0.1–0.15 ng/mL/cm 3 , along with low- to intermediate-grade cancer <3 mm found in only one needle biopsy core specimen, constituted the best model to predict preoperatively insignificant tumor.
Prostate volume measurements are also used to determine patient selection for brachytherapy and the number of radioactive seeds used for the procedure . For patients with larger prostates, brachytherapy is associated with a higher incidence of side effects and is typically not recommended owing to technical difficulties primarily related to the encroachment of the pubic arch over the prostate gland .
Get Radiology Tree app to read full this article<
Get Radiology Tree app to read full this article<
Get Radiology Tree app to read full this article<
Materials and methods
Get Radiology Tree app to read full this article<
MRI Data Acquisition
Get Radiology Tree app to read full this article<
Pathology Preparation
Get Radiology Tree app to read full this article<
Analysis
MR Measurements
Get Radiology Tree app to read full this article<
Pathology Measurements
Get Radiology Tree app to read full this article<
Statistical Analysis
Get Radiology Tree app to read full this article<
Get Radiology Tree app to read full this article<
Get Radiology Tree app to read full this article<
Get Radiology Tree app to read full this article<
Results
Patient Characteristics
Get Radiology Tree app to read full this article<
MRI and Pathology Volume Analyses
Get Radiology Tree app to read full this article<
Table 1
Volume Measurements
Volumes (cm 3 ) Median (IQR) MRI volumetry 41.6 (30.42–60.21) MRI EVF 41.5 (29.08–55.04) Pathology SGF 51.6 (41.14–66.86)
EVF, ellipsoid volume formula; IQR, interquartile range; MRI, magnetic resonance imaging; SGF, specific gravity formula.
Table 2
Differences between Volume Measurements
Volume Differences (cm 3 ) Median (IQR)P Value MRI EVF − MRI volumetry 2.17 (−1.64 to 6.24) <.0001 Path SGF − MRI EVF 10.2 (−4.10 to 15.56) <.0001 Path SGF − MRI volumetry 7.74 (−3.25 to 13.28) <.0001
EVF, ellipsoid volume formula; IQR, interquartile range; MRI, magnetic resonance imaging; SGF, specific gravity formula.
Get Radiology Tree app to read full this article<
Get Radiology Tree app to read full this article<
Get Radiology Tree app to read full this article<
Get Radiology Tree app to read full this article<
![Figure 4, Bland–Altman plots show comparisons between (a) prostate magnetic resonance (MR) volumes measured using ellipsoid volume formula (EVF) and prostate MR volume using volumetry, (b) specimen prostate volume measured using EVF and specimen prostate volume measured using specimen mass (specific gravity formula [SGF]), (c) prostate MR volume measured using EVF and prostate specimen volume measured using SGF.](https://storage.googleapis.com/dl.dentistrykey.com/clinical/ComparisonofProstateVolumeMeasuredbyEndorectalCoilMRItoProstateSpecimenVolumeandMassAfterRadicalProstatectomy/3_1s20S107663321500015X.jpg)
Get Radiology Tree app to read full this article<
MRI and Pathology PSA Density Analyses
Get Radiology Tree app to read full this article<
Discussion
Get Radiology Tree app to read full this article<
Get Radiology Tree app to read full this article<
Get Radiology Tree app to read full this article<
Get Radiology Tree app to read full this article<
Get Radiology Tree app to read full this article<
Get Radiology Tree app to read full this article<
Get Radiology Tree app to read full this article<
Get Radiology Tree app to read full this article<
Acknowledgments
Get Radiology Tree app to read full this article<
References
1. Nickel J.C.: Benign prostatic hyperplasia: does prostate size matter?. Reviews in urology 2003; 5: pp. S12-S17.
2. Davies J.D., Aghazadeh M.A., Phillips S., et. al.: Prostate size as a predictor of Gleason score upgrading in patients with low risk prostate cancer. The Journal of urology 2011; 186: pp. 2221-2227.
3. Bianco F.J., Mallah K.N., Korets R., et. al.: Prostate volume measured preoperatively predicts for organ-confined disease in men with clinically localized prostate cancer. Urology 2007; 69: pp. 343-346.
4. D’Amico A.V., Whittington R., Malkowicz S.B., et. al.: A prostate gland volume of more than 75 cm3 predicts for a favorable outcome after radical prostatectomy for localized prostate cancer. Urology 1998; 52: pp. 631-636.
5. Radwan M.H., Yan Y., Luly J.R., et. al.: Prostate-specific antigen density predicts adverse pathology and increased risk of biochemical failure. Urology 2007; 69: pp. 1121-1127.
6. Ha Y.S., Yu J., Salmasi A.H., et. al.: Prostate-specific antigen density toward a better cutoff to identify better candidates for active surveillance. Urology 2014; 84: pp. 365-371.
7. Epstein J.I., Chan D.W., Sokoll L.J., et. al.: Nonpalpable stage T1c prostate cancer: prediction of insignificant disease using free/total prostate specific antigen levels and needle biopsy findings. The Journal of urology 1998; 160: pp. 2407-2411.
8. Al-Qaisieh B., Brearley E., St Clair S., et. al.: A study of a pretreatment method to predict the number of I-125 seeds required for prostate brachytherapy. International journal of radiation oncology, biology, physics 2006; 65: pp. 304-307.
9. Langley S.E., Laing R.: Prostate brachytherapy has come of age: a review of the technique and results. BJU international 2002; 89: pp. 241-249.
10. Tewari A., Indudhara R., Shinohara K., et. al.: Comparison of transrectal ultrasound prostatic volume estimation with magnetic resonance imaging volume estimation and surgical specimen weight in patients with benign prostatic hyperplasia. Journal of clinical ultrasound: JCU 1996; 24: pp. 169-174.
11. Milosevic M., Voruganti S., Blend R., et. al.: Magnetic resonance imaging (MRI) for localization of the prostatic apex: comparison to computed tomography (CT) and urethrography. Radiotherapy and oncology : journal of the European Society for Therapeutic Radiology and Oncology 1998; 47: pp. 277-284.
12. Rasch C., Barillot I., Remeijer P., et. al.: Definition of the prostate in CT and MRI: a multi-observer study. International journal of radiation oncology, biology, physics 1999; 43: pp. 57-66.
13. Lee J.S., Chung B.H.: Transrectal ultrasound versus magnetic resonance imaging in the estimation of prostate volume as compared with radical prostatectomy specimens. Urologia internationalis 2007; 78: pp. 323-327.
14. Jeong C.W., Park H.K., Hong S.K., et. al.: Comparison of prostate volume measured by transrectal ultrasonography and MRI with the actual prostate volume measured after radical prostatectomy. Urologia internationalis 2008; 81: pp. 179-185.
15. Eri L.M., Thomassen H., Brennhovd B., et. al.: Accuracy and repeatability of prostate volume measurements by transrectal ultrasound. Prostate cancer and prostatic diseases 2002; 5: pp. 273-278.
16. Kimura A., Kurooka Y., Kitamura T., et. al.: Biplane planimetry as a new method for prostatic volume calculation in transrectal ultrasonography. International journal of urology: official journal of the Japanese Urological Association 1997; 4: pp. 152-156.
17. MacMahon P.J., Kennedy A.M., Murphy D.T., et. al.: Modified prostate volume algorithm improves transrectal US volume estimation in men presenting for prostate brachytherapy. Radiology 2009; 250: pp. 273-280.
18. Hricak H., Jeffrey R.B., Dooms G.C., et. al.: Evaluation of prostate size: a comparison of ultrasound and magnetic resonance imaging. Urologic radiology 1987; 9: pp. 1-8.
19. Sosna J., Rofsky N.M., Gaston S.M., et. al.: Determinations of prostate volume at 3-Tesla using an external phased array coil: comparison to pathologic specimens. Academic radiology 2003; 10: pp. 846-853.
20. Bazinet M., Karakiewicz P.I., Aprikian A.G., et. al.: Reassessment of nonplanimetric transrectal ultrasound prostate volume estimates. Urology 1996; 47: pp. 857-862.
21. Fine S.W., Amin M.B., Berney D.M., et. al.: A contemporary update on pathology reporting for prostate cancer: biopsy and radical prostatectomy specimens. European urology 2012; 62: pp. 20-39.
22. Rodriguez E., Skarecky D., Narula N., et. al.: Prostate volume estimation using the ellipsoid formula consistently underestimates actual gland size. The Journal of urology 2008; 179: pp. 501-503.
23. Ohlsen H., Ekman P., Ringertz H.: Assessment of prostatic size with computed tomography. Methodologic aspects. Acta radiologica: diagnosis 1982; 23: pp. 219-223.
24. Varma M., Morgan J.M.: The weight of the prostate gland is an excellent surrogate for gland volume. Histopathology 2010; 57: pp. 55-58.
25. Carrasco J.L., Jover L.: Estimating the generalized concordance correlation coefficient through variance components. Biometrics 2003; 59: pp. 849-858.
26. Lin L.I.: A concordance correlation coefficient to evaluate reproducibility. Biometrics 1989; 45: pp. 255-268.
27. Meraj S., Nagler H.M., Homel P., et. al.: Radical prostatectomy: size of the prostate gland and its relationship with acute perioperative complications. The Canadian journal of urology 2003; 10: pp. 1743-1748.
28. Freedland S.J., Isaacs W.B., Platz E.A., et. al.: Prostate size and risk of high-grade, advanced prostate cancer and biochemical progression after radical prostatectomy: a search database study. Journal of clinical oncology: official journal of the American Society of Clinical Oncology 2005; 23: pp. 7546-7554.
29. Pasquier D., Lacornerie T., Vermandel M., et. al.: Automatic segmentation of pelvic structures from magnetic resonance images for prostate cancer radiotherapy. International journal of radiation oncology, biology, physics 2007; 68: pp. 592-600.
30. Klein S., van der Heide U.A., Lips I.M., et. al.: Automatic segmentation of the prostate in 3D MR images by atlas matching using localized mutual information. Medical physics 2008; 35: pp. 1407-1417.
31. Toth R., Bloch B.N., Genega E.M., et. al.: Accurate prostate volume estimation using multifeature active shape models on T2-weighted MRI. Academic radiology 2011; 18: pp. 745-754.
32. Park S.B., Kim J.K., Choi S.H., et. al.: Prostate volume measurement by TRUS using heights obtained by transaxial and midsagittal scanning: comparison with specimen volume following radical prostatectomy. Korean journal of radiology: official journal of the Korean Radiological Society 2000; 1: pp. 110-113.
33. Miyashita H., Watanabe H., Ohe H., et. al.: Transrectal ultrasonotomography of the canine prostate. The Prostate 1984; 5: pp. 453-457.