
Rationale and Objectives
Efforts to decrease radiation exposure during pediatric high-resolution thoracic computed tomography (HRCT), while maintaining diagnostic image quality, are imperative. The objective of this investigation was to compare organ doses and scan performance for pediatric HRCT using volume, helical, and noncontiguous axial acquisitions.
Materials and Methods
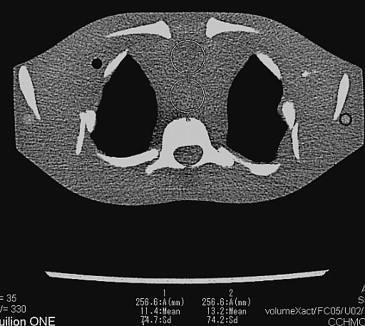
Thoracic organ doses were measured using 20 metal oxide semiconductor field-effect transistor dosimeters. Mean and median organ doses and scan durations were determined and compared for three acquisition modes in a 5-year-old anthropomorphic phantom using similar clinical pediatric scan parameters. Image noise was measured and compared in identical regions within the thorax.
Results
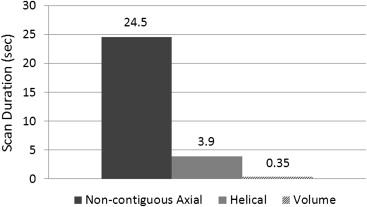
There was a significantly lower dose in lung (1.8 vs 2.7 mGy, P < .02) and thymus (2.3 vs 2.7 mGy, P < .02) between volume and noncontiguous axial modes and in lung (1.8 vs 2.3 mGy, P < .02), breast (1.8 vs 2.6 mGy, P < .02), and thymus (2.3 vs 2.4 mGy, P < .02) between volume and helical modes. There was a significantly lower median image noise for volume compared to helical and axial modes in lung (55.6 vs 79.3 and 70.7) and soft tissue (76.0 vs 111.3 and 89.9). Scan times for volume, helical, and noncontiguous axial acquisitions were 0.35, 3.9, and 24.5 seconds, respectively.
Conclusion
Volumetric HRCT provides an opportunity for thoracic organ dose and image noise reduction, at significantly faster scanning speeds, which may benefit pediatric patients undergoing surveillance studies for diffuse lung disease.
Pediatric diffuse lung disease encompasses a broad range of heterogeneous disorders affecting interstitial, airspace, and small airways . High-resolution computed tomography of the thorax (HRCT) is increasingly used in children for the evaluation of a wide range of diffuse lung diseases . HRCT allows for detailed, noninvasive imaging of the lung parenchyma, thus facilitating demonstration of interstitial lung disease patterns and differential diagnosis, guiding further diagnostic workup and therapy. However, the primary disadvantages of HRCT in children are the image degradation from motion, especially since young children are unable to suspend respiration, and ionizing radiation exposure. Radiation exposure, from all sources, is of paramount concern in children. Compared to adults, children are at greater risk for cancer development at similar radiation exposures due to longer life expectancy and increased radiosensitivity from rapidly growing tissues . Radiation exposure to the female breast is of particular concern with pediatric HRCT. It has been estimated that exposure of the female breast before 35 years of age to 10 mGy increases the risk of cancer development by 14% over the spontaneous rate in the general population . Therefore, efforts to decrease radiation exposure during pediatric HRCT, while maintaining diagnostic image quality are imperative.
The two most widely used methods of acquiring HRCT involve either sampling the lungs with thin (typically 1 mm), noncontiguous axial sections at varying intervals (typically 10–20 mm) or retrospectively deconstructing a helically acquired volumetric data set in thin axial sections at desired intervals. There are several reports in the medical literature comparing image quality between noncontiguous axial and helical HRCT in adults and children , but none to our knowledge have compared true volumetric acquired versus helical and noncontiguous axial acquired HRCT. In addition, while Bastos et al compared total effective dose (using the relatively inaccurate method of multiplying published conversion factors by console-displayed dose–length product [DLP]) in pediatric HRCT performed using helical versus noncontiguous axial acquisitions, they did not measure and compare thoracic organ doses .
Get Radiology Tree app to read full this article<
 Open full size image
Figure 1
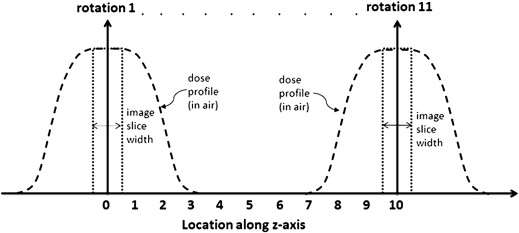
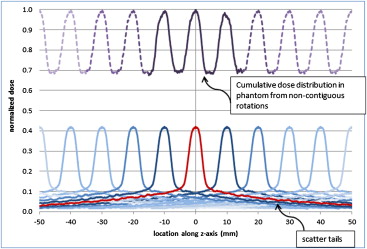
Graphic illustration of the three acquisition methods available to obtain high-resolution thoracic computed tomography. During noncontiguous axial acquisition, the X-ray tube is collimated to a narrow nominal beam width (1 mm in this investigation’s case) and rotates around the patient for one rotation. The tube is then turned off while the patient table is translated 10 mm, at which point the tube is turned back on and undergoes another rotation. This process repeats until the desired scan length is covered. During helical acquisition, a wider nominal beam width is used (32 mm in this investigation’s case) and the tube rotates continuously while the patient table simultaneously translates. During volume mode, a single rotation covers the entire anatomy (up to 160 mm) and there is no table translation during the acquisition.
Get Radiology Tree app to read full this article<
Get Radiology Tree app to read full this article<
Materials and methods
Get Radiology Tree app to read full this article<
Phantom and Detector Placement
Get Radiology Tree app to read full this article<
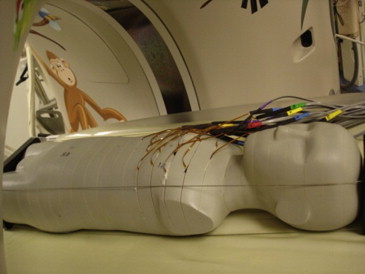
Table 1
Locations of organ metal oxide semiconductor field effect transistor detectors in the 5-year-old anthropomorphic phantom
Dosimeter number Organ/structure Slice number Location number 1 Lung–left upper lobe 10 29 2 Thymus 10 34 3 Lung–right upper lobe 11 47 4 Lung–left upper lobe 11 49 5 Lung–right upper lobe 12 53 6 Lung–left upper lobe 12 56 7 Lung–left lower lobe 12 57 8 Right breast 12 58 9 Left breast 12 59 10 Thymus 12 60 11 Lung–right middle lobe 13 67 12 Lung–right lower lobe 13 68 13 Lung–lingula 13 71 14 Thoracic spine 13 75 15 Heart 13 H4 16 Lung–right lower lobe 14 78 17 Lung–left lower lobe 14 81 18 Esophagus 14 85 19 Lung–left lower lobe 14 83 20 Lung–left lower lobe 14 84
Get Radiology Tree app to read full this article<
Scanning Parameters
Get Radiology Tree app to read full this article<
Get Radiology Tree app to read full this article<
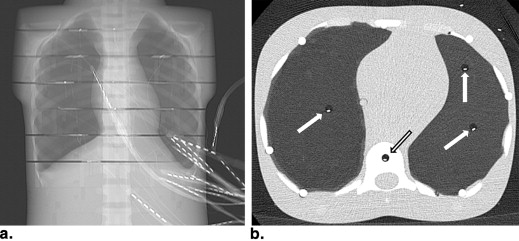
Table 2
Pediatric high-resolution thoracic computed tomography (CT) protocols
Scanner Scan mode Nominal collimation (channel No. × width) Tube current (mA) Rotation time (sec) Pitch 64-Detector CT Noncontiguous axial 1 × 1 mm 100 0.5 N/A 320-Detector CT Volume 320 × 0.5 mm Min 20/max 120 0.35 N/A 320-Detector CT Helical 64 × 0.5 mm Min 20/max 120 0.5 0.828
All scans performed at 100 kVp, small field of view (240 mm), and 16-cm scan length. Noncontiguous axial scan performed with 1-mm slices every 10 mm. Volume and helical scans deconstructed at 1-mm slice thickness every 10 mm. Volume and helical scans performed with tube current modulation at noise setting (SD) of 7.5. All scans reconstructed with same kernel (FC5) and with same noise reduction algorithms (QDS and BOOST3D) and without iterative reconstruction techniques.
Get Radiology Tree app to read full this article<
Anthropomorphic Phantom Measurement Tabulation
Get Radiology Tree app to read full this article<
Get Radiology Tree app to read full this article<
Get Radiology Tree app to read full this article<
Get Radiology Tree app to read full this article<
Cylindrical Phantom Measurement Tabulation
Get Radiology Tree app to read full this article<
Image Noise Measurement Tabulation
Get Radiology Tree app to read full this article<
Get Radiology Tree app to read full this article<
Statistical Analysis
Get Radiology Tree app to read full this article<
Results
Get Radiology Tree app to read full this article<
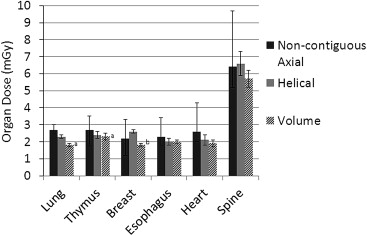
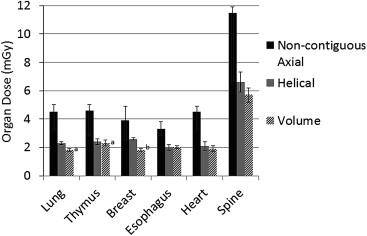
Table 3
Mean and median organ dose comparison for high-resolution thoracic computed tomography performed in three different acquisition modes using average doses for the noncontiguous axial mode
Organ Organ dose (mGy) Volume mode Helical mode Noncontiguous axial mode Mean ± SD Mean ± SD Median (25%, 75%) Lung 1.8 ± 0.1 ∗ 2.3 ± 0.1 ‡ 2.7 (2.5, 3.0) Thymus 2.3 ± 0.2 ∗ 2.4 ± 0.2 ‡ 2.7 (1.8, 3.6) Breast 1.8 ± 0.1 † 2.6 ± 0.1 2.2 (1.2, 3.3) Esophagus 2.0 ± 0.1 2.0 ± 0.2 2.3 (1.8, 3.4) Heart 1.9 ± 0.2 2.1 ± 0.3 2.6 (2.0, 4.3) T-spine 5.7 ± 0.5 6.6 ± 0.7 6.4 (5.2, 9.7)
SD, standard deviation.
Get Radiology Tree app to read full this article<
Get Radiology Tree app to read full this article<
Get Radiology Tree app to read full this article<
Table 4
Mean and median organ dose comparison for high-resolution thoracic computed tomography performed in three different acquisition modes using peak doses for the non-contiguous axial mode
Organ Organ dose (mGy) Volume mode Helical mode Noncontiguous axial mode Mean ± SD Mean ± SD Median (25%, 75%) Lung 1.8 ± 0.1 ∗ 2.3 ± 0.1 † 4.5 (3.2, 5.0) Thymus 2.3 ± 0.2 † 2.4 ± 0.2 † 4.6 (2.9, 5.0) Breast 1.8 ± 0.1 ∗ 2.6 ± 0.1 3.9 (2.5, 4.9) Esophagus 2.0 ± 0.1 † 2.0 ± 0.2 3.3 (2.9, 3.8) Heart 1.9 ± 0.2 2.1 ± 0.3 † 4.5 (3.2, 4.9) T-spine 5.7 ± 0.5 6.6 ± 0.7 11.5 (6.6, 11.8)
SD, standard deviation.
Get Radiology Tree app to read full this article<
Get Radiology Tree app to read full this article<
Get Radiology Tree app to read full this article<
Get Radiology Tree app to read full this article<
Get Radiology Tree app to read full this article<
Get Radiology Tree app to read full this article<
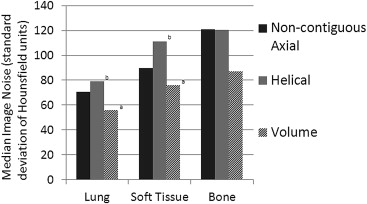
Table 5
Median image noise comparison for high-resolution thoracic computed tomography performed in three different acquisition modes
Organ Median image noise (Hounsfield unit standard deviation) Volume Helical Noncontiguous axial Lung 55.6 ∗ 79.3 † 70.7 Soft tissue 76.0 ∗ 111.3 † 89.9 Bone 86.8 120.7 121.1
Get Radiology Tree app to read full this article<
Get Radiology Tree app to read full this article<
Get Radiology Tree app to read full this article<
Discussion
Get Radiology Tree app to read full this article<
Get Radiology Tree app to read full this article<
Get Radiology Tree app to read full this article<
Get Radiology Tree app to read full this article<
Get Radiology Tree app to read full this article<
Get Radiology Tree app to read full this article<
Get Radiology Tree app to read full this article<
Get Radiology Tree app to read full this article<
Get Radiology Tree app to read full this article<
Get Radiology Tree app to read full this article<
Acknowledgments
Get Radiology Tree app to read full this article<
Get Radiology Tree app to read full this article<
Get Radiology Tree app to read full this article<
References
1. Guillerman R.P., Brody A.S.: Contemporary perspectives on pediatric diffuse lung disease. Radiol Clin N Am 2011; 49: pp. 847-868.
2. Garcia-Peña P., Lucaya J.: HRCT in children: technique and indications. Eur Radiol 2004; 14: pp. L13-L30.
3. Brenner D., Elliston C., Hall E., et. al.: Estimated risks of radiation-induced fatal cancer from pediatric CT. AJR Am J Roentgenol 2001; 176: pp. 289-296.
4. Land C.E., Tokunaga M., Tokuaka A.S., et. al.: Early onset breast cancer in A-bomb survivors. Lancet 1992; 342: pp. 237.
5. Funama Y., Awai K., Taguchi K., et. al.: Cone-beam technique for 64-MDCT of lung: image quality comparison with stepwise (step-and-shoot) technique. AJR Am J Roentgenol 2009; 192: pp. 273-278.
6. Hill L.E., Ritchi G., Wightman A.J., et. al.: Comparison between conventional interrupted high-resolution CT and volume mutidetector CT acquisition in the assessment of bronchiectasis. Br J Radiol 2010; 83: pp. 67-70.
7. Bastos M., Lee E.Y., Strauss K.J., et. al.: Motion artifact on high-resolution CT images of pediatric patients: comparison of volumetric and axial CT methods. AJR Am J Roentgenol 2009; 193: pp. 1414-1418.
8. Kelly D.M., Hasegawa I., Borders R., et. al.: High-resolution CT using MDCT: comparison of degree of motion artifact between volumetric and axial methods. AJR Am J Roentgenol 2004; 182: pp. 757-759.
9. Studler U., Gluecker T., Bongartz G., et. al.: Image quality from high-resolution CT of the lung: comparison of axial scans and of sections reconstructed from volumetric data acquiring using MDCT. AJR Am J Roentgenol 2005; 185: pp. 602-607.
10. Vikgren J., Johnsson Å.A., Flinck A., et. al.: High-resolution computed tomography with 16-row MDCT: a comparison regarding visibility and motion artifacts of dose-modulated thin slices and “step and shoot” images. Acta Radiol 2008; 49: pp. 755-760.
11. Choi S.I., George R.T., Schuleri K.H., et. al.: Recent developments in wide-detector cardiac computed tomography. Int J Cardiovasc Imaging 2009; 25: pp. 23-29.
12. Kroft L.J., Roelofs J.J., Geleijns J.: Scan time and patient dose for thoracic imaging in neonates and small children using axial volumetric 320-detector row CT compared to helical 64-, 32- and 16-detector row CT acquisitions. Pediatr Radiol 2010; 40: pp. 294-300.
13. Yoshizumi T.T., Goodman P.C., Frush D.P., et. al.: Validation of metal oxide semiconductor field effect transistor technology for organ dose assessment during CT: comparison with thermoluminescent dosimetry. AJR Am J Roentgenol 2007; 188: pp. 1332-1336.
14. Zhang D., Savandi A.S., Demarco J.J., et. al.: Variability of surface and center position radiation dose in MDCT: Monte Carlo simulations using CTDI and anthropomorphic phantoms. Med Phys 2009; 36: pp. 1025-1038.
15. Shope T.B., Gagne R.M., Johnson G.C.: A method for describing the doses delivered by transmission x-ray computed tomography. Med Phys 1981; 8: pp. 488-495.
16. McCollough C.H., Leng S., Yu L., et. al.: CT dose index and patient dose: they are not the same thing. Radiology 2011; 259: pp. 311-316.
17. Geleijns J., Salvadó Artells M., de Bruin P.W., et. al.: Computed tomography dose assessment for a 160 mm wide, 320 detector row, cone beam CT scanner. Phys Med Biol 2009; 54: pp. 3141-3159.
18. Greenberg S.B., Bhutta S., Braswell L., et. al.: Computed tomogreaphy angiography in children with cardiovascular disease: low dose techniques and image quality. Int J Cardiovasc Imaging 2012; 28: pp. 163-170.
19. Einstein A.J., Elliston C., Arai A.A., et. al.: Radiation dose from single-heartbeat coronary CT angiography performed with a 320-detector row volume scanner. Radiology 2010; 254: pp. 698-706.
20. Podberesky D.J., Angel E., Yoshizumi T.T., et. al.: Radiation dose estimation for prospective versus retrospective ECG-gated cardiac CT angiography in infants and small children using a 320-detector row volume scanner. AJR Am J Roentgenol 2012; 199: pp. 1129-1135.
21. Goshima S., Kanematsu M., Nishibori H., et. al.: CT of the pancreas: comparison of anatomic structure depiction, image quality, and radiation exposure between 320-detector volumetric images and 64-detector helical images. Radiology 2011; 260: pp. 139-147.
22. Bauknecht H.C., Siebert E., Dannenburg A., et. al.: Image quality and radiation exposure in 320-row temporal bone computed tomography. Dentomaxillofac Radiol 2010; 39: pp. 199-206.
23. Lell M.M., May M., Deak , et. al.: High-pitch spiral computed tomography: effect on image quality and radiation dose in pediatric chest computed tomography. Invest Radiol 2011; 46: pp. 116-123.
24. Baumueller S., Alkadhi H., Stolzmann P., et. al.: Computed tomography of the lung in the high-pitch mode: is breath holding still required?. Invest Radiol 2011; 46: pp. 240-245.
25. Nishino M., Kuroki M., Boiselle P.M., et. al.: Coronal reformations of volumetric expiratory high-resolution CT of the lung. AJR Am J Roentgenol 2004; 182: pp. 979-982.
26. Martin C.J.: Effective dose: how should it be applied to medical exposures ?. Br J Radiol 2007; 80: pp. 639-647.
27. Brenner D.J.: Effective dose: a flawed concept that could and should be replaced. Br J Radiol 2008; 81: pp. 521-523.
28. McCollough C.H., Christner J.A., Kofler J.M.: How predictive is effective dose as a predictor of radiation risk?. AJR Am J Roentgenol 2010; 194: pp. 890-896.