
Rationale and Objectives
The aims of this study were to compare accuracy between semiautomated and manual measurements of the longest diameter and volume of simulated hepatic tumors in phantoms and to evaluate the effects of slice thickness (ST) and reconstruction increment (RI) on accuracy.
Materials and Methods
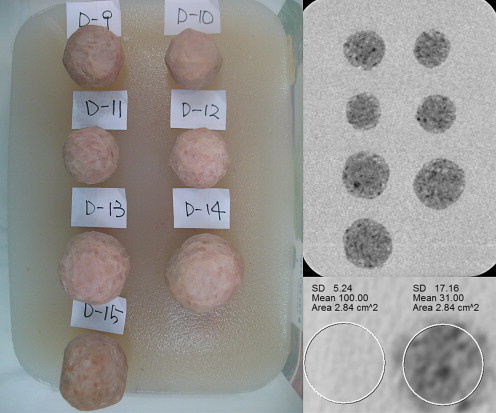
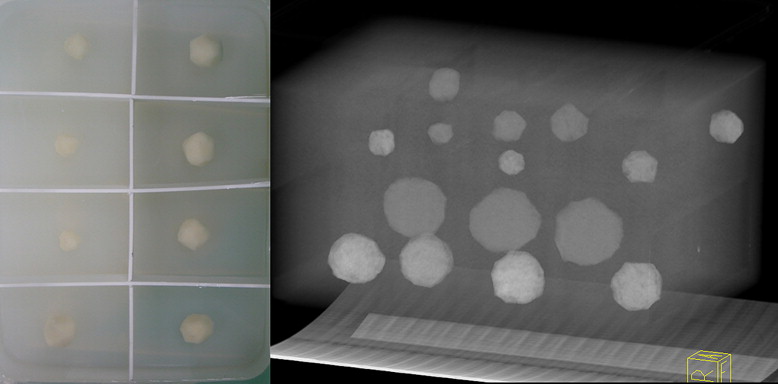
Liver phantoms with 45 hypoattenuating and 45 hyperattenuating lesions of different sizes (diameter, 13.3–50.7 mm; volume, 0.4–54.0 mm 3 ) and shapes (spherical or elliptical) were scanned using a 64-row multidetector computed tomographic scanner. Images were reconstructed with ST and RI settings of 0.75 and 0.7 mm, 1.0 and 0.7 mm, 1.5 and 1.0 mm, 3.0 and 2.0 mm, 3.0 and 3.0 mm, and 5.0 and 5.0 mm. The longest diameter and volume of each lesion were measured both manually and semiautomatically. To assess accuracy, measurements were compared to reference values by calculating absolute percentage error. Comparisons of absolute percentage error between methods and between ST and RI settings were performed using paired t tests. The degree of correlation between each measurement and a reference value was also assessed.
Results
The semiautomated method showed significantly higher accuracy than the manual method in volume for most ST and RI settings (0.75 and 0.7 mm, 1.0 and 0.7 mm, and 1.5 and 1.0 mm in hypoattenuating lesions and all settings in hyperattenuating lesions; P < .05) and showed similar accuracy in diameter for all ST and RI settings regardless of lesion attenuation ( P > .05). Semiautomated measurements also demonstrated higher correlation with reference values than the manual method for both diameter and volume. The absolute percentage error tended to be increased as ST and RI increased for both methods, and acceptable maximum ST and RI in semiautomated method were 1.5 and 1.0 mm.
Conclusions
Semiautomated computed tomographic measurement showed higher accuracy and correlation than the manual method in measuring the diameter and volume of hepatic lesions. The accuracy of both methods was highly dependent on z-axis resolution.
Monitoring tumor response to treatment is an integral and increasingly important function of radiologists’ working in the field of oncology. The Response Evaluation Criteria in Solid Tumors (RECIST), which are based on measuring the longest axial diameters of solid target lesions, are the current standard for the assessment of therapeutic tumor response . However, recent evidence suggests that the value of RECIST may lead to remarkable interobserver variance in manual measurements . Therefore, many imaging experts have asserted that state-of-the-art multidetector row computed tomographic (MDCT) imaging, which facilitates the acquisition and analysis of high–spatial resolution three-dimensional data sets, will provide more accurate assessment of lesion dimensions . In addition, the International Cancer Imaging Society advocated modifications to RECIST in a consensus paper to compensate for such shortcomings and opted for the incorporation of volumetric scanning techniques such as MDCT and three-dimensional volume measurement approaches.
The utility of semiautomated measurement for liver, lung, and lymph node lesions has already been substantiated in several studies . However, no previous study has compared accuracy in measuring hepatic lesions between the semiautomated method and the manual method with reference standards or suggested appropriate slice thickness (ST) and reconstruction increment (RI) settings for accurate measurement.
Get Radiology Tree app to read full this article<
Materials and methods
Phantom Design
Get Radiology Tree app to read full this article<
Table 1
Characteristics of Hypoattenuating and Hyperattenuating Tumor Models
Variable Hypoattenuating Hyperattenuating Total number 45 45 Number of spherical and elliptical lesions 22 and 23 30 and 15 Material Ham Rice cake CT number of lesions (HU) 30–60 140–170 Background CT number (HU) 100–120 50–60 Longest diameter (mm) 30.6 ± 10.3 (13.3–47.6) 30.3 ± 9.4 (16.1–50.7) Volume (mm 3 ) 14.2 ± 14.7 (0.4–54.0) 13.4 ± 12.8 (1.2–45.0)
Data are expressed as number, range, or mean ± standard deviation (range).
HU, Hounsfield units.
Get Radiology Tree app to read full this article<
Get Radiology Tree app to read full this article<
Get Radiology Tree app to read full this article<
Computed Tomographic (CT) Acquisition
Get Radiology Tree app to read full this article<
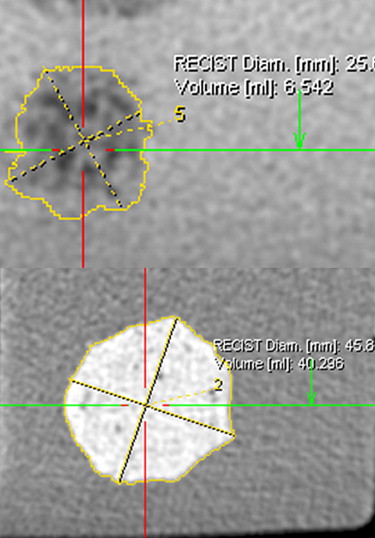
Manual and Semiautomated Measurements
Get Radiology Tree app to read full this article<
Get Radiology Tree app to read full this article<
Get Radiology Tree app to read full this article<
Get Radiology Tree app to read full this article<
APED=|Dm−Dr|Dr×100%, AP
E
D
=
|
D
m
−
D
r
|
D
r
×
100
%
,
where D m is the manually or semiautomatically measured longest diameter, and D r is the corresponding real longest diameter measured before the CT scan. Accordingly, the APE of volume measurement was calculated as
APEV=|Vm−Vr|Vr×100%, AP
E
V
=
|
V
m
−
V
r
|
V
r
×
100
%
,
where V m is the manually or semiautomatically measured volume, and V r is the referenced real volume.
Get Radiology Tree app to read full this article<
Statistical Analysis
Get Radiology Tree app to read full this article<
Results
Manual Versus Semiautomated Measurement
Get Radiology Tree app to read full this article<
Table 2
Results for Diameter and Volume of Hypoattenuating Lesions at Different STs and RIs Using Manual and Semiautomated Measurements
ST/RI (mm) APE D (%) (Mean ± SD) CCC D (95% CI) APE V (%) (Mean ± SD) CCC V (95% CI) Manual Semiautomated_P_ Manual Semiautomated Manual Semiautomated_P_ Manual Semiautomated 0.75/0.7 9.4 ± 10.2 6.5 ± 5.6 .136 0.95 (0.90–0.97) 0.99 (0.98–0.99) 11.2 ± 17.9 7.9 ± 13.8 .007 ∗ 1.00 (0.99–1.00) 1.00 (1.00–1.00) 1.0/0.7 9.9 ± 10.7 7.7 ± 6.0 .265 0.94 (0.90–0.97) 0.98 (0.97–0.99) 11.7 ± 21.9 7.8 ± 13.8 .029 ∗ 1.00 (0.99–1.00) 1.00 (1.00–1.00) 1.5/1.0 9.0 ± 9.9 7.6 ± 6.1 .478 0.95 (0.91–0.97) 0.99 (0.98–0.99) 13.9 ± 19.3 8.8 ± 11.7 .009 ∗ 0.99 (0.99–1.00) 1.00 (1.00–1.00) 3.0/2.0 9.1 ± 9.0 7.4 ± 5.8 .298 0.95 (0.91–0.97) 0.99 (0.98–0.99) 14.0 ± 27.7 9.6 ± 12.0 .229 0.99 (0.99–1.00) 1.00 (1.00–1.00) 3.0/3.0 10.6 ± 9.6 9.9 ± 9.1 .714 0.94 (0.89–0.97) 0.98 (0.96–0.99) 14.7 ± 29.1 12.2 ± 16.6 .412 0.99 (0.99–1.00) 1.00 (1.00–1.00) 5.0/5.0 12.0 ± 9.9 9.9 ± 8.2 .231 0.94 (0.89–0.97) 0.98 (0.97–0.99) 16.8 ± 25.3 16.2 ± 25.1 .855 0.99 (0.98–0.99) 1.00 (1.00–1.00)
APE, absolute percentage error; CCC, concordance correlation coefficient; CI, confidence interval; D, longest diameter; RI, reconstruction increment; SD, standard deviation; ST, slice thickness; V, volume.
Get Radiology Tree app to read full this article<
Table 3
Results for Diameter and Volume of Hyperattenuating Lesions at Different STs and RIs Using Manual and Semiautomated Measurements
ST/RI (mm) APE D (%) (Mean ± SD) CCC D (95% CI) APE V (%) (Mean ± SD) CCC V (95% CI) Manual Semiautomated_P_ Manual Semiautomated Manual Semiautomated_P_ Manual Semiautomated 0.75/0.7 3.7 ± 2.6 3.6 ± 2.8 .752 0.99 (0.99–1.00) 1.00 (0.99–1.00) 22.6 ± 13.4 11.7 ± 10.5 <.0001 ∗ 1.00 (0.99;1.00) 1.00 (1.00;1.00) 1.0/0.7 4.1 ± 2.8 4.0 ± 3.3 .883 0.99 (0.98–1.00) 0.99 (0.99–1.00) 22.1 ± 12.9 12.6 ± 11.3 <.0001 ∗ 1.00 (0.99;1.00) 1.00 (0.99;1.00) 1.5/1.0 4.7 ± 2.8 4.4 ± 3.0 .492 0.99 (0.98–0.99) 1.00 (0.99–1.00) 24.5 ± 14.5 13.5 ± 12.4 <.0001 ∗ 1.00 (0.99;1.00) 1.00 (1.00;1.00) 3.0/2.0 5.1 ± 4.0 5.8 ± 3.7 .276 0.99 (0.98–0.99) 0.99 (0.97–0.99) 30.5 ± 14.0 14.2 ± 13.0 <.0001 ∗ 1.00 (0.99;1.00) 1.00 (1.00;1.00) 3.0/3.0 6.5 ± 6.5 6.1 ± 3.5 .727 0.98 (0.97–0.99) 0.99 (0.99–1.00) 32.7 ± 15.8 15.2 ± 13.3 <.0001 ∗ 0.99 (0.99–1.00) 1.00 (0.99;1.00) 5.0/5.0 8.7 ± 7.3 7.5 ± 5.0 .207 0.97 (0.95–0.99) 0.99 (0.98–0.99) 34.5 ± 19.4 18.4 ± 15.2 <.0001 ∗ 0.99 (0.99–1.00) 0.99 (0.99–1.00)
APE, absolute percentage error; CCC, concordance correlation coefficient; CI, confidence interval; D, longest diameter; RI, reconstruction increment; SD, standard deviation; ST, slice thickness; V, volume.
Get Radiology Tree app to read full this article<
Get Radiology Tree app to read full this article<
Get Radiology Tree app to read full this article<
Get Radiology Tree app to read full this article<
Effects of ST and RI
Get Radiology Tree app to read full this article<
Table 4
Statistical Significance of the Differences in Absolute Percentage Errors in Longest Diameter and Volume Among Various ST and RI Settings in Semiautomated Measurement of Hypoattenuating Lesions
ST/RI (mm) 0.75/0.7 1.0/0.7 1.5/1.0 3.0/2.0 3.0/3.0 5.0/5.0 0.75/0.7.853.260.327.027.002 ∗ 1.0/0.7 .040.210.333.026.003 ∗ 1.5/1.0 .034 .839.526.035.005 ∗ 3.0/2.0 .198 .653 .765.144.020 3.0/3.0 .001 ∗ .043 .027 .012.025 5.0/5.0 <.0001 ∗ .031 .017 <.0001 ∗ .998
P values for absolute percentage errors of the longest diameter are shown in normal type, and those for volume are shown in boldface type.
RI, reconstruction increment; ST, slice thickness.
Get Radiology Tree app to read full this article<
Table 5
Statistical Significance of the Differences in Absolute Percentage Errors in Longest Diameter and Volume Among Various ST and RI Settings in Semiautomated Measurement for Hyperattenuating Lesions
ST/RI (mm) 0.75/0.7 1.0/0.7 1.5/1.0 3.0/2.0 3.0/3.0 5.0/5.0 0.75/0.7.084.003 ∗ .020.0001 ∗ <.0001 ∗ 1.0/0.7 .053.239.150.009.0001 ∗ 1.5/1.0 .028 .377.377.007 ∗ .0003 ∗ 3.0/2.0 <.0001 ∗ <.0001 ∗ <.0001 ∗ .122.0004 ∗ 3.0/3.0 <.0001 ∗ <.0001 ∗ <.0001 ∗ .437.005 ∗ 5.0/5.0 <.0001 ∗ <.0001 ∗ <.0001 ∗ .001 ∗ .004 ∗
P values for absolute percentage errors of the longest diameter are shown in normal type, and those for volume are shown in boldface type.
RI, reconstruction increment; ST, slice thickness.
Get Radiology Tree app to read full this article<
Get Radiology Tree app to read full this article<
Discussion
Get Radiology Tree app to read full this article<
Get Radiology Tree app to read full this article<
Get Radiology Tree app to read full this article<
Get Radiology Tree app to read full this article<
Get Radiology Tree app to read full this article<
Get Radiology Tree app to read full this article<
Get Radiology Tree app to read full this article<
Get Radiology Tree app to read full this article<
Get Radiology Tree app to read full this article<
Conclusions
Get Radiology Tree app to read full this article<
Get Radiology Tree app to read full this article<
References
1. Therasse P., Arbuck S.G., Eisenhauer E.A., et. al.: New guidelines to evaluate the response to treatment in solid tumors. European Organization for Research and Treatment of Cancer, National Cancer Institute of the United States, National Cancer Institute of Canada. J Natl Cancer Inst 2000; 92: pp. 205-216.
2. Eisenhauer E.A., Therasse P., Bogaerts J., et. al.: New Response Evaluation Criteria in Solid Tumours: revised RECIST guideline (version 1.1). Eur J Cancer 2009; 45: pp. 228-247.
3. Suzuki C., Torkzad M.R., Jacobsson H., et. al.: Interobserver and intraobserver variability in the response evaluation of cancer therapy according to RECIST and WHO-criteria. Acta Oncol 2010; 49: pp. 509-514.
4. Erasmus J.J., Gladish G.W., Broemeling L., et. al.: Interobserver and intraobserver variability in measurement of non-small-cell carcinoma lung lesions: implications for assessment of tumor response. J Clin Oncol 2003; 21: pp. 2574-2582.
5. Bolte H., Jahnke T., Schafer F.K., et. al.: Interobserver-variability of lung nodule volumetry considering different segmentation algorithms and observer training levels. Eur J Radiol 2007; 64: pp. 285-295.
6. Ravenel J.G., Leue W.M., Nietert P.J., et. al.: Pulmonary nodule volume: effects of reconstruction parameters on automated measurements—a phantom study. Radiology 2008; 247: pp. 400-408.
7. Petrou M., Quint L.E., Nan B., et. al.: Pulmonary nodule volumetric measurement variability as a function of CT slice thickness and nodule morphology. AJR Am J Roentgenol 2007; 188: pp. 306-312.
8. Keil S., Plumhans C., Behrendt F.F., et. al.: Automated measurement of lymph nodes: a phantom study. Eur Radiol 2009; 19: pp. 1079-1086.
9. Keil S., Plumhans C., Behrendt F.F., et. al.: Semi-automated quantification of hepatic lesions in a phantom. Invest Radiol 2009; 44: pp. 82-88.
10. Keil S., Behrendt F.F., Stanzel S., et. al.: Semi-automated measurement of hyperdense, hypodense and heterogeneous hepatic metastasis on standard MDCT slices. Comparison of semi-automated and manual measurement of RECIST and WHO criteria. Eur Radiol 2008; 18: pp. 2456-2465.
11. Husband J.E., Schwartz L.H., Spencer J., et. al.: Evaluation of the response to treatment of solid tumours—a consensus statement of the International Cancer Imaging Society. Br J Cancer 2004; 90: pp. 2256-2260.
12. Honda O., Sumikawa H., Johkoh T., et. al.: Computer-assisted lung nodule volumetry from multi-detector row CT: influence of image reconstruction parameters. Eur J Radiol 2007; 62: pp. 106-113.
13. Goo J.M., Tongdee T., Tongdee R., et. al.: Volumetric measurement of synthetic lung nodules with multi-detector row CT: effect of various image reconstruction parameters and segmentation thresholds on measurement accuracy. Radiology 2005; 235: pp. 850-856.
14. Gavrielides M.A., Kinnard L.M., Myers K.J., et. al.: Noncalcified lung nodules: volumetric assessment with thoracic CT. Radiology 2009; 251: pp. 26-37.
15. Mueller C.A., Scorzin J., Koenig R., et. al.: Comparison of manual tracing versus a semiautomatic radial measurement method in temporal lobe MRI volumetry for pharmacoresistant epilepsy. Neuroradiology 2007; 49: pp. 189-201.
16. Marten K., Auer F., Schmidt S., et. al.: Inadequacy of manual measurements compared to automated CT volumetry in assessment of treatment response of pulmonary metastases using RECIST criteria. Eur Radiol 2006; 16: pp. 781-790.
17. Farraher S.W., Jara H., Chang K.J., et. al.: Liver and spleen volumetry with quantitative MR imaging and dual-space clustering segmentation. Radiology 2005; 237: pp. 322-328.
18. Sohns C., Mangelsdorf J., Sossalla S., et. al.: Measurement of response of pulmonal tumors in 64-slice MDCT. Acta Radiol 2010; 51: pp. 512-521.