
Rationale and Objectives
The aim of this study was to investigate the potential of magnetic resonance imaging (MRI) T1 mapping and T1 relaxation time in the rotating frame (T1rho) for assessment of renal fibrosis in a rat model of unilateral ureteral obstruction (UUO).
Materials and Methods
UUO was created in 36 rats. Six rats were scanned at each of the six time points (on days 0, 1, 3, 5, 10, and 15 after UUO). The contralateral kidneys were examined as controls. Hematoxylin-eosin, Masson’s trichrome, and alpha-smooth muscle actin (α-SMA) antibody staining assays were performed. MRI data obtained with a 3.0T scanner were analyzed with α-SMA expression and Masson’s staining.
Results
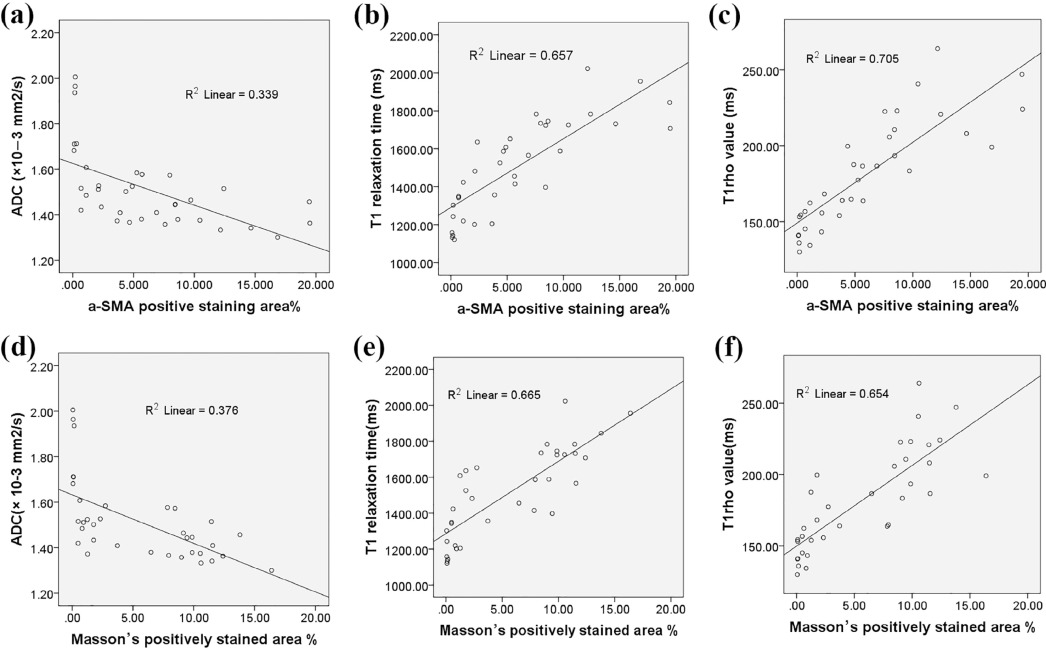
The T1 relaxation times and T1rho values increased, and the mean apparent diffusion coefficient (ADC) values decreased with time after UUO. Simple regression analysis indicated that the mean ADCs, T1 relaxation times, and T1rho values had strong correlations with the α-SMA expression levels (R 2 = 0.34, R 2 = 0.66, R 2 = 0.71, respectively; P < .001) and positive Masson’s staining (R 2 = 0.38, R 2 = 0.67, R 2 = 0.65, respectively; P < .001).
Conclusions
The T1 mapping and T1rho parameters had better correlations with α-SMA expression and Masson’s staining than ADC values.
Introduction
Chronic kidney disease has become a global public health problem. Renal fibrosis is the common outcome and major pathologic basis for the progression of chronic kidney disease to end-stage renal failure . Therefore, assessment of renal fibrosis is important in determining the diagnosis, assessing the prognosis, and guiding treatment. Ideally, pathologic changes of the kidneys should be observed by renal biopsy. However, this is an invasive procedure, so it cannot be used repeatedly to monitor disease changes . In addition, serologic markers lack sufficient specificity and sensitivity to be useful in clinical practice .
Magnetic resonance imaging (MRI) may provide information regarding the structure and function of the kidneys . Diffusion-weighted imaging (DWI) reflects the random Brownian motion of water molecules in tissues, quantified by the apparent diffusion coefficient (ADC), which indirectly reflects the microstructure. Recently, some studies have shown that renal ADC values strongly correlate with histologic measures of fibrosis . However, the use of ADC to evaluate renal fibrosis is still controversial .
Get Radiology Tree app to read full this article<
Get Radiology Tree app to read full this article<
Get Radiology Tree app to read full this article<
Materials and Methods
Animal Protocol
Get Radiology Tree app to read full this article<
Get Radiology Tree app to read full this article<
Get Radiology Tree app to read full this article<
MRI
Get Radiology Tree app to read full this article<
Get Radiology Tree app to read full this article<
Get Radiology Tree app to read full this article<
Get Radiology Tree app to read full this article<
MRI Data Analysis
Get Radiology Tree app to read full this article<
Get Radiology Tree app to read full this article<
Histopathologic Examination
Get Radiology Tree app to read full this article<
Get Radiology Tree app to read full this article<
Statistical Analysis
Get Radiology Tree app to read full this article<
Results
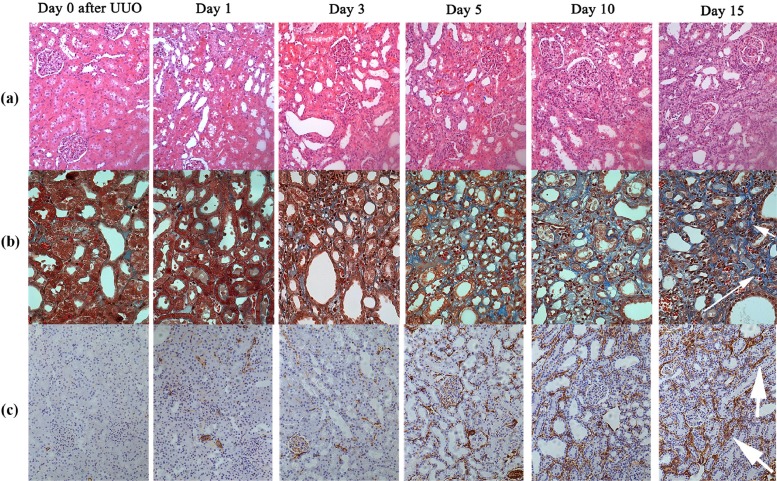
Histopathologic Examination
Get Radiology Tree app to read full this article<
Get Radiology Tree app to read full this article<
Get Radiology Tree app to read full this article<
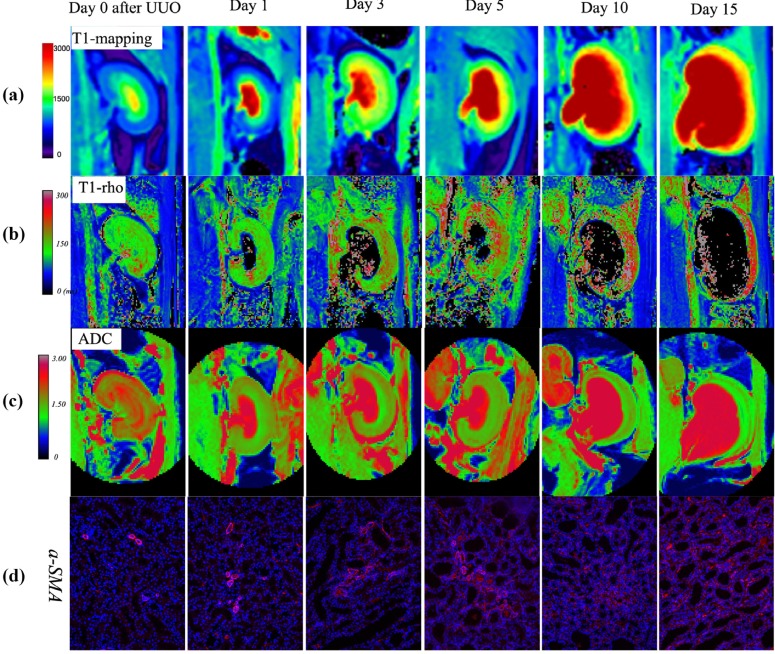
ADC Values, T1 Relaxation Times, and T1rho Values on the Kidney with UUO
Get Radiology Tree app to read full this article<
TABLE 1
Mean Apparent Diffusion Coefficient (ADC) Values, T1 Relaxation Times, and T1rho Values of the Renal Parenchyma Before and After Unilateral Ureteral Obstruction (UUO) (mean ± SD) for the UUO Kidney
Time (d) n (35) ADC (×10 −3 mm 2 /s) T1 Relaxation Time (ms) T1rho Value (ms) 0 6 1.83 ± 0.15 1183 ± 72 142 ± 9.6 1 6 1.49 ± 0.08 1290 ± 93 149 ± 10.2 3 6 1.50 ± 0.06 1543 ± 112 175 ± 16.2 5 6 1.46 ± 0.09 1552 ± 152 187 ± 19.9 10 6 1.42 ± 0.06 1698 ± 97 212 ± 22.8 15 5 1.36 ± 0.06 1852 ± 137 228 ± 26.9P value <.001 <.001 <0.001
Get Radiology Tree app to read full this article<
Get Radiology Tree app to read full this article<
Get Radiology Tree app to read full this article<
Relationships Between ADC, T1 Mapping, and T1rho with α-SMA Expression and Masson’s Trichrome Staining
Get Radiology Tree app to read full this article<
Get Radiology Tree app to read full this article<
Contralateral Side (Control) Kidneys
Get Radiology Tree app to read full this article<
TABLE 2
Mean Apparent Diffusion Coefficient (ADC) Values, T1 Relaxation Times, and T1rho Values of the Renal Parenchyma (mean ± SD) for Contralateral (Control) Kidneys
Time (d) n (35) ADC (×10 −3 mm 2 /s) T1 Relaxation Time m(ms) T1rho Value (ms) 0 6 1.85 ± 0.14 1184 ± 78 142 ± 8.4 1 6 1.85 ± 0.15 1214 ± 61 139 ± 7.4 3 6 1.91 ± 0.21 1149 ± 58 143 ± 9.4 5 6 1.87 ± 0.15 1171 ± 43 146 ± 8.2 10 6 1.87 ± 0.15 1161 ± 39 144 ± 8.2 15 5 1.90 ± 0.07 1158 ± 57 146 ± 8.9P value .984 .458 .708
Get Radiology Tree app to read full this article<
Discussion
Get Radiology Tree app to read full this article<
Get Radiology Tree app to read full this article<
Get Radiology Tree app to read full this article<
Get Radiology Tree app to read full this article<
Get Radiology Tree app to read full this article<
Get Radiology Tree app to read full this article<
Get Radiology Tree app to read full this article<
Get Radiology Tree app to read full this article<
Get Radiology Tree app to read full this article<
Get Radiology Tree app to read full this article<
Conclusions
Get Radiology Tree app to read full this article<
Get Radiology Tree app to read full this article<
References
1. Eddy A.A.: Molecular basis of renal fibrosis. Pediatr Nephrol 2000; 15: pp. 290-301.
2. Kjolby B.F., Khan A.R., Chuhutin A., et. al.: Fast diffusion kurtosis imaging of fibrotic mouse kidneys. NMR Biomed 2016; 29: pp. 1709-1719.
3. Rastaldi M.P., Ferrario F., Giardino L., et. al.: Epithelial-mesenchymal transition of tubular epithelial cells in human renal biopsies. Kidney Int 2002; 62: pp. 137-146.
4. Mahmoud H., Buchanan C., Francis S.T., et. al.: Imaging the kidney using magnetic resonance techniques: structure to function. Curr Opin Nephrol Hypertens 2016; 25: pp. 487-493.
5. Zhao J., Wang Z.J., Liu M., et. al.: Assessment of renal fibrosis in chronic kidney disease using diffusion-weighted MRI. Clin Radiol 2014; 69: pp. 1117-1122.
6. Togao O., Doi S., Kuro-O M., et. al.: Assessment of renal fibrosis with diffusion-weighted MR imaging: study with murine model of unilateral ureteral obstruction. Radiology 2010; 255: pp. 772-780.
7. Boor P., Perkuhn M., Weibrecht M., et. al.: Diffusion-weighted MRI does not reflect kidney fibrosis in a rat model of fibrosis. J Magn Reson Imaging 2015; 42: pp. 990-998.
8. Zhang J.L., Sigmund E.E., Chandarana H., et. al.: Variability of renal apparent diffusion coefficients: limitations of the monoexponential model for diffusion quantification. Radiology 2010; 254: pp. 783-792.
9. Bohnen S., Radunski U.K., Lund G.K., et. al.: Tissue characterization by T1 and T2 mapping cardiovascular magnetic resonance imaging to monitor myocardial inflammation in healing myocarditis. Eur Heart J Cardiovasc Imaging 2017; 18: pp. 744-751.
10. Radunski U.K., Lund G.K., Saring D., et. al.: T1 and T2 mapping cardiovascular magnetic resonance imaging techniques reveal unapparent myocardial injury in patients with myocarditis. Clin Res Cardiol 2017; 106: pp. 10-17.
11. Wang Y.X., Yuan J., Chu E.S., et. al.: T1rho MR imaging is sensitive to evaluate liver fibrosis: an experimental study in a rat biliary duct ligation model. Radiology 2011; 259: pp. 712-719.
12. Zhao F., Wang Y.X., Yuan J., et. al.: MR T1rho as an imaging biomarker for monitoring liver injury progression and regression: an experimental study in rats with carbon tetrachloride intoxication. Eur Radiol 2012; 22: pp. 1709-1716.
13. Pedersen M., Dissing T.H., Morkenborg J., et. al.: Validation of quantitative BOLD MRI measurements in kidney: application to unilateral ureteral obstruction. Kidney Int 2005; 67: pp. 2305-2312.
14. Chevalier R.L., Forbes M.S., Thornhill B.A.: Ureteral obstruction as a model of renal interstitial fibrosis and obstructive nephropathy. Kidney Int 2009; 75: pp. 1145-1152.
15. Perea R.J., Ortiz-Perez J.T., Sole M., et. al.: T1 mapping: characterisation of myocardial interstitial space. Insights Imaging 2015; 6: pp. 189-202.
16. Friedli I., Crowe L.A., Berchtold L., et. al.: New magnetic resonance imaging index for renal fibrosis assessment: a comparison between diffusion-weighted imaging and T1 mapping with histological validation. Sci Rep 2016; 6: pp. 30088.
17. Lin S.L., Chen R.H., Chen Y.M., et. al.: Pentoxifylline attenuates tubulointerstitial fibrosis by blocking Smad3/4-activated transcription and profibrogenic effects of connective tissue growth factor. J Am Soc Nephrol 2005; 16: pp. 2702-2713.
18. Kaimori J.Y., Isaka Y., Hatanaka M., et. al.: Diffusion tensor imaging MRI with spin-echo sequence and long-duration measurement for evaluation of renal fibrosis in a rat fibrosis model. Transplant Proc 2017; 49: pp. 145-152.
19. Poosti F., Bansal R., Yazdani S., et. al.: Selective delivery of IFN-gamma to renal interstitial myofibroblasts: a novel strategy for the treatment of renal fibrosis. FASEB J 2015; 29: pp. 1029-1042.
20. Jia L., Ma X., Gui B., et. al.: Sorafenib ameliorates renal fibrosis through inhibition of TGF-beta-induced epithelial-mesenchymal transition. PLoS ONE 2015; 10: e0117757
21. Moriyama T., Kawada N., Ando A., et. al.: Up-regulation of HSP47 in the mouse kidneys with unilateral ureteral obstruction. Kidney Int 1998; 54: pp. 110-119.
22. Sun L., Shen Y.L., Liu H.J., et. al.: The expression of response gene to complement 32 on renal ischemia reperfusion injury in rat. Ren Fail 2016; 38: pp. 276-281.
23. Chebotareva N.V., Bobkova I.N., Varshavskii V.A., et. al.: The role of smooth muscle alpha-actin in development of renal fibrosis in patients with chronic glomerulonephritis]. Ter Arkh 2006; 78: pp. 17-21.
24. Badid C., Desmouliere A., Babici D., et. al.: Interstitial expression of alpha-SMA: an early marker of chronic renal allograft dysfunction. Nephrol Dial Transplant 2002; 17: pp. 1993-1998.
25. Cai X.R., Yu J., Zhou Q.C., et. al.: Use of intravoxel incoherent motion MRI to assess renal fibrosis in a rat model of unilateral ureteral obstruction. J Magn Reson Imaging 2016; 44: pp. 698-706.
26. Thoeny H.C., De Keyzer F.: Diffusion-weighted MR imaging of native and transplanted kidneys. Radiology 2011; 259: pp. 25-38.
27. de Miguel M.H., Yeung H.N., Goyal M., et. al.: Evaluation of quantitative magnetic resonance imaging as a noninvasive technique for measuring renal scarring in a rabbit model of antiglomerular basement membrane disease. J Am Soc Nephrol 1994; 4: pp. 1861-1868.
28. Hueper K., Peperhove M., Rong S., et. al.: T1-mapping for assessment of ischemia-induced acute kidney injury and prediction of chronic kidney disease in mice. Eur Radiol 2014; 24: pp. 2252-2260.
29. Duvvuri U., Poptani H., Feldman M., et. al.: Quantitative T1rho magnetic resonance imaging of RIF-1 tumors in vivo: detection of early response to cyclophosphamide therapy. Cancer Res 2001; 61: pp. 7747-7753.
30. Allkemper T., Sagmeister F., Cicinnati V., et. al.: Evaluation of fibrotic liver disease with whole-liver T1rho MR imaging: a feasibility study at 1.5 T. Radiology 2014; 271: pp. 408-415.
31. Wong C.S., Yan C.H., Gong N.J., et. al.: Imaging biomarker with T1rho and T2 mappings in osteoarthritis—in vivo human articular cartilage study. Eur J Radiol 2013; 82: pp. 647-650.
32. Zhao F., Deng M., Yuan J., et. al.: Experimental evaluation of accelerated T1rho relaxation quantification in human liver using limited spin-lock times. Korean J Radiol 2012; 13: pp. 736-742.
33. Wang Y.X., Yuan J.: Evaluation of liver fibrosis with T1rho MR imaging. Quant Imaging Med Surg 2014; 4: pp. 152-155.
34. Hu G., Zhang X., Liang W., et. al.: Assessment of liver fibrosis in rats by MRI with apparent diffusion coefficient and T1 relaxation time in the rotating frame. J Magn Reson Imaging 2016; 43: pp. 1082-1089.