
Rationale and Objectives
Tumor volume is one of the most important factors in evaluating the response to treatment of patients with cancer. The objective of this study was to compare computed tomographic (CT) volume calculation using a semiautomated circumscribing tracing tool (manual circumscription [MC]) to prolate ellipsoid volume calculation (PEVC; bidimensional measurement multiplied by coronal long axis) and determine which was more accurate and consistent.
Materials and Methods
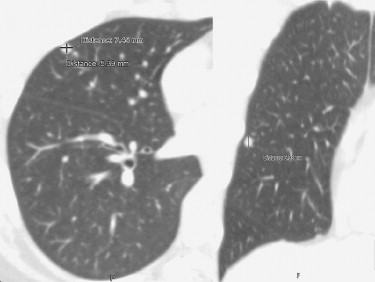
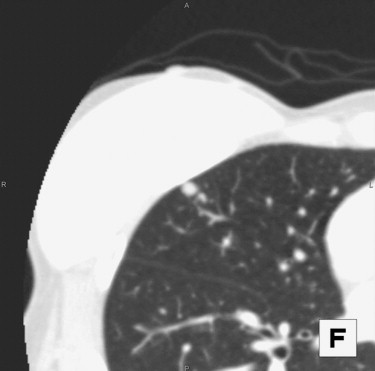
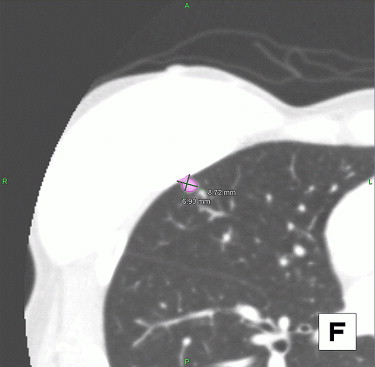
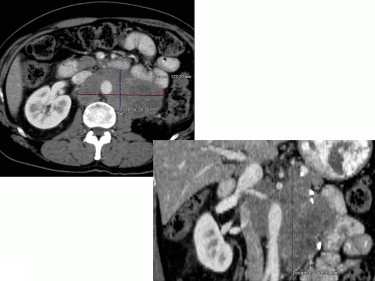
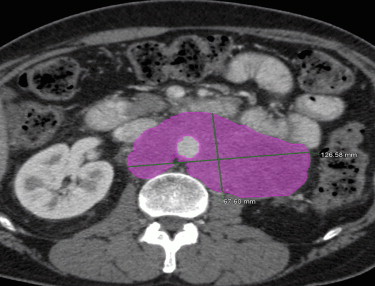
The study included six patients with nine neoplasms, six phantoms, and two radiologists. The neoplasms and phantoms of varying sizes and shapes were imaged using multidetector CT scanners, with slice thicknesses ranging from 0.5 to 3 mm. Measurements were performed using a TeraRecon 3D workstation. Each lesion and phantom was manually circumscribed, and its three dimensions were measured. The measurements were repeated 2 weeks later.
Results
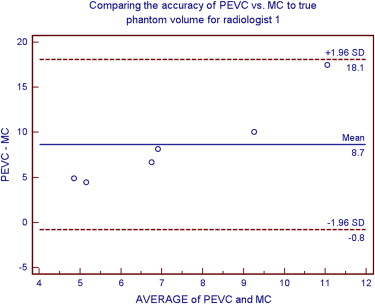
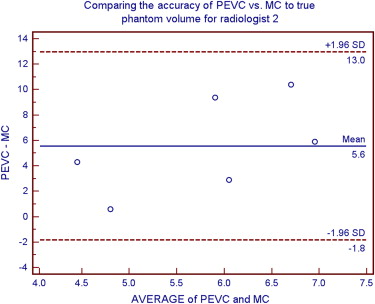
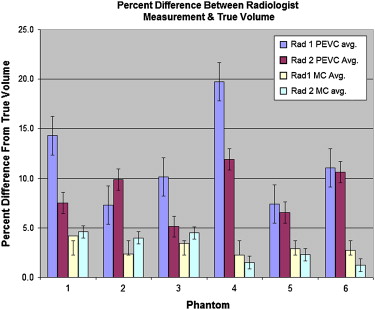
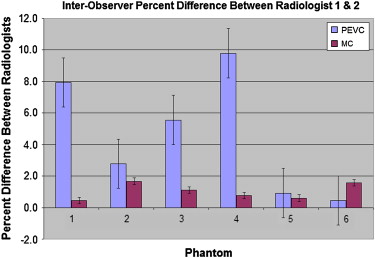
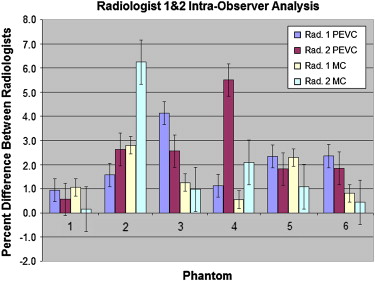
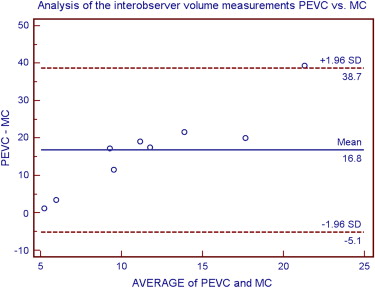
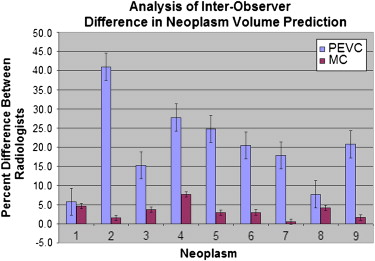
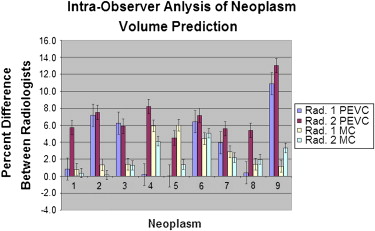
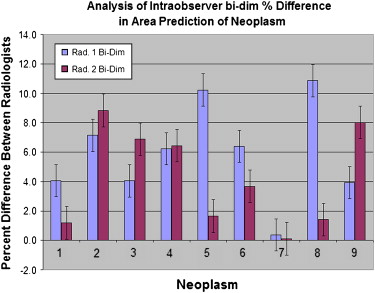
MC of the phantoms deviated from their true volumes by an average of 3.0 ± 1%, whereas PEVC deviated by 10.1 ± 3.99%. MC interobserver readings varied by 1.2 ± 0.6% and PEVC by 4.8 ± 3.3%. MC intraobserver readings varied by 1.95 ± 1.75% and PEVC by 2.5 ± 1.55%. Patient tumor volume predicted by MC and PEVC varied greatly; MC interobserver readings differed by 3.3 ± 2.1% and PEVC by 20.1 ± 10.6%. MC intraobserver readings varied by 2.5 ± 1.9% and PEVC by 5.5 ± 3.2%. Variability was greater for complex shapes than for simple shapes. Bidimensional analysis demonstrated an interobserver difference of 12.1 ± 8.7% and an intraobserver difference of 5.05 ± 3.3%. These results demonstrate large interobserver and intraobserver variability. Variability was greater for complex shapes than for simple shapes.
Conclusion
MC of neoplasms provided more accurate and consistent volume predictions than PEVC. More complicated shapes demonstrated the superiority of MC over PEVC.
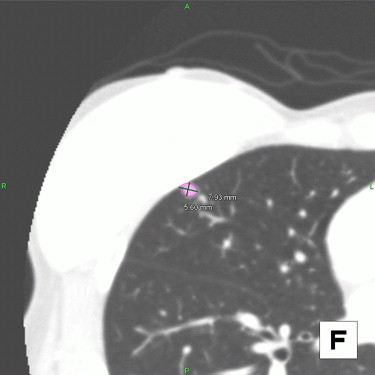
Evaluating initial mass size and changes in mass size over time to differentiate malignancies from benign masses and evaluate the response to therapy of known neoplasms is often accomplished by performing bidimensional measurements. For example, lung nodules ≤ 4 mm are generally considered benign, whereas nodules > 8 mm bear a substantial risk for malignancy ( ).
Current clinical practice relies on diameter measurement as a surrogate for volume when evaluating the response to therapy of patients with cancer. Small inconsistencies in diameter measurement cause large changes in apparent volume (ie, a 25% increase in diameter results in a doubling of the volume). Growth rate can also be used to differentiate malignant masses from benign ones. The doubling time of malignant tumors generally ranges from 30 to 500 days, with a median of 100 days ( ).
Get Radiology Tree app to read full this article<
Get Radiology Tree app to read full this article<
Materials and methods
Get Radiology Tree app to read full this article<
Get Radiology Tree app to read full this article<
Get Radiology Tree app to read full this article<
Get Radiology Tree app to read full this article<
Get Radiology Tree app to read full this article<
Get Radiology Tree app to read full this article<
Results
Get Radiology Tree app to read full this article<
Get Radiology Tree app to read full this article<
Get Radiology Tree app to read full this article<
Get Radiology Tree app to read full this article<
Get Radiology Tree app to read full this article<
Get Radiology Tree app to read full this article<
Get Radiology Tree app to read full this article<
Get Radiology Tree app to read full this article<
Get Radiology Tree app to read full this article<
Get Radiology Tree app to read full this article<
Get Radiology Tree app to read full this article<
Get Radiology Tree app to read full this article<
Get Radiology Tree app to read full this article<
Discussion
Get Radiology Tree app to read full this article<
Get Radiology Tree app to read full this article<
Get Radiology Tree app to read full this article<
Get Radiology Tree app to read full this article<
Get Radiology Tree app to read full this article<
Get Radiology Tree app to read full this article<
Conclusion
Get Radiology Tree app to read full this article<
References
1. MacMahon H., Austin J.H.M., Gamsu G., et. al.: Guidelines for management of small pulmonary nodules detected on CT scans: a statement from the Fleischner Society. Radiology 2005; 237: pp. 395-400.
2. Gurney J.W.: Doubling time. http://www.chestx-ray.com/SPN/DoublingTime.html Accessed June 2007
3. Bolte H., Jahnke T., Schafer F.K., et. al.: Interobserver-variability of lung nodule volumetry considering different segmentation algorithms and observer training levels. Eur J Radiol 2007; 64: pp. 285-295.
4. Cheson B.D., Pfistner B., Juweid M.E., et. al.: Revised response criteria for malignant lymphoma. J Clin Oncol 2007; 25: pp. 579-586.