
Rationale and Objectives
Median survival of patients with idiopathic pulmonary fibrosis (IPF) is 2–5 years. Sensitive imaging metrics can play a role in detecting early changes in therapeutic development. The aim of the present study was to compare known computed tomography (CT) histogram kurtosis and a classifier-based quantitative score to assess baseline severity and change over time in patients with IPF.
Materials and Methods
A total of 57 patients with at least baseline and paired follow-up scans were selected from an imaging database of standardized CT scans obtained from patients with IPF. CT histogram measurement of kurtosis and quantitative lung fibrosis (QLF) and quantitative interstitial lung disease (QILD) scores from a classification algorithm were calculated. Spearman rank correlations were used to assess associations between baseline severity and changes for all CT-derived measures compared to forced vital capacity (FVC) and carbon monoxide diffusion capacity (DL CO ) (percent predicted).
Results
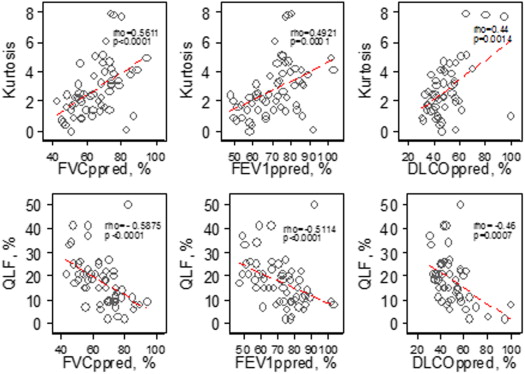
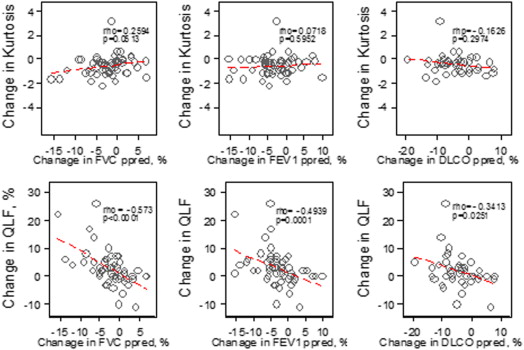
At baseline, mean (±SD) of kurtosis was 2.43 (±1.83). Mean (±SD) values of QLF and QILD scores were 20.7% (±13.4) and 43.3% (±20.0), respectively. All baseline histogram indices and QLF and QILD scores were correlated well with baseline FVC and DL CO . When assessing associations with changes in FVC and DL CO over time, only QLF score was statistically significant (ρ = −0.57; P < .0001 for FVC and ρ = −0.34; P = .025 for DL CO ), whereas kurtosis was not.
Conclusions
Classifier-model-derived scores (QLF and QILD), based on a set of texture features, are associated with baseline disease extent and are also a sensitive measure of change over time. A QLF score can be used for measuring the extent of disease severity and longitudinal changes.
Idiopathic pulmonary fibrosis (IPF) is a rare and ultimately fatal lung disease of unknown cause with a median survival of 2–5 years . Although several studies have identified risk factors and histopathologic features, the natural history of IPF is poorly understood and the rate of progression for a given patient can be unpredictable. Disease progression ranges from very rapid to remaining stable over several years and may be punctuated by acute worsening . Diagnosing IPF can also be challenging as distinct from other diffuse lung diseases . High-resolution computed tomography (HRCT) plays an indispensable role in the diagnosis of IPF. Predicating the presence of a classically subpleural, basilar distribution of interstitial abnormalities, or other known causes of interstitial lung disease, the HRCT features obviate the need for surgical biopsy . Evidence of classic visual feature of IPF on thoracic CT is often used as inclusion criteria in clinical trials. Guidelines have been developed for assigning a confidence to a diagnosis of IPF on CT . There are currently very limited treatment options for patients diagnosed with IPF. Important to the success of IPF clinical trials are the inclusion of correctly characterized patients and the demonstration of clinically meaningful benefits .
Development of a sensitive surrogate measure for IPF has become increasingly urgent, as the understanding of underlying pathophysiology of IPF has led to several potential, new antifibrotic therapies . In measuring treatment outcomes, a change in forced vital capacity (FVC) has been most often used. The progression is normally defined as 10% drop in FVC. The implication of progression in FVC differs in patients with moderate and severe IPF. Other outcomes have included the 6-minute walk test, carbon monoxide diffusion capacity (DL CO ), and quality of life instruments . More recently the Food and Drug Administration suggested that mortality as an ideal endpoint be used in pivotal clinical trials . The usage of survival requires large study populations and long trials making this economically and logistically challenging. Overall survival as an outcome need to consider systematic biases at clinical centers, socioeconomic status, and censoring because of lung transplant if a patient is eligible . Development and evaluation of the HRCT method, whose measurement is sensitive to the early localized changes, is important to assess or confirm the effect of therapy on patients with IPF.
Get Radiology Tree app to read full this article<
Get Radiology Tree app to read full this article<
Get Radiology Tree app to read full this article<
Materials and methods
Patient Selection
Get Radiology Tree app to read full this article<
CT Scanning Protocol
Get Radiology Tree app to read full this article<
Quantitative CT Image Analysis
Get Radiology Tree app to read full this article<
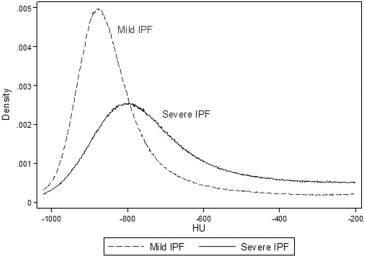
CT Histogram Features
Get Radiology Tree app to read full this article<
Kurtosis=(x−x¯)4[∑(x−x¯)2]2−3, Kurtosis
=
(
x
−
x
¯
)
4
[
∑
(
x
−
x
¯
)
2
]
2
−
3
,
where x indicates CT density ranging from −1024 to +200 HU and x¯ x
¯ is the mean Hounsfield unit value from the CT attenuation histogram.
Get Radiology Tree app to read full this article<
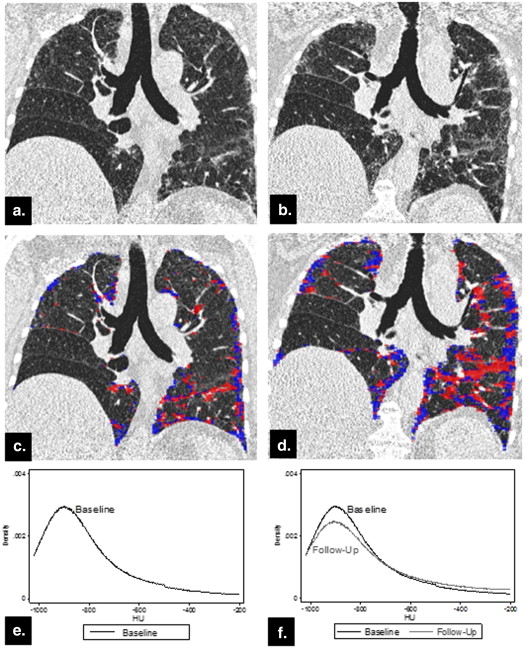
Quantitative CT Scores from Texture Classification Model
Get Radiology Tree app to read full this article<
Get Radiology Tree app to read full this article<
QLFscore(%)=voxelsclassifiedasreticularpatternstotalsamples×100, QLF
score
(
%
)
=
v
o
x
e
l
s
c
l
a
s
s
i
f
i
e
d
a
s
r
e
t
i
c
u
l
a
r
p
a
t
t
e
r
n
s
t
o
t
a
l
s
a
m
p
l
e
s
×
100
,
QLFvolume(L)=(QLFscore/100)×segmentedlungorlobarvolume(L), QLF
volume
(
L
)
=
(
Q
L
F
s
c
o
r
e
/
100
)
×
s
e
g
m
e
n
t
e
d
l
u
n
g
o
r
l
o
b
a
r
v
o
l
u
m
e
(
L
)
,
QILDscore(%)=voxelsclassifiedasabnomalpatternstotalsamples×100, QILD
score
(
%
)
=
v
o
x
e
l
s
c
l
a
s
s
i
f
i
e
d
a
s
a
b
n
o
m
a
l
p
a
t
t
e
r
n
s
t
o
t
a
l
s
a
m
p
l
e
s
×
100
,
QILDvolume(L)=(QILDscore/100)×segmentedlungorlobarvolume(L). QILD
volume
(
L
)
=
(
Q
I
L
D
s
c
o
r
e
/
100
)
×
s
e
g
m
e
n
t
e
d
l
u
n
g
o
r
l
o
b
a
r
v
o
l
u
m
e
(
L
)
.
Get Radiology Tree app to read full this article<
Statistical Analysis
Get Radiology Tree app to read full this article<
Get Radiology Tree app to read full this article<
Results
Descriptive Summary Statistics
Get Radiology Tree app to read full this article<
Table 1
Characteristics of Idiopathic Pulmonary Fibrosis Subjects
Variables Baseline ( N = 57) Follow-Up ( N = 57)P value Mean (SD) Median (IQR) Mean (SD) Median (IQR) Pulmonary function tests TLC volume ∗ (L) 4.11 (0.96) 4.13 (0.87) 3.93 (1.01) 4.04 (1.42) .2190 RV volume ∗ (L) 1.50 (0.69) 1.44 (0.81) 1.36 (0.52) 1.31 (0.81) .9523 FVC (% pred) 65.18 (12.44) 66.40 (18.80) 62.79 (14.05) 63.60 (18.40) .0001 † FEV 1 (% pred) 71.34 (13.03) 72.60 (18.30) 68.28 (14.82) 69.00 (20.70) <.0001 DL CO ∗ (% pred) 49.67 (14.19) 47.00 (15.70) 45.18 (13.53) 44.50 (17.50) <.0001 CT histogram indexes Kurtosis 2.81 (1.83) 2.38 (2.44) 2.26 (1.77) 1.83 (1.93) <.0001 † Mean −768.28 (53.62) −772.87 (63.88) −756.40 (62.82) −757.91 (79.06) .0329 † Variance 44,299.30 (15,065.58) 42,578.12 (21,196.77) 44,299.30 (15,065.58) 42,578.12 (21,196.77) .1626 Skewness 1.58 (0.42) 1.59 (0.53) 1.47 (0.43) 1.46 (0.53) <.0001 Entropy 6.37 (0.24) 6.33 (0.29) 6.39 (0.27) 6.36 (0.31) .1741 Median −829.32 (50.63) −832.00 (62.00) −819.67 (56.90) −817.00 (58.00) .0811 Quantitative CT texture scores QLF score (%) 17.63 (10.10) 17.00 (13.00) 20.37 (11.99) 18.00 (14.00) <.0001 † Ground glass score (%) 17.53 (7.44) 16.00 (11.00) 17.25 (7.30) 17.00 (10.00) .6435 QILD score (%) 39.02 (17.22) 38.00 (21.00) 41.33 (17.86) 39.00 (23.00) .0453 QLF volume (L) 0.63 (0.39) 0.56 (0.31) 0.71 (0.41) 0.64 (0.35) .0002 Ground glass volume (L) 0.63 (0.23) 0.61 (0.35) 0.61 (0.25) 0.61 (0.33) .6590 QILD volume (L) 1.39 (0.63) 1.30 (0.55) 1.46 (0.65) 1.31 (0.64) .0521 †
CT, computed tomography; TLC, total lung capacity; RV, residual volume. DL CO , carbon monoxide diffusion capacity; FEV, forced expiratory volume in 1 second; FVC, forced vital capacity; IQR, interquartile range; QLF, quantitative lung fibrosis; QILD, quantitative interstitial lung disease; SD, standard deviation.
Get Radiology Tree app to read full this article<
Get Radiology Tree app to read full this article<
Get Radiology Tree app to read full this article<
Get Radiology Tree app to read full this article<
Get Radiology Tree app to read full this article<
Associations
Whole Lung
Get Radiology Tree app to read full this article<
Table 2
Association at Baseline at Whole Lung
Baseline Percent Predicted FVC (%), N = 57 Percent Predicted FEV 1 (%), N = 57 Percent Predicted DL CO (%), N = 51 CT histogram indexes Kurtosis 0.56 ( P < .0001) 0.49 ( P = .0001) 0.44 ( P = .0014) Mean −0.60 ( P < .0001 ) −0.45 ( P = .0005) −0.36 ( P = .0094) Variance −0.55 ( P < .0001) −0.56 ( P < .0001) −0.31 ( P = .0264) Skewness 0.50 ( P < .0001) 0.43 ( P = .0007) 0.07 ( P = .003) Entropy −0.54 ( P < .0001) −0.51 ( P < .0001) −0.44 ( P = .0013) Median −0.22 ( P = .107) −0.17 ( P = .197) −0.2544 ( P = .072) Quantitative CT texture scores QLF score (%) −0.59 ( P < .0001) −0.51 ( P < .0001) −0.46 ( P = .0007) Ground glass (%) −0.36 ( P = .0053) −0.20 ( P = .1270) −0.28 ( P = .0431) QILD score (%) −0.58 ( P < .0001) −0.50 ( P = .0001) −0.45 ( P = .0009) QLF volume (L) −0.44 ( P = .0006) − 0.38 (P = .0033) −0.35 ( P = .0123) Ground glass (L) −0.04 ( P = .75) 0.059 ( P = .66) 0.04 ( P = .78) QILD volume (L) −0.30 ( P = .021) −0.25 ( P = .064) −0.22 ( P = .117)
CT, computed tomography; DL CO , carbon monoxide diffusion capacity; FEV, forced expiratory volume in 1 second; FVC, forced vital capacity; QLF, quantitative lung fibrosis; QILD, quantitative interstitial lung disease.
Get Radiology Tree app to read full this article<
Get Radiology Tree app to read full this article<
Table 3
Association in the Change Assessment for Whole Lung
Changes Percent Predicted FVC (%), N = 57, ρ ( P value) Percent Predicted FEV 1 (%), N = 57, ρ ( P value) DL CO (%), N = 43, ρ ( P value) CT histogram indexes Kurtosis 0.26 ( P = .0513) 0.0719 ( P = .60) −0.1626 ( P = .30) Mean −0.54 ( P < .0001) −0.4442 ( P = .0005) −0.2384 ( P = .12) Variance −0.22 ( P = .1061) −0.2077 ( P = .1211) −0.2505 ( P = .11) Skewness 0.41 ( P = .0017) 0.2116 ( P = .1140) 0.0414 ( P = .79) Entropy −0.36 ( P = .0055) −0.3195 ( P = .0154) −0.2605 ( P = .0916) Median −0.52 ( P < .0001) −0.4099 ( P = .0015) −0.2459 ( P = .11) Quantitative CT texture scores QLF score (%)−0.57 (P < .0001) −0.49 ( P = .0001) −0.34 ( P = .0251) Ground glass (%) −0.31 ( P = .0185) −0.26 ( P = .0512) −0.034 ( P = .83) QILD score (%) −0.45 ( P = .0004) −0.39 ( P = .0030) −0.21 ( P = .17) QLF volume (L)−0.51 ( P < .0001) −0.44 ( P = .0005) −0.37 ( P = .0149) Ground glass (L) −0.19 ( P = .15) −0.14 ( P = .32) 0.018 ( P = .91) QILD volume (L) −0.38 ( P = .0033) −0.34 ( P = .0103) −0.27 ( P = .0753)
CT, computed tomography; DL CO , carbon monoxide diffusion capacity; FEV, forced expiratory volume in 1 second; FVC, forced vital capacity; QLF, quantitative lung fibrosis; QILD, quantitative interstitial lung disease.
Get Radiology Tree app to read full this article<
Get Radiology Tree app to read full this article<
Lobes
Get Radiology Tree app to read full this article<
Table 4
Association in Each Lobe and Lung
Parenchymal Regions Baseline ( N = 57) Changes ( N = 57) QLF Score vs. Percent Predicted FVC (%), ρ ( P value) Kurtosis vs. Percent Predicted FVC (%), ρ ( P value) Skewness vs. Percent Predicted FVC (%), ρ ( P value) QLF Score vs. Percent Predicted FVC (%), ρ ( P value) Kurtosis vs. Percent Predicted FVC (%), ρ ( P value) Skewness vs. Percent Predicted FVC (%), ρ ( P value) Right upper lobe −0.48 ( P = .0002) 0.41 ( P = .0015) 0.37 ( P = .0041) −0.53 ( P < .0001) 0.36 ( P = .0062) 0.37 ( P = .0045) Right middle lobe −0.52 ( P < .0001) 0.49 ( P = .0001) 0.46 ( P = .0003) −0.40 ( P = .0023) 0.21 ( P = .12) 0.22 ( P = .0993) Right lower lobe −0.41 ( P = .0013) 0.44 ( P = .0005) 0.39 ( P = .0027) −0.54 ( P < .0001) 0.19 ( P = .17) 0.34 ( P = .0108) Left upper lobe −0.60 ( P < .0001) 0.53 ( P < .0001) 0.48 ( P = .0001) −0.56 ( P < .0001) 0.26 ( P = .0479) 0.38 ( P = .0036) Left lower lobe −0.55 ( P < .0001) 0.55 ( P < .0001) 0.49 ( P = .0001) −0.53 ( P < .001) 0.34 ( P = .0089) 0.48 ( P = .0002) Right lung −0.54 ( P < .0001) 0.52 ( P < .0001) 0.47 ( P = .0002) −0.55 ( P < .0001) 0.23 ( P = .0908) 0.34 ( P = .0095) Left lung −0.60 ( P < .0001) 0.54 ( P < .0001) 0.48 ( P = .0001) −0.54 ( P < .0001) 0.29 ( P = .0275) 0.44 ( P = .0006)
FVC, forced vital capacity; QLF, quantitative lung fibrosis.
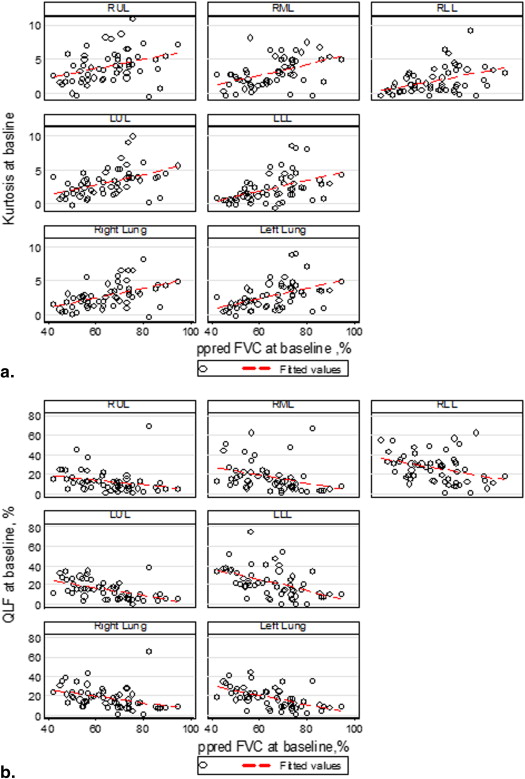
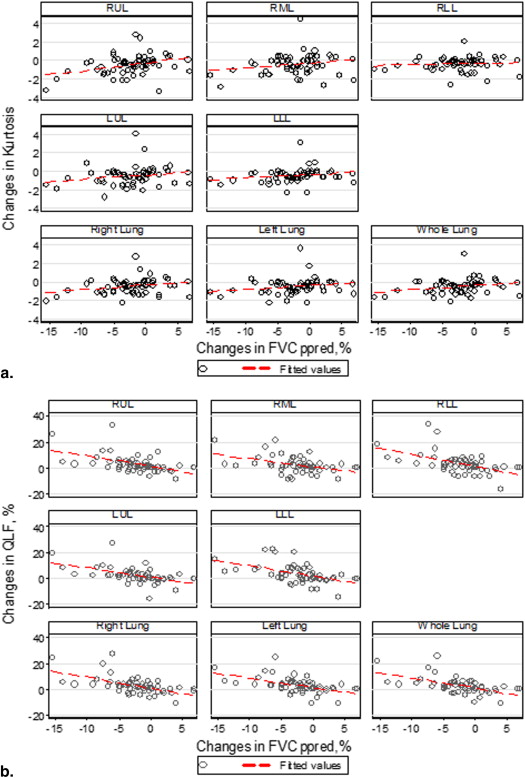
Table 5
Association in Each Lobe and Lung
Parenchymal Regions Baseline ( N = 51) Changes ( N = 43) QLF Score vs. Percent Predicted DL CO (%), ρ ( P value) Kurtosis vs. Percent Predicted DL CO (%), ρ ( P value) Skewness vs. Percent Predicted DL CO (%), ρ ( P value) QLF Score vs. Percent Predicted DL CO (%), ρ ( P value) Kurtosis vs. Percent Predicted DL CO (%), ρ ( P value) Skewness vs. Percent Predicted DL CO (%), ρ ( P value) Right upper lobe −0.37 ( P = .0078) 0.36 ( P = .0097) 0.30 ( P = .0302) −0.31 ( P = .0462) 0.04 ( P = .80) 0.074 ( P = .64) Right middle lobe −0.39 ( P = .0049) 0.35 ( P = .0116) 0.30 ( P = .0331) −0.17 ( P = .27) −0.13 ( P = .41) −0.10 ( P = .50) Right lower lobe −0.38 ( P = .0057) 0.43 ( P = .0019) 0.35 ( P = .0117) −0.24 ( P = .12) −0.15 ( P = .33) −0.034 ( P = .83) Left upper lobe −0.43 ( P = .0016) 0.39 ( P = .0050) 0.32 ( P = .0200) −0.30 ( P = .0537) 0.004 ( P = .98) 0.17 ( P = .27) Left lower lobe −0.49 ( P = .0002) 0.45 ( P = .0008) 0.39 ( P = .0044) −0.33 ( P = .0294) −0.0168 ( P = .92) 0.19 ( P = .22) Right lung −0.43 ( P = .0016) 0.42 ( P = .0022) 0.38 ( P = .0055) −0.27 ( P = .079) 0.20 ( P = .21) −0.0439 ( P = .78) Left lung −0.48 ( P = .0004) 0.43 ( P = .0016) 0.38 ( P = .0056) −0.32 ( P = .034) −0.078 ( P = .62) 0.25 ( P = .11)
DL CO , carbon monoxide diffusion capacity; QLF, quantitative lung fibrosis.
Get Radiology Tree app to read full this article<
Discussion
Get Radiology Tree app to read full this article<
Get Radiology Tree app to read full this article<
Get Radiology Tree app to read full this article<
Get Radiology Tree app to read full this article<
Get Radiology Tree app to read full this article<
Get Radiology Tree app to read full this article<
Get Radiology Tree app to read full this article<
Get Radiology Tree app to read full this article<
References
1. Schwartz D.A., Helmers R.A., Galvin J.R., et. al.: Determinants of survival in idiopathic pulmonary fibrosis. Am J Respir Crit Care Med 1994; 149: pp. 450-454.
2. Raghu G., Weycker D., Edelsberg J., et. al.: Incidence and prevalence of idiopathic pulmonary fibrosis. Am J Respir Crit Care Med 2006; 74: pp. 810-816.
3. Olson A.L., Swigris J.: Idiopathic pulmonary fibrosis: diagnosis and epidemiology. Clin Chest Med 2012; 33: pp. 41-50.
4. GarcÃa-Sancho C., BuendÃa-RoldÃn I., FernÃndez-Plata M.R., et. al.: Familial pulmonary fibrosis is the strongest risk factor for idiopathic pulmonary fibrosis. Respir Med 2001; 105: pp. 1902-1907.
5. King T.E., Schwarz M.I., Brown K., et. al.: Idiopathic pulmonary fibrosis: relationship between histopathologic features and mortality. Am J Respir Crit Care Med 2001; 164: pp. 1025-1032.
6. Ley B., Ryerson C.J., Vittinghoff E., et. al.: A multidimensional index and staging system for idiopathic pulmonary fibrosis. Ann Intern Med 2012; 156: pp. 684-691.
7. du Bois R.M., Weycker D., Albera C., et. al.: Ascertainment of individual risk of mortality for patients with idiopathic pulmonary fibrosis. Am J Respir Crit Care Med 2011; 184: pp. 459-466.
8. Wells A.U., Desai S.R., Rubens M.B., et. al.: Idiopathic pulmonary fibrosis: a composite physiologic index derived from disease extent observed by computed tomography. Am J Respir Crit Care Med 2003; 167: pp. 962-969.
9. Latsi P.I., du Bois R.M., Nicholson A.G., et. al.: Fibrotic idiopathic interstitial pneumonia: the prognostic value of longitudinal functional trends. Am J Respir Crit Care Med 2003; 168: pp. 531-537.
10. Raghu G., Collard H.R., Egan J., et. al.: An official ATS/ERS/JRS/ALAT statement: idiopathic pulmonary fibrosis: evidence-based guidelines for diagnosis and management. Am J Respir Crit Care Med 2011; 183: pp. 788-824.
11. Hodnett P.A., Naidich D.P.: Fibrosing interstitial lung disease. A practical high-resolution computed tomography-based approach to diagnosis and management and a review of the literature. Am J Respir Crit Care Med 2013; 188: pp. 141-149.
12. Raghu G., Collard H.R., Anstrom K.J., et. al.: Idiopathic pulmonary fibrosis: clinically meaningful primary endpoints in phase 3 clinical trials. Am J Respir Crit Care Med 2012; 185: pp. 1044-1048.
13. Cottin V.: Interstitial lung disease. Eur Respir Rev 2013; 22: pp. 26-32.
14. Woodcock H.V., Molyneaux P.L., Maher T.M.: Reducing lung function decline in patients with idiopathic pulmonary fibrosis: potential of nintedanib. Drug Des Devel Ther 2013; 7: pp. 503-510.
15. Adamali H.I., Maher T.M.: Current and novel drug therapies for idiopathic pulmonary fibrosis. Drug Des Devel Ther 2012; 6: pp. 261-272.
16. Loomis-King H., Flaherty K.R., Moore B.B.: Pathogenesis, current treatment and future direction for idiopathic pulmonary fibrosis. Curr Opin Pharmacol 2013; 13: pp. 377-385.
17. O’Connell O.J., Kennedy M.P., Henry M.T.: Idiopathic pulmonary fibrosis: treatment update. Adv Ther 2011; 28: pp. 986-999.
18. Mahendran S., Sethi T.: Treatments in idiopathic pulmonary fibrosis: time for a more targeted approach?. QJM 2012; 105: pp. 929-934.
19. Maher T.M.: PROFILEing idiopathic pulmonary fibrosis: rethinking biomarker discovery. Eur Respir Rev 2013; 22: pp. 148-152.
20. US Food and Drug Administration (FDA): Title of Advisory Committee document.2010.FDAMaryland Available at: http://www.fda.gov/downloads/AdvisoryCommittees/CommitteesMeetingMaterials/Drugs/Pulmonary-AllergyDrugsAdvisoryCommittee/UCM203081.pdf Accessed April 18, 2014
21. Kotloff R.M., Thabut G.: Lung Transplantation. Am J Respir Crit Care Med 2011; 184: pp. 159-171.
22. Best A.C., Lynch A.M., Bozic C.M., et. al.: Quantitative CT indexes in idiopathic pulmonary fibrosis: relationship with physiologic impairment. Radiology 2003; 228: pp. 407-414.
23. Lynch D.A.: Quantitative CT of fibrotic interstitial lung disease. Chest 2007; 131: pp. 643-644.
24. Camiciottoli G., Orlandi I., Bartolucci M., et. al.: Lung CT densitometry in systemic sclerosis: correlation with lung function, exercise testing, and quality of life. Chest 2007; 131: pp. 672-681.
25. Best A.C., Meng J., Lynch A.M., et. al.: Idiopathic pulmonary fibrosis: physiologic tests, quantitative CT indexes, and CT visual scores as predictors of mortality. Radiology 2008; 246: pp. 935-940.
26. Uppaluri R., Hoffman E.A., Sonka M., et. al.: Computer recognition of regional lung disease patterns. Am J Respir Crit Care Med 1999; 160: pp. 648-654.
27. Chabat F., Yang G.Z., Hansell D.M.: Obstructive lung diseases: texture classification for differentiation at CT. Radiology 2003; 228: pp. 871-877.
28. Zavaletta V.A., Bartholmai B.J., Robb R.A.: High resolution multidetector CT-aided tissue analysis and quantification of lung fibrosis. Acad Radiol 2007; 14: pp. 772-787.
29. Kim H.G., Tashkin D.P., Clements P.J., et. al.: A computer-aided diagnosis system for quantitative scoring of extent of lung fibrosis in scleroderma patients. Clin Exp Rheumatol 2010; 28: pp. S26-S35.
30. Kim H.J., Li G., Gjertson D., et. al.: Classification of parenchymal abnormality in scleroderma lung using a novel approach to denoise images collected via a multicenter study. Acad Radiol 2008; 15: pp. 1004-1016.
31. Maldonado F., Moua T., Rajagopalan S., et. al.: Automated quantification of radiologic patterns predicts survival in idiopathic pulmonary fibrosis. Eur Respir J 2013; 43: pp. 204-212.
32. Bartholmai B.J., Raghunath S., Karwoski R.A., et. al.: Quantitative computed tomography imaging of interstitial lung diseases. J Thorac Imaging 2013; 28: pp. 298-307.
33. Kim H.J., Brown M.S., Elashoff R., et. al.: Quantitative texture-based assessment of one-year changes in fibrotic reticular patterns on HRCT in scleroderma lung disease treated with oral cyclophosphamide. Eur Radiol 2011; 21: pp. 2455-2465.
34. Brown M.S., Kim H.J., Abtin F., et. al.: Reproducibility of lung and lobar volume measurements using computed tomography. Acad Radiol 2010; 17: pp. 316-322.
35. Cramer D.: Fundamental statistics for social research.1st ed.1997.RoutledgeNew York NYpp. 89-90.
36. Biomarkers Definitions Working Group: Biomarkers and surrogate endpoints: preferred definitions and conceptual framework. Clin Pharmacol Ther 2001; 69: pp. 89-95.
37. Temple R.J.: A regulatory authority’s opinion about surrogate endpoints.Nimmo W.S.Tucker G.T.Clinical measurement in drug evaluation.1995.John WileyNew York:pp. 1-22.
38. Fan J., Li J.: Variable selection via nonconcave penalized likelihood and its oracle properties. J Am Stat Assoc 2001; 96: pp. 1348-1360.
39. Vapnik V.N.: The nature of statistical learning theory.2nd ed.1999.SpringerNew York, NYpp. 138-160.
40. Gay S.E., Kazerooni E.A., Toews G.B., et. al.: Idiopathic pulmonary fibrosis: predicting response to therapy and survival. Am J Respir Crit Care Med 1998; 157: pp. 1063-1072.
41. Tashkin D.P., Elashoff R., Clements P.J., et. al.: Cyclophosphamide versus placebo in scleroderma lung disease. N Engl J Med 2006; 354: pp. 2655-2666.
42. du Bois R.M., Weycker D., Albera C., et. al.: Forced vital capacity in patients with idiopathic pulmonary fibrosis: test properties and minimal clinically important difference. Am J Respir Crit Care Med 2011; 184: pp. 1382-1389.
43. Wells A.U.: Forced vital capacity as a primary end point in idiopathic pulmonary fibrosis treatment trials: making a silk purse from a sow’s ear. Thorax 2013; 68: pp. 309-310.