
Rationale and Objectives
Accuracy of radiologic assessment may have a crucial impact on clinical studies and therapeutic decisions. We compared the variability of a central radiologic assessment (RECIST) and computer-aided volume-based assessment of lung lesions in patients with metastatic renal cell carcinoma (RCC).
Materials and Methods
The investigation was prospectively planned as a substudy of a clinical randomized phase IIB therapeutic trial in patients with RCC. Starting with the manual study diameter (SDM) of the central readers using RECIST in the clinical study, we performed computer-aided volume measurements. We compared SDM to an automated RECIST diameter (aRDM) and the diameter of a volume-equivalent sphere (effective diameter [EDM]), both for the individual size measurements and for the change rate (CR) between consecutive time points. One hundred thirty diameter pairs of 30 lung lesions from 14 patients were evaluable, forming 55 change pairs over two consecutive time points each.
Results
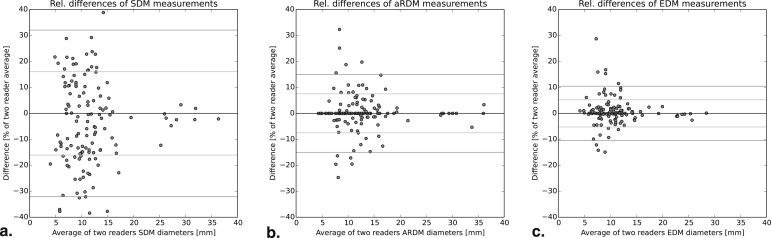
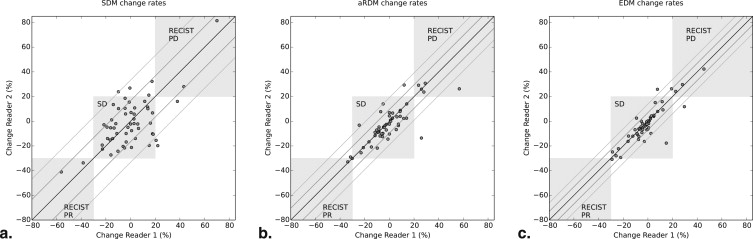
The SDMs of two different readers showed a correlation of 95.6%, whereas the EDMs exhibited an excellent correlation of 99.4%. Evaluation of CRs showed an SDM-CR correlation of 63.9%, which is substantially weaker than the EDM-CR correlation of 87.6%. The variability of SDM-CR is characterized by a median absolute difference of 11.4% points versus the significantly lower 1.8% points EDM-CRs variability (aRDM: 3.2% points). The limits of agreement between readers suggest that an EDM change of 10% or 1 mm can already be significant.
Conclusions
Computer-aided volume-based assessments result in markedly reduced variability of parameters describing size and change, which may offer an advantage of earlier response evaluations and treatment decisions for patients.
Clinical oncologic development studies have sought to improve the precision of radiology assessments and to reduce the inter-reader variability impacting on study endpoints such as time to progression (TTP), progression-free survival (PFS), or response rate by using a central blinded radiology review. Although this standardized approach entailing two-skilled readers and an adjudicator in case of divergent results has increased the data quality, further improvement may be of high interest. It has been documented that intraobserver and interobserver variability of radiologic assessment (RECIST) measurements of lung lesions is considerable and may lead to significant misclassifications . However, it has also been shown that computer-aided volumetric assessment of lung nodules may allow a reliable classification as progressive disease (PD) at a volume increase of 27%, as opposed to 73% (73% volumetric increase correspond to 20% increase in the sum of longest diameters) that is required by RECIST .
In this study, we investigate in more detail how computer-aided assessment of lung lesions reduces the measurement variability compared to manual measurements of in-plane lesion diameters as performed in clinical trials according to RECIST. Furthermore, we put a special focus on how this reduction translates to the variability of change rates (CRs) computed from follow-up measurements and whether the RECIST thresholds could be adapted.
Material and methods
Material
Get Radiology Tree app to read full this article<
Get Radiology Tree app to read full this article<
Get Radiology Tree app to read full this article<
Get Radiology Tree app to read full this article<
EDM :=(6πVolume)1/3 EDM :
=
(
6
π
Volume
)
1
/
3
Get Radiology Tree app to read full this article<
Get Radiology Tree app to read full this article<
Methods
Get Radiology Tree app to read full this article<
Get Radiology Tree app to read full this article<
Get Radiology Tree app to read full this article<
Get Radiology Tree app to read full this article<
Get Radiology Tree app to read full this article<
Get Radiology Tree app to read full this article<
Get Radiology Tree app to read full this article<
Get Radiology Tree app to read full this article<
Results
Analysis of Size Measurements
Get Radiology Tree app to read full this article<
Get Radiology Tree app to read full this article<
Get Radiology Tree app to read full this article<
Table 1
Statistics of Size Measurement Variability in Three Types of Diameters Measured Twice on Each Combination of Lesion and Time Point
N = 130 Pairs Per Diameter Type SDM aRDM EDM Pearson’s correlation ρ 95.6% 99.0% 99.4% Mean absolute values of relative difference 13.5% 4.27% 2.97% Median absolute values of relative difference 12.6% 1.55% 1.44% 2-sigma confidence intervals of relative differences ±33.0% ±15.0% ±10.5% 2-sigma confidence intervals of mm differences ±3.4 mm ±1.6 mm ±0.94 mm Mean absolute difference 1.39 mm 0.49 mm 0.29 mm Median absolute difference 1.08 mm 0.20 mm 0.14 mm
aRDM, automatic RECIST diameter; EDM, effective diameter; SDM, manual study diameter.
Get Radiology Tree app to read full this article<
Get Radiology Tree app to read full this article<
Get Radiology Tree app to read full this article<
Get Radiology Tree app to read full this article<
Get Radiology Tree app to read full this article<
Analysis of Change Measurements
Get Radiology Tree app to read full this article<
Get Radiology Tree app to read full this article<
Get Radiology Tree app to read full this article<
Table 2
Statistics of Change Measurement Variability: Correlation and Percentiles of Changes Measured as Relative Changes and Absolute Changes in Milimeter (= Differences of Diameters)
N = 55 Pairs of Change Types SDM aRDM EDM Pearson Correlation 63.9% 80.8% 87.6% Mean / median absolute difference of %- changes 13.3% / 11.4%-pts 5.8% / 3.2%-pts 4.1% / 1.8%-pts Mean / median absolute difference in mm 1.42 / 1.15 mm 0.67 / 0.40 mm 0.42 / 0.22 mm 2-sigma confidence intervals of change rate in % ±33.3%-pts ±19.2%-pts ±13.9%-pts 2-sigma confidence intervals of change in mm ±3.54 mm ±2.05 mm ±1.22 mm 5% & 95% percentiles of difference in % [−24.3%, 30.6%] [−15.6%, 12.6%] [−7.7%, 12.7%] 5% & 95% percentiles of difference in mm-change [−2.8, 2.9 mm] [−1.7, 2.3 mm] [−0.7, 1.3 mm]
aRDM, automatic RECIST diameter; EDM, effective diameter; SDM, manual study diameter.
Standard deviation, %5 and 95% percentiles based on signed differences between readers, as well as means and medians of the absolute values of those differences are computed.
Get Radiology Tree app to read full this article<
Get Radiology Tree app to read full this article<
Get Radiology Tree app to read full this article<
Get Radiology Tree app to read full this article<
Get Radiology Tree app to read full this article<
Discussion
Get Radiology Tree app to read full this article<
Get Radiology Tree app to read full this article<
Get Radiology Tree app to read full this article<
Get Radiology Tree app to read full this article<
Get Radiology Tree app to read full this article<
Get Radiology Tree app to read full this article<
Get Radiology Tree app to read full this article<
Get Radiology Tree app to read full this article<
Get Radiology Tree app to read full this article<
Get Radiology Tree app to read full this article<
Get Radiology Tree app to read full this article<
Acknowledgments
Get Radiology Tree app to read full this article<
Get Radiology Tree app to read full this article<
References
1. Eisenhauer E.A., Therasse P., Bogaerts J., et. al.: New response evaluation criteria in solid tumours: revised RECIST guideline (version 1.1). Eur J Cancer 2009; 45: pp. 228-247.
2. Erasmus J.J., Gladish G.W., Broemeling L., et. al.: Interobserver and intraobserver variability in measurement of non-small-cell carcinoma lung lesions: implications for assessment of tumor response. J Clin Oncol 2003; 21: pp. 2574-2582.
3. Bornemann L., Kuhnigk J.-M., Dicken V., et. al.: New tools for computer assistance in thoracic CT part 2. Therapy monitoring of pulmonary metastases. RadioGraphics 2005; 25: pp. 841-848.
4. Escudier B., Eisen T., Stadler W.M., et. al.: Sorafenib for treatment of renal cell carcinoma: final efficacy and safety results of the phase iii treatment approaches in renal cancer global evaluation trial. J Clin Oncol 2009; 27: pp. 3312-3318.
5. Kuhnigk J.-M., Dicken V., Bornemann L., et. al.: Morphological segmentation and partial volume analysis for volumetry of solid pulmonary lesions in thoracic CT scans. IEEE Trans Med Imaging 2006; 25: pp. 417-434.
6. Heckel F., Moltz J.H., Tietjen C., et. al.: Sketch-based editing tools for tumour segmentation in 3D medical images. Computer Graphics Forum 2013; 32: pp. 144-157.
7. Keil S., Behrendt F., Stanzel S., et. al.: Semi-automated measurement of hyperdense, hypodense and heterogeneous hepatic metastasis on standard MDCT slice. Eur Radiol 2008; 18: pp. 2456-2465.
8. Galizia M., Töre H., Chalian H., et. al.: Evaluation of hepatocellular carcinoma size using two-dimensional and volumetric analysis. Acad Radiol 2011; 14: pp. 1555-1560.
9. Marten K., Auer F., Schmidt S., et. al.: Automated CT volumetry of pulmonary metastases: the effect of a reduced growth threshold and target lesion number on the reliability of therapy response assessment using RECIST criteria. Eur Radiol 2007; 17: pp. 2561-2571.
10. Vogel M., Schmücker S., Maksimovic O., et. al.: Reduction in growth threshold for pulmonary metastases: an opportunity for volumetry and its impact on treatment decisions. Br J Radiol 2012; 85: pp. 959-964.
11. Buerke B., Puesken M., Beyer F., et. al.: Semiautomatic lymph node segmentation in multislice computed tomography: impact of slice thickness on segmentation quality, measurement precision, and interobserver variability. Inv Radiol 2010; 45: pp. 82-88.
12. de Hoop B., Gietema H., van Ginneken B., et. al.: A comparison of six software packages for evaluation of solid lung nodules using semi-automated volumetry: what is the minimum increase in size to detect growth in repeated CT examinations. Eur Radiol 2009; 42: pp. 800-808.
13. Heckel F., Meine H., Moltz J.H., et. al.: Segmentation-based partial volume correction for volume estimation of solid lesions in CT. IEEE Trans Med Imaging 2014; 33: pp. 462-480.
14. Moltz J., Bornemann L., Kuhnigk J., et. al.: Advanced segmentation techniques for lung nodules, liver metastases, and enlarged lymph nodes in CTscans. IEEE J Sel Top Signal Process 2009; 3: pp. 122-134.
15. Bauknecht H., Romano V., Rogalla P., et. al.: Intra- and interobserver variability of linear and volumetric measurements of brain metastases using contrast-enhanced magnetic resonance imaging. Inv Radiol 2010; 45: pp. 49-56.