
Rationale and Objective
The purpose of this study is to determine whether computational fluid dynamics modeling can correctly predict the location of the major intra-aneurysmal flow structures that can be identified by conventional angiography.
Materials and Methods
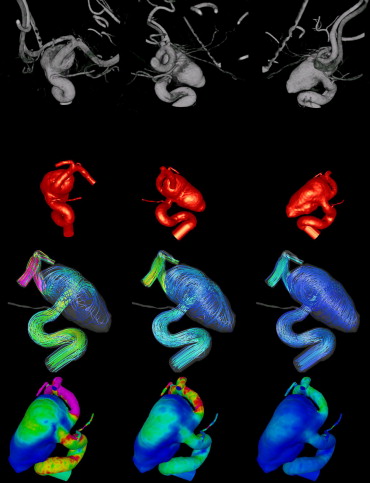
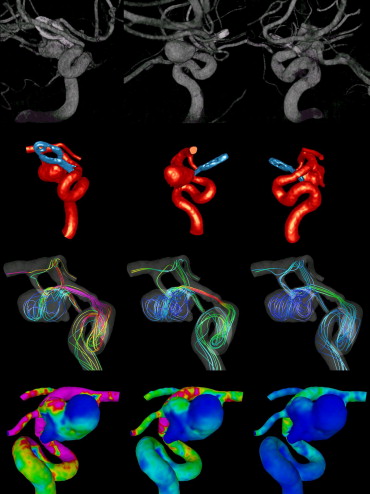
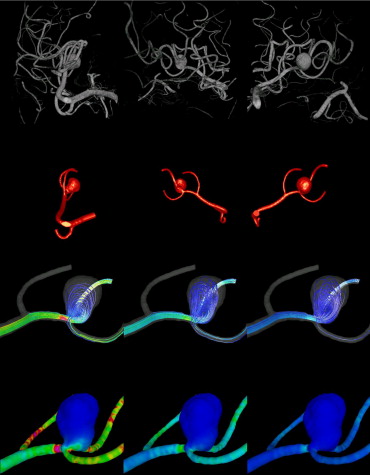
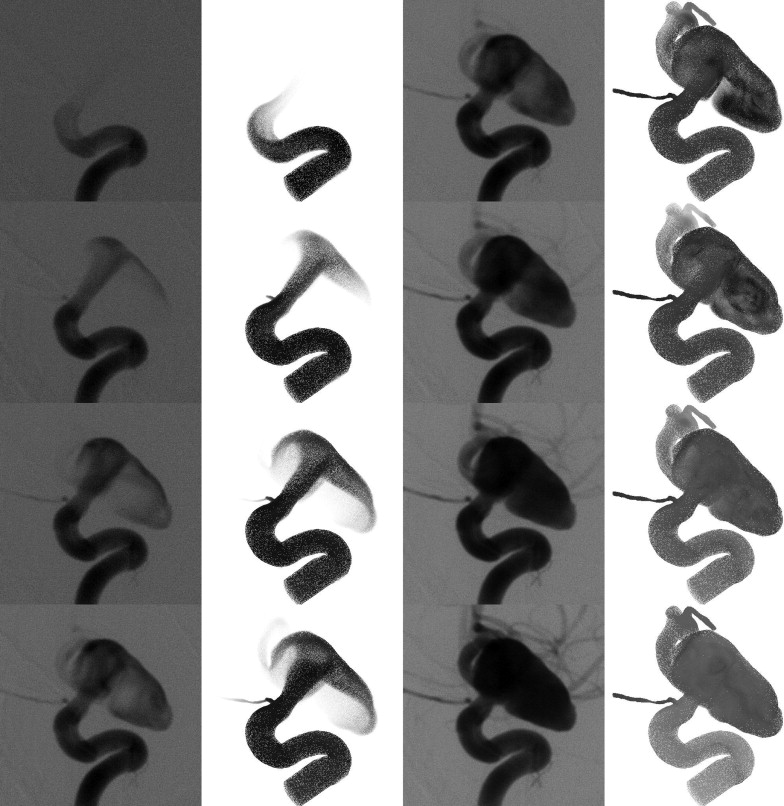
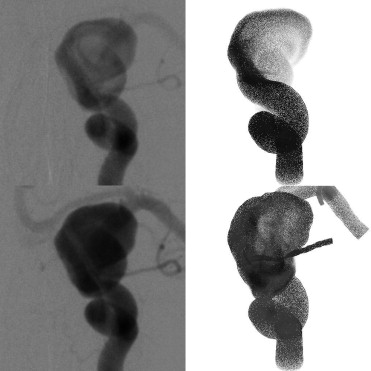
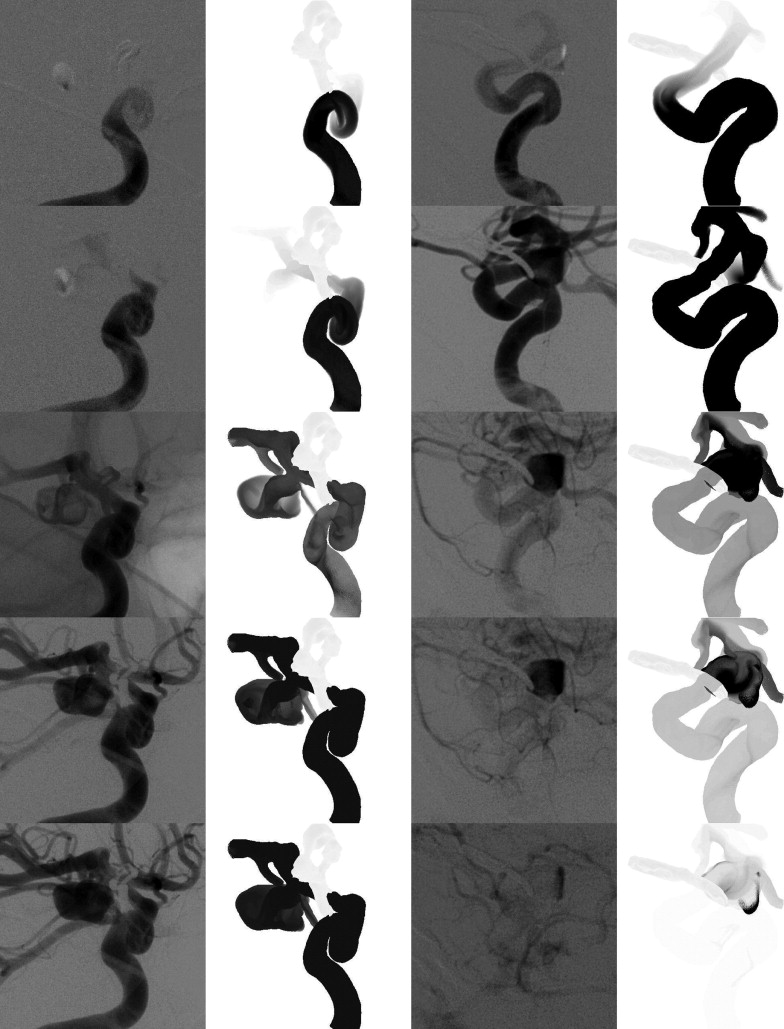
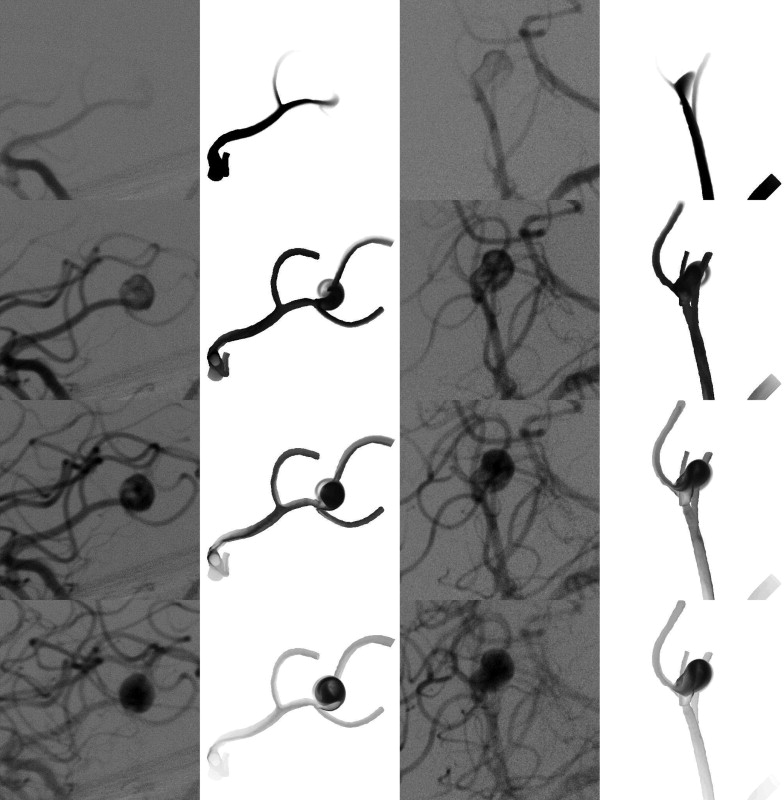
Patient-specific models of three cerebral aneurysms were constructed from three-dimensional rotational angiography images and computational fluid dynamic simulations performed. Using these velocity fields, contrast transport was simulated and visualizations constructed to provide a “virtual” angiogram. These models were then compared to images from high frame rate conventional angiography to compare flow structures.
Results
Computational fluid dynamics simulations showed three distinct flow types ranging from simple to complex. Virtual angiographic images showed good agreement with images from conventional angiography for all three aneurysms with analogous size and orientation of the inflow jet, regions of impaction, and flow type. Large intra-aneurysmal vortices and regions of outflow also corresponded between the images.
Conclusions
Patient-specific image-based computational models of cerebral aneurysms can realistically reproduce the major intra-aneurysmal flow structures observed with conventional angiography. The agreement between computational models and angiographic structures is less for slower zones of recirculation later in the cardiac cycle.
Cerebral aneurysms are widely believed to form and grow on the basis of hemodynamic interactions with the wall biology. Researchers have used a variety of tools to study these complex biological phenomena including animal, in vitro models, and computational models ( ). The goal of these experiments has been to approximate the in vivo environment so that theories can be developed and further tested in more realistic systems. Ultimately, a link between the research and the clinical outcomes (i.e., aneurysmal growth and rupture) is necessary to reach an understanding of the relative importance of the forces or mechanisms that are discovered. Previously used methods fall short of this goal because they cannot reproduce the in vivo state of a particular patient. Until recently, computational studies have been only performed on idealized aneurysm geometries or approximations of a specific patient geometry. As computational techniques have improved, more refined models have been constructed, leading to a transition from idealized geometries to “realistic” models based on typical patient anatomies. Most recently, studies have tried to replicate the exact anatomy of specific patients to connect specific hemodynamic factors to clinical events, allowing statistical analysis in a patient population ( ). Despite these more sophisticated methods, one question still remains: Are these models accurately reproducing what is occurring in a specific patient?
Without accurate in vivo measurements for comparison, a complete validation of computational methods is not possible. But, there is growing evidence that computational methods are reliably reproducing the in vivo intravascular environment. Comparisons with a variety of simplified experimental biological systems have shown good correlation with computational models ( ). In addition to this direct validation, sensitivity analysis has been performed to obtain an understanding of the influence of a variable within a physiologic range are on the results of a specific model ( ). These analyses have been done to test a variety of assumptions used in modeling including flow rates, flow asymmetries, inflow boundary conditions, Newtonian properties of fluids, reconstruction/grid generation techniques, and small branch segmentation ( ). Even without knowing the exact value of the input variable, this analysis can measure the influence of changes (or errors) in the variable would have on the results of a simulation. Previous work has shown that inaccuracies in geometry have the largest potential for adversely influencing intra-aneurysmal hemodynamics ( ). Other variables appear to have only minor effects on the models and are considered higher order variables.
Get Radiology Tree app to read full this article<
Methods
Patients and Images
Get Radiology Tree app to read full this article<
Table 1
Cases selected for study
Patient Location Size (mm) Rupture Flow type 1 LICA 25 Yes IV 2 LICA 11 No III 3 RMCA 5 Yes I
Get Radiology Tree app to read full this article<
Vascular Models
Get Radiology Tree app to read full this article<
Get Radiology Tree app to read full this article<
Blood Flow Models
Get Radiology Tree app to read full this article<
Contrast Transport Models
Get Radiology Tree app to read full this article<
Postprocessing and Visualization
Get Radiology Tree app to read full this article<
Get Radiology Tree app to read full this article<
Results
Patient 1
Get Radiology Tree app to read full this article<
Get Radiology Tree app to read full this article<
Get Radiology Tree app to read full this article<
Patient 2
Get Radiology Tree app to read full this article<
Get Radiology Tree app to read full this article<
Get Radiology Tree app to read full this article<
Patient 3
Get Radiology Tree app to read full this article<
Get Radiology Tree app to read full this article<
Get Radiology Tree app to read full this article<
Discussion
Get Radiology Tree app to read full this article<
Get Radiology Tree app to read full this article<
Get Radiology Tree app to read full this article<
Get Radiology Tree app to read full this article<
Get Radiology Tree app to read full this article<
Get Radiology Tree app to read full this article<
Get Radiology Tree app to read full this article<
Get Radiology Tree app to read full this article<
Conclusions
Get Radiology Tree app to read full this article<
Get Radiology Tree app to read full this article<
References
1. Nakatani H., Hashimoto N., Kang S.: Cerebral blood flow patterns at major vessel bifurcations and aneurysms in rats. J Neurosurg 1991; 74: pp. 258-262.
2. Gonzalez C.F., Choi Y.I., Ortega V.: Intracranial aneurysms: Flow analysis of their origin and progression. AJNR Am J Neuroradiol 1992; 13: pp. 181-188.
3. Gobin Y.P., Counard J.L., Flaud P.: In vitro study of haemodynamics in a giant saccular aneurysm model: Influence of flow dynamics in the parent vessel and effects of coil embolization. Neuroradiology 1994; 36: pp. 530-536.
4. Burleson A.C., Strother C.M., Turitto V.T.: Computer modeling of intracranial saccular and lateral aneurysms for the study of their hemodynamics. Neurosurgery 1995; 37: pp. 774-784.
5. Tenjin H., Asakura F., Nakahara Y.: Evaluation of intraaneurysmal blood velocity by time-density curve analysis and digital subtraction angiography. AJNR Am J Neuroradiol 1998; 19: pp. 1303-1307.
6. Ujiie H., Tachibana H., Hiramtsu O.: Effects of size and shape (aspect ratio) on the hemodynamics of saccular aneurysms: A possible index for the surgical treatment of intracranial aneurysms. Neurosurgery 1999; 45: pp. 119-130.
7. Tateshima S., Murayama Y., Villablanca J.: Intraaneurysmal flow dynamics study featuring an acrylic aneurysm model manufactured using computerized tomography angiogram as a mold. J Neurosurg 2001; 95: pp. 1020-1027.
8. Satoh T., Onoda K., Tsuchimoto S.: Visualization of intraaneurysmal flow patterns with transluminal flow images of 3D MR angiograms in conjunction with aneurysmal configurations. AJNR Am J Neuroradiol 2003; 24: pp. 1436-1445.
9. Cebral J.R., Castro M.A., Burgess J.E., et. al.: Characterization of cerebral aneurysm for assessing risk of rupture using patient-specific computational hemodynamics models. AJNR Am J Neuroradiol 2005; 26: pp. 2550-2559.
10. Cebral J.R., Castro M.A., Millan D., et. al.: 2005.SPIE Medical Imaging ConferenceSan Diego February 12−17
11. Cebral J.R., Yim P.J., Löhner R., et. al.: Blood flow modeling in carotid arteries using computational fluid dynamics and magnetic resonance imaging. Acad Radiol 2002; 9: pp. 1286-1299.
12. Yim P.J., Cebral J.R., Weaver A., et. al.: Estimation of the differential pressure at renal artery stenoses. Magn Reson Med 2004; 51: pp. 969-977.
13. Lieber B.B., Livescu V., Hopkins L.N., et. al.: Particle image velocimetry assessment of stent design influence on intra-aneurysmal flow. Ann Biomed Eng 2002; 30: pp. 768-777.
14. Ionita C.N., Hoi Y., Meng H., Rudin S.: 2004.SPIE Medical Imaging ConferenceSan Diego February 14−19
15. Moore J.A., Steinman D.A., Holdworth D.W., et. al.: Accuracy of computational hemodynamics in complex arterial geometries reconstructed from magnetic resonance imaging. Ann Biomed Eng 1999; 27: pp. 32-41.
16. Taylor C.A., Draney M.T.: Experimental and computational methods in cardiovascular fluid mechanics. Annu Rev Fluid Mechan 2004; 36: pp. 197-231.
17. Cebral J.R., Castro M.A., Appanaboyina S., et. al.: Efficient pipeline for image-based patient-specific analysis of cerebral aneurysm hemodynamics: Technique and sensitivity. IEEE Trans Med Imaging 2005; 24: pp. 457-467.
18. Venugopal P., Chen H., Duckwiler G., et. al.: 2005.SPIE Medical Imaging ConferenceSan Diego February 12−17
19. Oshima M., Sakai H., Torii R.: Modeling of inflow boundary conditions for image-base simulation of cerebrovascular flow. Int J Numerical Methods Fluids 2005; 47: pp. 603-617.
20. Sato O., Kamitani H.: Giant aneurysm of the middle cerebral artery: Angiographic analysis of blood flow. Surg Neurol 1975; 4: pp. 27-31.
21. Lanzieri C.F., Tarr R.W., Selman W.R., et. al.: Use of the delayed mask for improved demonstration of aneurysms on intraarterial DSA. AJNR Am J Neuroradiol 1992; 13: pp. 1589-1593.
22. Castro M.A., Putman C.P., Cebral J.R.: Computational modeling of cerebral aneurysms in arterial networks reconstructed from multiple 3D rotational angiography images. SPIE Med Imaging 2005; 5746: pp. 233-244.
23. Castro M.A., Putman C.M., Cebral J.R.: Patient-specific computational modeling of cerebral aneurysms with multiple avenues of flow from 3D rotational angiography images. Acad Radiol 2006; 13: pp. 811-821.
24. Yim P.J., Vasbinder B., Ho V.H., et. al.: A deformable isosurface and vascular applications. SPIE Med Imaging 2002; 4684: pp. 1390-1397.
25. Löhner R.: Automatic unstructured grid generators. Finite Elements Anal Design 1997; 25: pp. 111-134.
26. Löhner R.: Extensions and improvements of the advancing front grid generation technique. Comput Methods Appl Mechanics Eng 1996; 5: pp. 119-132.
27. Löhner R.: Regridding surface triangulations. J Comput Phys 1996; 126: pp. 1-10.
28. Mazumdar J.: 1992.World ScientificSingapore
29. Womersley J.R.: Method for the calculation of velocity, rate of flow and viscous drag in arteries when the pressure gradient is known. J Physiol 1955; 127: pp. 553-563.
30. Taylor C.A., Hughes T.J.R., Zarins C.K.: Finite element modeling of blood flow in arteries. Comput Methods Appl Mechanics Eng 1998; 158: pp. 155-196.
31. Cebral J.R., Castro M.A., Soto O., et. al.: Blood flow models of the circle of Willis from magnetic resonance data. J Eng Math 2003; 47: pp. 369-386.
32. Calamante F., Yim P.J., Cebral J.R.: Estimation of bolus dispersion effects in perfusion MRI using image-based computational fluid dynamics. NeuroImage 2003; 19: pp. 342-352.
33. Ford M.D., Stuhne G.R., Nikolov H.N., et. al.: Virtual angiography for visualization and validation of computational models of aneurysm hemodynamics. IEEE Trans Med Imaging 2005; 24: pp. 1586-1592.
34. Wang Z.J., Hoffmann K.R., Wang Z., et. al.: Contrast setting in cerebral aneurysm angiography. Phys Med Biol 2005; 50: pp. 3171-3181.