
Rationale and Objectives
To analyze airway dimensions throughout the bronchial tree in severe asthmatic patients using multidetector row computed tomography (MDCT) focusing on airway narrowing.
Materials and Methods
Thirty-two patients with severe asthma underwent automated (BronCare software) analysis of their right lung bronchi, with counts of airways >3 mm long arising from the main bronchi (airway count) and bronchial dimension quantification at segmental and subsegmental levels (lumen area [LA], wall area [WA], and WA%). Focal bronchial stenosis was defined as >50% narrowing of maximal LA on contiguous cross-sectional slices. Severe asthmatics were compared to 13 nonsevere asthmatic patients and nonasthmatic (pooled) subjects (Wilcoxon rank tests, then stepwise logistic regression). Finally, cluster analysis of severe asthmatic patients and stepwise logistic regression identified specific imaging subgroups.
Results
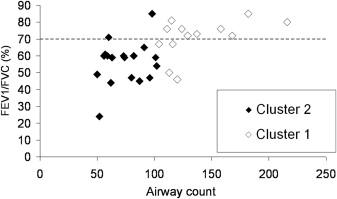
The most significant differences between severe asthmatic patients and the pooled subjects were bronchial stenosis (subsegmental and all bronchi: P < .002) and WA% ( P < .0003). Stepwise logistic regression retained WA% as the only explanatory covariable ( P = .002). Two identified clusters of severe asthmatic patients differed for parameters characterizing airway narrowing (airway count: P = .0002; focal bronchial stenosis: P = .009). Airway count was as discriminant as forced expiratory volume in 1 second/forced vital capacity ( P = .01) to identify patients in each cluster, with both variables being correlated ( r = 0.59, P = .005).
Conclusions
Severe asthma–associated morphologic changes were characterized by focal bronchial stenoses and diffuse airway narrowing; the latter was associated with airflow obstruction. WA%, dependent on airway caliber, is the best parameter to identify severe asthmatic patients from pooled subjects.
Asthma is a heterogeneous condition, which may be characterized in terms of clinical, functional, and biological phenotypes . Approximately, 5%–10% of asthmatic patients have severe disease , associated with airway inflammation that induces structural changes over time. These changes are known as airway wall remodeling and include subepithelial fibrosis, enlarged mucous glands, smooth muscle hypertrophy and hyperplasia . Remodeling in severe asthma has functional consequences, with decreased forced expiratory volume in 1 second (FEV 1 ) and persistently increased bronchial hyper-responsiveness . However, whether functional alterations are associated with three-dimensional (3D) in vivo bronchial geometry modifications due to airway narrowing remains to be demonstrated.
Bronchial remodeling can be assessed quantitatively on bronchial biopsy specimens but histologic examination does not provide information on its variability throughout the bronchial tree . Moreover, data on bronchial tree geometry are sparse, mainly based on examination of rubber casts of airways . Nowadays, the morphologic consequences of remodeling in severe asthma need to be better understood as it would contribute to choosing the best adapted among new emerging treatments .
Get Radiology Tree app to read full this article<
Get Radiology Tree app to read full this article<
Materials and methods
Patients
Get Radiology Tree app to read full this article<
Table 1
Comparisons of Clinical and Functional Parameters Between Severe Asthmatic Patients and the Pooled Group
Clinical Parameter Severe Asthma ( n = 32) Pooled Group ( n = 13)P Nonsevere Asthma ( n = 7) Nonasthmatic Subjects ( n = 6) Age (years) 48.6 (41–58) 42.7 (32–54) .24 46.8 (32–58) 38 (26–52) Weight (kg) 76.6 (66.5–87) 70.7 (64–77) .27 72.5 (57–93) 68.5 (65–77) Size (m) 1.67 (1.62–1.71) 1.67 (1.69–1.72) .3 1.66 (1.63–1.71) 1.72 (1.68–1.75) Sex (female/male) 21/11 8/5 1 5/2 3/3 Smoker (yes/no) 7/25 2/5 .6 2/5 — Asthma history ∗ Duration (years) 21.9 (9–33.5) 33.8 (18–50) .08 33.8 (18–50) — Atopy (yes/no) 16/15 6/1 .2 6/1 — Oral maintenance steroid therapy (yes/no) 10/21 0/7 .15 0/7 — PFT ∗ FEV 1 (% predicted) 71.8 (58–86) 80.5 (65–97) .36 80.5 (65–97) — FEV 1 /FVC (%) 62.2 (50–73) 71.2 (60–81) .1 71.2 (60–81) — Reversibility (yes/no) 10/21 4/3 .38 4/3 —
FEV 1 , forced expiratory volume in 1 second; FVC, forced vital capacity; PFT, pulmonary function tests.
Data are expressed as means (upper to lower quartile).
Get Radiology Tree app to read full this article<
Get Radiology Tree app to read full this article<
MDCT Acquisitions
Get Radiology Tree app to read full this article<
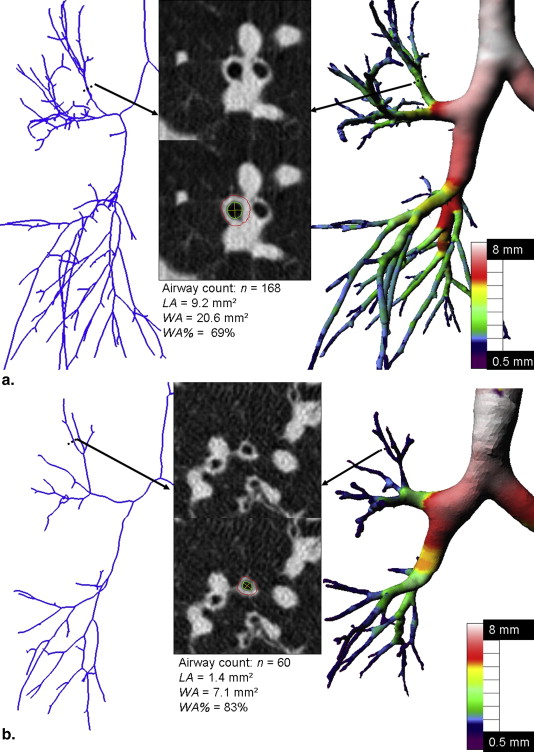
Airway Computations
Get Radiology Tree app to read full this article<
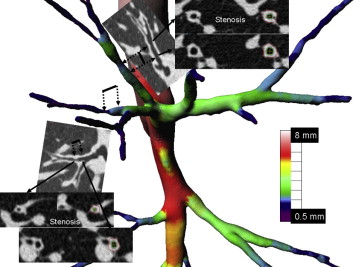
Get Radiology Tree app to read full this article<
Bronchus Analysis
Get Radiology Tree app to read full this article<
Get Radiology Tree app to read full this article<
Statistical Analysis
Get Radiology Tree app to read full this article<
Table 2
Comparisons of MDCT Parameters Between Patients with Severe Asthma and Pooled Subjects
MDCT Parameter Severe Asthma ( n = 32) Pooled Group ( n = 13)P Nonsevere Asthma ( n = 7) Nonasthmatic Subjects ( n = 6) Airway count, n 99 (62–118) 153 (100–196) .01 137.1 (86–193) 181.2 (140–222) Stenosis, n Subsegmental bronchi 3.1 (1–5) 0.9 (0–1) .002 1.4 (0–3) 0.3 (0–1) Segmental bronchi 0.8 (0–1) 0.1 (0–0) .6 0.3 (0–1) 0 (0–0) All bronchi 3.9 (2–6) 1 (0–2) .002 1.7 (0–3) 0.3 (0–1) LA (mm²) Subsegmental bronchi 7.7 (4.8–9.1) 10.8 (8.3–11.1) .01 10.3 (9–11.1) 11.2 (8.1–14.9) Segmental bronchi 14.4 (10.4–19.1) 18.9 (15.1–22.2) .02 18.7 (15.3–22.9) 19.1 (14.6–22.4) All bronchi 9.8 (6.8–11.7) 13.3 (10.5–14.7) .01 13 (12.2–14.7) 13.6 (10.4–17.2) WA (mm²) Subsegmental bronchi 14.7 (12.8–16.8) 13 (11.6–13.7) .049 12.9 (12.5–13.7) 13.1 (11.1–15.4) Segmental bronchi 25 (21.3–27.9) 21.7 (19–24) .6 22.2 (19–24) 21.1 (14.8–24.1) All bronchi 17.6 (15.3–19.6) 15 .5 (10.5–14.7) .04 15.6 (14.9–16.1) 15.4 (13.4–18.5) WA% Subsegmental bronchi 68.2 (61.8–74.2) 56.5 (52.3–59.8) .0004 57 (51.9–61.4) 56 (52.3–59.2) Segmental bronchi 65.4 (59.3–70.5) 54.7 (49.5–59) .0008 55.5 (48.8–60) 53.7 (49.3–57.3) All bronchi 67.4 (61.4–73) 56 (52.6–59.6) .0003 56.5 (50.9–60.7) 55.4 (52.6–59.6)
LA, lumen area; WA, wall area; WA%, WA expressed as a percentage of total bronchial areas (LA + WA).
Data are expressed as means (upper to lower quartile).
Get Radiology Tree app to read full this article<
Results
Identification of Severe Asthmatic Patients
Get Radiology Tree app to read full this article<
Table 3
Stenoses of the Segmental and Subsegmental Bronchi Included in the Right Upper Lobe (B1, B2, and B3) and Anterior, Lateral, and Posterior Segments of the Right Lower Lobe (B8, B9, and B10) .
Bronchus Segmental Level Subsegmental Level Severe Asthma ( n = 32) Nonsevere Asthma ( n = 7) Nonasthmatic Subjects ( n = 6) Severe Asthma ( n = 32) Nonsevere Asthma ( n = 7) Nonasthmatic Subjects ( n = 6) B1 5 1 a: 4; b: 7 a: 1; b: 2 B2 2 1 a: 10; b: 4 a: 2 B3 5 a: 7; b: 10 a: 1; b: 1 B8 3 a: 8; b: 6 B9 9 1 a: 7; b: 6 a: 1 a: 1 B10 3 a: 11, b, c: 3; b: 8, c: 8 b: 1 a: 1 Total 27 3 0 99 9 2
Get Radiology Tree app to read full this article<
Get Radiology Tree app to read full this article<
Get Radiology Tree app to read full this article<
Cluster Analysis of Severe Asthmatic Patients
Get Radiology Tree app to read full this article<
Table 4
Comparisons of Clinical and Functional Parameters of the Two Severe Asthma Patient Clusters
Clinical Parameter Severe Asthma Patients ( n = 32)P Cluster 1 ( n = 13) Cluster 2 ( n = 19) Age (years) 48.6 (41–58) 45.2 (32–56) 50.9 (45–60) .26 Weight (kg) 76.6 (66.5–87) 73.5 (63–82) 78.8 (70–87) .18 Size (m) 1.67 (1.62–1.71) 1.69 (1.64–1.70) 1.66 (1.61–1.72) .34 Sex (female/male) 21/11 8/5 13/6 .7 Smoker (yes/no) 7/25 3/10 4/15 1 Asthma history Duration (years) 21.9 (9–33.5) 17.8 (7–33) 24.8 (13–36) .13 Atopy (yes/no) 16/15 7/6 9/9 1 Oral maintenance steroid therapy (yes/no) 10/21 3/10 7/11 .45 PFT FEV 1 (% predicted) 71.8 (58–86) 88 (80–93) 60.1 (52–72) .0002 FEV 1 /FVC (%) 62.2 (50–73) 74.5 (72–80) 53.4 (47–60) .0002 Reversibility (yes/no) 10/21 4/9 6/12 1
PFT, pulmonary function tests; FEV 1 , forced expiratory volume in 1 second; FVC, forced vital capacity.
Data are expressed as means (upper to lower quartile).
Table 5
Comparisons of MDCT Parameter Differences Between the Two Clusters of Severe Asthma Patients
Parameter Severe Asthma Patients ( n = 32)P Cluster 1 ( n = 13) Cluster 2 ( n = 19) Airway count, n 99 (62–118) 135.3 (111–158) 74.2 (57–91) .0002 Stenosis, n Subsegmental bronchi 3.1 (1–5) 1.9 (1–2) 3.9 (2–5) .02 Segmental bronchi 0.8 (0–1) 0.3 (0–1) 1.2 (0–2) .09 All bronchi 3.9 (2–6) 2.2 (1–2) 5.1 (3–6) .009 LA (mm²) Subsegmental bronchi 7.7 (4.8–9.1) 9.2 (7.3–10.4) 6.7 (4.3–8.5) .02 Segmental bronchi 14.4 (10.4–19.1) 16.3 (13–19.6) 13.1 (9.4–15.7) .06 All bronchi 9.8 (6.8–11.7) 11.3 (10.1–12.9) 8.8 (6.2–10.8) .03 WA (mm²) Subsegmental bronchi 14.7 (12.8–16.8) 15.1 (12.8–16.6) 14.6 (12.9–16.9) .96 Segmental bronchi 25 (21.3–27.9) 25.1 (21.4–25.5) 25.1 (21.2–28.3) .6 All bronchi 17.6 (15.3–19.6) 17.6 (10.1–12.9) 17.6 (15.6–20.8) .6 WA% Subsegmental bronchi 68.2 (61.8–74.2) 64 (57.7–70) 71.2 (65.8–77.6) .03 Segmental bronchi 65.4 (59.3–70.5) 61.2 (56.5–65.3) 68.2 (62.6–75.4) .04 All bronchi 67.4 (61.4–73) 63.3 (57.4–68.4) 70.3 (66.2–76.9) .04
LA, lumen area; WA, wall area; WA%, WA expressed as a percentage of total bronchial areas (LA + WA).
Data are expressed as means (upper to lower quartile).
Get Radiology Tree app to read full this article<
Discussion
Get Radiology Tree app to read full this article<
Get Radiology Tree app to read full this article<
Get Radiology Tree app to read full this article<
Get Radiology Tree app to read full this article<
Get Radiology Tree app to read full this article<
Get Radiology Tree app to read full this article<
Get Radiology Tree app to read full this article<
References
1. Wenzel S.: Severe asthma: from characteristics to phenotypes to endotypes. Clin Exp Allergy 2012; 42: pp. 650-658.
2. Chung K.F., Wenzel S.E., Brozek J.L., et. al.: International ERS/ATS guidelines on definition, evaluation and treatment of severe asthma. Eur Respir J 2014; 43: pp. 343-373.
3. Holgate S.T., Polosa R.: The mechanisms, diagnosis, and management of severe asthma in adults. Lancet 2006; 368: pp. 780-793.
4. Bergeron C., Al-Ramli W., Hamid Q.: Remodeling in asthma. Proc Am Thorac Soc 2009; 6: pp. 301-305.
5. Bara I., Ozier A., Tunon de Lara J.M., et. al.: Pathophysiology of bronchial smooth muscle remodelling in asthma. Eur Respir J 2010; 36: pp. 1174-1184.
6. Benayoun L., Druilhe A., Dombret M.C., et. al.: Airway structural alterations selectively associated with severe asthma. Am J Respir Crit Care Med 2003; 167: pp. 1360-1368.
7. Moore W.C., Meyers D.A., Wenzel S.E., et. al.: Identification of asthma phenotypes using cluster analysis in the Severe Asthma Research Program. Am J Respir Crit Care Med 2010; 181: pp. 315-323.
8. Hsia C.C., Hyde D.M., Ochs M., et. al.: An official research policy statement of the American Thoracic Society/European Respiratory Society: standards for quantitative assessment of lung structure. Am J Respir Crit Care Med 2010; 181: pp. 394-418.
9. Boser S.R., Park H., Perry S.F., et. al.: Fractal geometry of airway remodeling in human asthma. Am J Respir Crit Care Med 2005; 172: pp. 817-823.
10. Siddiqui S., Redhu N.S., Ojo O.O., et. al.: Emerging airway smooth muscle targets to treat asthma. Pulm Pharmacol Ther 2013; 26: pp. 132-144.
11. Walker C., Gupta S., Hartley R., et. al.: Computed tomography scans in severe asthma: utility and clinical implications. Curr Opin Pulm Med 2012; 18: pp. 42-47.
12. Szefler S.J., Wenzel S., Brown R., et. al.: Asthma outcomes: biomarkers. J Allergy Clin Immunol 2012; 129: pp. S9-S23.
13. Niimi A., Matsumoto H., Amitani R., et. al.: Airway wall thickness in asthma assessed by computed tomography. Relation to clinical indices. Am J Respir Crit Care Med 2000; 162: pp. 1518-1523.
14. Niimi A., Matsumoto H., Amitani R., et. al.: Effect of short-term treatment with inhaled corticosteroid on airway wall thickening in asthma. Am J Med 2004; 116: pp. 725-731.
15. Aysola R.S., Hoffman E.A., Gierada D., et. al.: Airway remodeling measured by multidetector CT is increased in severe asthma and correlates with pathology. Chest 2008; 134: pp. 1183-1191.
16. Gupta S., Siddiqui S., Haldar P., et. al.: Quantitative analysis of high-resolution computed tomography scans in severe asthma subphenotypes. Thorax 2010; 65: pp. 775-781.
17. Brightling C.E., Gupta S., Gonem S., et. al.: Lung damage and airway remodelling in severe asthma. Clin Exp Allergy 2012; 42: pp. 638-649.
18. Hackx M., Bankier A.A., Gevenois P.A.: Chronic obstructive pulmonary disease: CT quantification of airways disease. Radiology 2012; 265: pp. 34-48.
19. Gupta S., Hartley R., Khan U.T., et. al.: Quantitative computed tomography-derived clusters: redefining airway remodeling in asthmatic patients. J Allergy Clin Immunol 2014; 133: pp. 729-738.
20. Wahidi M.M., Kraft M.: Bronchial thermoplasty for severe asthma. Am J Respir Crit Care Med 2012; 185: pp. 709-714.
21. Bousquet J., Mantzouranis E., Cruz A.A., et. al.: Uniform definition of asthma severity, control, and exacerbations: document presented for the World Health Organization Consultation on Severe Asthma. J Allergy Clin Immunol 2010; 126: pp. 926-938.
22. Lo P., van Ginneken B., Reinhardt J.M., et. al.: Extraction of airways from CT (EXACT’09). IEEE Trans Med Imaging 2012; 31: pp. 2093-2107.
23. Fetita C., Ortner M., Brillet P.Y., et. al.: A morphological-aggregative approach for 3D segmentation of pulmonary airways from generic MSCT acquisitions.Second International Workshop on Pulmonary Image Analysis in conjunction with MICCAI’09.2009.pp. 215-226. United Kingdom
24. Brillet P.Y., Fetita C.I., Beigelman-Aubry C., et. al.: Quantification of bronchial dimensions at MDCT using dedicated software. Eur Radiol 2007; 17: pp. 1483-1489.
25. Fetita C.I., Ortner M., Brillet P.Y., et. al.: Airway shape assessment with visual feed-back in asthma and obstructive diseases.Proceedings of the SPIE: Medical Imaging 2010: Visualization, Image-Guided Procedures, and Modeling.2010.pp. 76251.
26. Hosmer D.W., Lemeshow S.: Applied logistic regression.2000.John Wiley & Sons Inc.Hoboken, NJ
27. Anderberg M.R.: Cluster Analysis for Applications.1973.Academic PressNew York
28. Viegi G., Pedreschi M., Pistelli F., et. al.: Prevalence of airways obstruction in a general population: European Respiratory Society vs American Thoracic Society definition. Chest 2000; 117: pp. 339S-345S.
29. James A.L., Wenzel S.: Clinical relevance of airway remodelling in airway diseases. Eur Respir J 2007; 30: pp. 134-155.
30. Gupta S.S.: Effectiveness and safety of bronchial thermoplasty in the treatment of severe asthma. Am J Respir Crit Care Med 2010; 182: pp. 1565. author reply 1567
31. Matsuoka S., Kurihara Y., Nakajima Y., et. al.: Serial change in airway lumen and wall thickness at thin-section CT in asymptomatic subjects. Radiology 2005; 234: pp. 595-603.
32. de Lange E.E., Altes T.A., Patrie J.T., et. al.: Evaluation of asthma with hyperpolarized helium-3 MRI: correlation with clinical severity and spirometry. Chest 2006; 130: pp. 1055-1062.
33. de Lange E.E., Altes T.A., Patrie J.T., et. al.: Changes in regional airflow obstruction over time in the lungs of patients with asthma: evaluation with 3 He MR imaging. Radiology 2009; 250: pp. 567-575.
34. de Backer J.W., Vos W.G., Vinchurkar S.C., et. al.: Validation of computational fluid dynamics in CT-based airway models with SPECT/CT. Radiology 2010; 257: pp. 854-862.
35. Hoshino M., Matsuoka S., Handa H., et. al.: Correlation between airflow limitation and airway dimensions assessed by multidetector CT in asthma. Respir Med 2010; 104: pp. 794-800.
36. Montaudon M., Lederlin M., Reich S., et. al.: Bronchial measurements in patients with asthma: comparison of quantitative thin-section CT findings with those in healthy subjects and correlation with pathologic findings. Radiology 2009; 253: pp. 844-853.
37. Shimizu K., Hasegawa M., Makita H., et. al.: Airflow limitation and airway dimensions assessed per bronchial generation in older asthmatics. Respir Med 2010; 104: pp. 1809-1816.
38. Brillet P.Y., Attali V., Nachbaur G., et. al.: Multidetector row computed tomography to assess changes in airways linked to asthma control. Respiration 2011; 81: pp. 461-468.
39. Barnes P.J.: Severe asthma: advances in current management and future therapy. J Allergy Clin Immunol 2012; 129: pp. 48-59.
40. Boyden E.: The nomenclature of the bronchopulmonary segments and their blood supply. Dis Chest 1961; 39: pp. 1-6.