
Rationale and Objectives
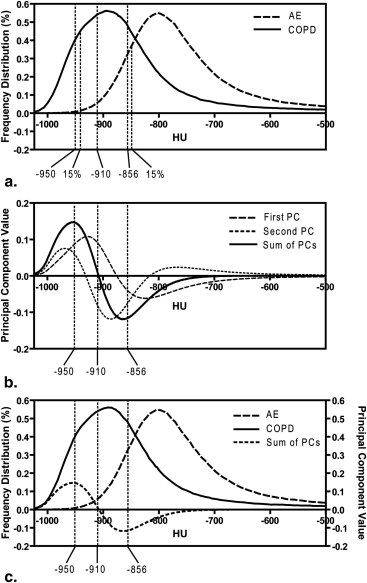
High-resolution computed tomography (CT) measurements of emphysema typically use Hounsfield unit (HU) density histogram thresholds or observer scores based on regions of low x-ray attenuation. Our objective was to develop an automated measurement of emphysema using principal component analysis (PCA) of the CT density histogram.
Materials and Methods
Ninety-seven ex-smokers, including 53 subjects with chronic obstructive pulmonary disease (COPD) and 44 asymptomatic subjects (AEs), provided written informed consent to imaging as well as plethysmography and spirometry. We applied PCA to the CT density histogram to generate whole lung and regional density histogram principal components including the first and second components and the sum of both principal components (density histogram principal component score [D H P C S]). Significant relationships for D H P C S with single HU thresholds, pulmonary function measurements, an expert’s emphysema score, and hyperpolarized 3 He magnetic resonance imaging apparent diffusion coefficients (ADCs) were determined using linear regression and Pearson coefficients. Receiver operator characteristics analysis was performed using forced expiratory volume in 1 second (FEV 1 )/forced vital capacity (FVC) as the independent diagnostic.
Results
There was a significant difference ( P < .0001) between AE and COPD subjects for D H P C S; FEV 1 /FVC; diffusing capacity of lung for carbon monoxide %predicted ; attenuation values below −950, −910, and −856 HU; and 3 He ADCs. There were significant correlations for D H P C S with FEV 1 /FVC ( r = −0.85, P < .0001); diffusing capacity of lung for carbon monoxide %predicted ( r = −0.67, P < .0001); attenuation values below −950/−910/−856 HU ( r = 0.93/0.96/0.76, P < .0001); and 3 He ADCs ( r = 0.85, P < .0001). Receiver operator characteristics analysis showed a 91% classification rate for D H P C S.
Conclusions
We generated an automated emphysema score using PCA of the CT density histogram with a 91% COPD classification rate that showed strong and significant correlations with pulmonary function tests, single HU thresholds, and 3 He magnetic resonance imaging ADCs.
Pulmonary emphysema is defined as a “progressive condition of the lung characterized by abnormal and permanent enlargement of the airspaces distal to the terminal bronchioles, accompanied by the destruction of their walls, and without obvious fibrosis” . Currently, thoracic x-ray computed tomography (CT) is typically used to diagnose and evaluate the presence and extent of emphysema by exploiting the difference in x-ray attenuation of air and the lung parenchyma in Hounsfield units (HU). To facilitate computerized and automated analysis, the CT density histogram of all HU values is evaluated using a number of HU thresholds to generate the relative area (RA) of the lung occupied by attenuation values lower than specific thresholds and percentiles . Although such automated threshold-based measurements correlate well with manual radiologists’ emphysema scores , pulmonary function tests , and both microscopic and macroscopic measurements of emphysema , there is no definitive consensus regarding an optimal HU threshold for emphysema. Other quantification techniques such as low attenuation cluster analysis also use HU thresholds, and the validation of low attenuation cluster analysis with pathologic standards is still not completely understood . Indeed, although single HU threshold–based techniques are the most common methods to generate automated CT measurements of emphysema, lower HU thresholds differentiate more severe emphysematous regions , disregarding regions with mild tissue destruction. Conversely, higher HU thresholds identify mild emphysematous regions but underestimate severe tissue destruction. Another approach involves texture feature analysis that takes into account the spatial or regional relationships between image voxels and their densities; this has been used to characterize emphysema and centrilobular emphysema in combination with centrilobular nodularity from thoracic CT images.
Thoracic CT images acquired in lung cancer screening studies have also been used to study the relationship between emphysema and lung cancer. Lung cancer and emphysema share smoking as a risk factor with lung cancer risk models having identified emphysema as a strong cancer predictor. Thus, thoracic CT acquired in lung cancer screening trials may provide important information relevant to the study of the relationship between emphysema and airways disease with lung cancer . Recently, the direct relationship between emphysema and lung cancer was reported using manual expert radiologists’ scores , but this relationship was not significant when computer-generated single threshold methods were used . Although it is difficult to directly pinpoint the reason for these differences, it is possible that single threshold measurements might not take into account all the factors that a radiologist considers when scoring emphysema in thoracic CT.
Get Radiology Tree app to read full this article<
Materials and methods
Study Subjects
Get Radiology Tree app to read full this article<
Spirometry and Plethysmography
Get Radiology Tree app to read full this article<
Image Acquisition
Get Radiology Tree app to read full this article<
Get Radiology Tree app to read full this article<
Density Histogram Principal Component Score (D H P C S)
Get Radiology Tree app to read full this article<
DHPCS=∑−500i=−1024RAiPCi D
H
P
C
S
=
∑
i
=
−
1024
−
500
R
A
i
P
C
i
where RA is the relative area under the histogram curve for each HU value and PC is PC calculated from PCA analysis. The leave-one-out method was performed and all histograms except one were used as the training data for the calculation of PCs with the excluded histogram used as the test data. Indeed, we excluded a single histogram and PCs were generated using the 96 remaining histograms. The D H P C scores were calculated for the training data-set based on Equation 1 and, therefore, the derived PCs were dependent on the cohort of 96 histograms. This process was repeated for all subject histograms.
Get Radiology Tree app to read full this article<
Get Radiology Tree app to read full this article<
Get Radiology Tree app to read full this article<
CT Density Histogram Threshold Measurements
Get Radiology Tree app to read full this article<
Expert Observer Emphysema Quantification
Get Radiology Tree app to read full this article<
EmpyesemaScore=4×∑ni=1(ESL+ESR)n×8 Empyesema
Score
=
4
×
∑
i
=
1
n
(
E
S
L
+
E
S
R
)
n
×
8
where ES__L and ES__R are the left and right lung emphysema scores in each of n slices, respectively.
Get Radiology Tree app to read full this article<
Statistical Analysis
Get Radiology Tree app to read full this article<
Results
Get Radiology Tree app to read full this article<
Table 1
Subject Demographics and Emphysema Measurements
Asymptomatic Ex-smokers (AE) ( n = 44) COPD ( n = 53) Significance of Difference ( P Value) Age (y [range]) 70 (8) [50–85] 71 (9) [48–87] .825 Males 28 37 Pack-years 26 (19) 48 (31) ∗ <.0001 FEV 1%pred 103 (14) 61 (23) <.0001 FEV 1 /FVC 0.81 (0.06) 0.49 (0.13) <.0001 IC %pred 109 (21) 87 (25) <.0001 RV %pred 101 (26) 154 (41) <.0001 FRC %pred 95 (19) 138 (31) <.0001 TLC %pred 99 (19) 116 (15) <.0001 DL co %pred † 76 (18) 51 (18) <.0001 D H P C S −4.32 (0.75) −0.61 (2.68) <.0001 Emphysema score ‡ 0.08 (0.15) 1.13 (0.79) <.0001 RA 950 (%) 1.45 (1.09) 12.56 (10.26) <.0001 RA 910 (%) 9.80 (6.26) 34.19 (15.37) <.0001 RA 856 (%) 39.00 (14.60) 64.24 (13.47) <.0001 HU 15% −893 (19) 939 (26) <.0001 3 He ADC § 0.27 (0.03) 0.43 (0.12) <.0001
FEV 1 , forced expiratory volume in 1 second; FVC, forced vital capacity; IC, inspiratory capacity; RV, residual volume; FRC, functional residual capacity; TLC, total lung capacity; DL co , diffusing capacity of lung for carbon monoxide; D H P C S, density histogram principal component score; emphysema score, subjective scoring of emphysema by an expert chest radiologist; RA 950 , relative area of the lung with attenuation values below −950 HU; RA 910 , relative area of the lung with attenuation values below −910 HU; RA 856 , relative area of the lung with attenuation values below −856 HU; HU 15 , 15th percentile of the frequency distribution histogram in HU; ADC, apparent diffusion coefficient; %pred, %predicted.
Data are presented as mean (± standard deviation).
Get Radiology Tree app to read full this article<
Get Radiology Tree app to read full this article<
Get Radiology Tree app to read full this article<
Get Radiology Tree app to read full this article<
Get Radiology Tree app to read full this article<
Get Radiology Tree app to read full this article<
Get Radiology Tree app to read full this article<
Get Radiology Tree app to read full this article<
![Figure 3, Whole lung and regional density histogram principal component score (D H P C S) for asymptomatic subjects (AE) and chronic obstructive pulmonary disease (COPD) subjects. (a) Whole lung box-and-whisker plot of D H P C S for AE and COPD subjects showing the 25th to 75th percentile range ( boxes ), ranges ( bars ), and median value ( solid line ). (b) Box-and-whisker plots for D H P C S for superior, medial, and inferior lung regions of interest. (c) Receiver operating characteristic (ROC) curve for D H P C S, expert emphysema score (ES), relative area for values below −950 HU (RA 950 ) (%), and 3 He apparent diffusion coefficient (ADC) as predictors of COPD. The areas under the curve were 0.91 (D H P C S), 0.94 (expert emphysema score), 0.91 [RA 950 (%)], and 0.93 ( 3 He ADC). *Significant difference, P < .01.](https://storage.googleapis.com/dl.dentistrykey.com/clinical/ComputedTomographyDensityHistogramAnalysistoEvaluatePulmonaryEmphysemainExsmokers/2_1s20S1076633212006071.jpg)
Get Radiology Tree app to read full this article<
Get Radiology Tree app to read full this article<
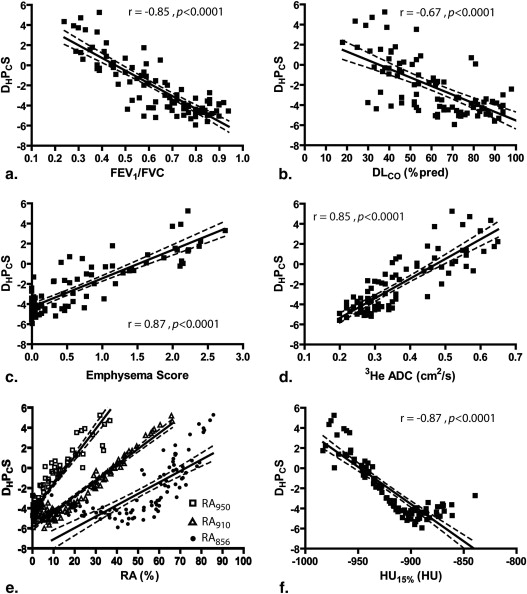
Table 2
Pearson Correlation Coefficients ∗
D H P C S PC 1 PC 2 Emphysema score 0.87 0.69 0.51 RA 950 0.93 0.74 0.63 RA 910 0.96 0.95 0.35 RA 856 0.76 0.98 NS HU 15% −0.87 −0.92 −0.22 3 He ADC 0.85 0.68 0.54 FEV 1 /FVC −0.85 −0.82 −0.33 DL co %pred −0.67 −0.59 −0.34
D H P C S, density histogram principal component score based on the summation of both first and second principal components; PC 1 , D H P C S using the first principal component; PC 2 , D H P C S using the second principal component; RA 950 , relative area of the lung with attenuation values below −950 HU; RA 910 , relative area of the lung with attenuation values below −910 HU; RA 856 , relative area of the lung with attenuation values below −856 HU; HU 15 , 15th percentile of the frequency distribution histogram in HU; ADC, apparent diffusion coefficient; FEV 1 , forced expiratory volume in 1 second; FVC, forced vital capacity; DL co , diffusing capacity of lung for carbon monoxide; NS, not significant; %pred, %predicted.
Get Radiology Tree app to read full this article<
Get Radiology Tree app to read full this article<
Get Radiology Tree app to read full this article<
Table 3
Significant Differences between Pearson Correlation Coefficients for D H P C S and Other Emphysema Measurements
D H P C S PC RA 950 RA 910 RA 856 HU 15% 3 He ADC FEV 1 /FVC DL co %pred Emphysema score 0.31 0.0005 0.27 1 1 1 0.006 RA 950 0.54 0.0001 0.33 0.09 0.09 0.0001 RA 910 <0.0001 0.0006 0.0001 0.0001 0.0001 RA 856 0.29 0.75 0.67 1 HU 15% 1 1 0.006 3 He ADC 1 0.04 FEV 1 /FVC 0.04
D H P C S, density histogram principal component score based on the summation of both first and second principal components; PC 1 RA 950 , relative area of the lung with attenuation values below −950 HU; RA 910 , relative area of the lung with attenuation values below −910 HU; RA 856 , relative area of the lung with attenuation values below −856 HU; HU 15 , 15th percentile of the frequency distribution histogram in HU; ADC, apparent diffusion coefficient; FEV 1 , forced expiratory volume in 1 second; FVC, forced vital capacity; DL co , diffusing capacity of lung for carbon monoxide; NS, not significant; %pred, %predicted.
Pearson correlation coefficients for the relationship between D H P C S and other emphysema measures were compared using Fisher’s z transformation; P values after Holm-Bonferroni correction.
Get Radiology Tree app to read full this article<
Discussion
Get Radiology Tree app to read full this article<
Get Radiology Tree app to read full this article<
Get Radiology Tree app to read full this article<
Get Radiology Tree app to read full this article<
Get Radiology Tree app to read full this article<
Acknowledgments
Get Radiology Tree app to read full this article<
Get Radiology Tree app to read full this article<
References
1. Snider G.L., Kleinerman J., Thurlbeck W.M., et. al.: The definition of emphysema. Report of a National Heart, Lung and Blood Institute, Division of Lung Diseases Workshop. Am Rev Respir Dis 1985; 132: pp. 182-185.
2. Thurlbeck W.M., Muller N.L.: Emphysema: definition, imaging, and quantification. AJR Am J Roentgenol 1994; 163: pp. 1017-1025.
3. Madani A., Zanen J., De Maertelaer V., et. al.: Pulmonary emphysema: objective quantification at multi-detector row CT–comparison with macroscopic and microscopic morphometry. Radiology 2006; 238: pp. 1036-1043.
4. Bankier A.A., De Maertelaer V., Keyzer C., et. al.: Pulmonary emphysema: subjective visual grading versus objective quantification with macroscopic morphometry and thin-section CT densitometry. Radiology 1999; 211: pp. 851-858.
5. Park K.J., Bergin C.J., Clausen J.L.: Quantitation of emphysema with three-dimensional CT densitometry: comparison with two-dimensional analysis, visual emphysema scores, and pulmonary function test results. Radiology 1999; 211: pp. 541-547.
6. Gevenois P.A., De Maertelaer V., De Vuyst P., et. al.: Comparison of computed density and macroscopic morphometry in pulmonary emphysema. Am J Respir Crit Care Med 1995; 152: pp. 653-657.
7. Gevenois P.A., De Vuyst P., De Maertelaer V., et. al.: Comparison of computed density and microscopic morphometry in pulmonary emphysema. Am J Respir Crit Care Med 1996; 154: pp. 187-192.
8. Madani A., Van Muylem A., De Maertelaer V., et. al.: Pulmonary emphysema: size distribution of emphysematous spaces on multidetector CT images–comparison with macroscopic and microscopic morphometry. Radiology 2008; 248: pp. 1036-1041.
9. Yuan R., Nagao T., Pare P.D., et. al.: Quantification of lung surface area using computed tomography. Respir Res 2010; 11: pp. 153.
10. Muller N.L., Staples C.A., Miller R.R., et. al.: “Density mask”. An objective method to quantitate emphysema using computed tomography. Chest 1988; 94: pp. 782-787.
11. Coxson H.O., Rogers R.M., Whittall K.P., et. al.: A quantification of the lung surface area in emphysema using computed tomography. Am J Respir Crit Care Med 1999; 159: pp. 851-856.
12. Park Y.S., Seo J.B., Kim N., et. al.: Texture-based quantification of pulmonary emphysema on high-resolution computed tomography: comparison with density-based quantification and correlation with pulmonary function test. Invest Radiol 2008; 43: pp. 395-402.
13. Prasad M., Sowmya A.: Multi-level classification of emphysema in HRCT lung images using delegated classifiers. Med Image Comput Comput Assist Interv 2008; 11: pp. 59-66.
14. Sorensen L., Shaker S.B., de Bruijne M.: Quantitative analysis of pulmonary emphysema using local binary patterns. IEEE Trans Med Imaging 2010; 29: pp. 559-569.
15. Uppaluri R., Mitsa T., Sonka M., et. al.: Quantification of pulmonary emphysema from lung computed tomography images. Am J Respir Crit Care Med 1997; 156: pp. 248-254.
16. Xu Y., Sonka M., McLennan G., et. al.: MDCT-based 3-D texture classification of emphysema and early smoking related lung pathologies. IEEE Trans Med Imaging 2006; 25: pp. 464-475.
17. Ginsburg S.B., Lynch D.A., Bowler R.P., et. al.: Automated texture-based quantification of centrilobular nodularity and centrilobular emphysema in chest CT images. Acad Radiol 2012; 19: pp. 1241-1251.
18. Swensen S.J., Jett J.R., Hartman T.E., et. al.: CT screening for lung cancer: five-year prospective experience. Radiology 2005; 235: pp. 259-265.
19. Wilson D.O., Weissfeld J.L., Fuhrman C.R., et. al.: The Pittsburgh Lung Screening Study (PLuSS): outcomes within 3 years of a first computed tomography scan. Am J Respir Crit Care Med 2008; 178: pp. 956-961.
20. Spitz M.R., Hong W.K., Amos C.I., et. al.: A risk model for prediction of lung cancer. J Natl Cancer Inst 2007; 99: pp. 715-726.
21. Church T.R.: Chest radiography as the comparison for spiral CT in the National Lung Screening Trial. Acad Radiol 2003; 10: pp. 713-715.
22. Henschke C.I., McCauley D.I., Yankelevitz D.F., et. al.: Early Lung Cancer Action Project: overall design and findings from baseline screening. Lancet 1999; 354: pp. 99-105.
23. Sone S., Takashima S., Li F., et. al.: Mass screening for lung cancer with mobile spiral computed tomography scanner. Lancet 1998; 351: pp. 1242-1245.
24. de Torres J.P., Bastarrika G., Wisnivesky J.P., et. al.: Assessing the relationship between lung cancer risk and emphysema detected on low-dose CT of the chest. Chest 2007; 132: pp. 1932-1938.
25. Kishi K., Gurney J.W., Schroeder D.R., et. al.: The correlation of emphysema or airway obstruction with the risk of lung cancer: a matched case-controlled study. Eur Respir J 2002; 19: pp. 1093-1098.
26. Maldonado F., Bartholmai B.J., Swensen S.J., et. al.: Are airflow obstruction and radiographic evidence of emphysema risk factors for lung cancer? A nested case-control study using quantitative emphysema analysis. Chest 2010; 138: pp. 1295-1302.
27. Smith B.M.: Quantitative computed tomography analysis of emphysema and lung cancer risk. J Thorac Oncol 2011; 6: pp. 1965-1966.
28. Wilson D.O., Weissfeld J.L., Balkan A., et. al.: Association of radiographic emphysema and airflow obstruction with lung cancer. Am J Respir Crit Care Med 2008; 178: pp. 738-744.
29. Wilson D.O., Leader J.K., Fuhrman C.R., et. al.: Quantitative computed tomography analysis, airflow obstruction, and lung cancer in the Pittsburgh Lung Screening Study. J Thorac Oncol 2011; 6: pp. 1200-1205.
30. Kirby M., Mathew L., Wheatley A., et. al.: Chronic obstructive pulmonary disease: longitudinal hyperpolarized (3)He MR imaging. Radiology 2010; 256: pp. 280-289.
31. Mathew L., Evans A., Ouriadov A., et. al.: Hyperpolarized 3He magnetic resonance imaging of chronic obstructive pulmonary disease: reproducibility at 3.0 Tesla. Acad Radiol 2008; 15: pp. 1298-1311.
32. National Heart, Lung, and Blood Institute/World Health Organization : Global strategy for the diagnosis, management, and prevention of chronic obstructive pulmonary disease.Jan 1, 2003.National Heart, Lung, and Blood Institute/World Health OrganizationBethesda, MD/Geneva, Switzerland
33. Redelmeier D.A., Bayoumi A.M., Goldstein R.S., et. al.: Interpreting small differences in functional status: the Six Minute Walk test in chronic lung disease patients. Am J Respir Crit Care Med 1997; 155: pp. 1278-1282.
34. American Thoracic Society : Standardization of spirometry, 1994 update. Am J Respir Crit Care Med 1995; 152: pp. 1107-1136.
35. Parraga G., Ouriadov A., Evans A., et. al.: Hyperpolarized 3He ventilation defects and apparent diffusion coefficients in chronic obstructive pulmonary disease: preliminary results at 3.0 Tesla. Invest Radiol 2007; 42: pp. 384-391.
36. Parraga G., Mathew L., Etemad-Rezai R., et. al.: Hyperpolarized 3He magnetic resonance imaging of ventilation defects in healthy elderly volunteers: initial findings at 3.0 Tesla. Acad Radiol 2008; 15: pp. 776-785.
37. Quinn G.P., Keough M.J.: Principal components and correspondence analysis.2002.Cambridge University PressCambridge, UK 541–572
38. DiStefano C., Zhu M., Mindrila D.: Understanding and using factor scores: considerations for the applied researcher. Pract Assess Res Eval 2009; 14: pp. 1-11.
39. Dirksen A., Dijkman J.H., Madsen F., et. al.: A randomized clinical trial of alpha(1)-antitrypsin augmentation therapy. Am J Respir Crit Care Med 1999; 160: pp. 1468-1472.
40. Van Bell G., Fisher L., Heagerty P., et. al.: Multiple comparisons in biostatistics: a methodology for the health sciences.2nd ed.2004.Wiley-InterscienceSeattle, WA
41. Comrey A.L., Lee H.B.: Confidence intervals for means and tests on correlations.4th Edition2009.LuluMorrisville, NC 103–112
42. Mohamed Hoesein F.A., van Rikxoort E., van Ginneken B., et. al.: Computed tomography-quantified emphysema distribution is associated with lung function decline. Eur Respir J 2012; 40: pp. 844-850.
43. Burgel P.R., Paillasseur J.L., Caillaud D., et. al.: Clinical COPD phenotypes: a novel approach using principal component and cluster analyses. Eur Respir J 2010; 36: pp. 531-539.
44. Anderson A.E., Foraker A.G.: Centrilobular emphysema and panlobular emphysema: two different diseases. Thorax 1973; 28: pp. 547-550.
45. Fain S.B., Panth S.R., Evans M.D., et. al.: Early emphysematous changes in asymptomatic smokers: detection with 3He MR imaging. Radiology 2006; 239: pp. 875-883.
46. Cavigli E., Camiciottoli G., Diciotti S., et. al.: Whole-lung densitometry versus visual assessment of emphysema. Eur Radiol 2009; 19: pp. 1686-1692.
47. Gietema H.A., Muller N.L., Fauerbach P.V., et. al.: Quantifying the extent of emphysema: factors associated with radiologists’ estimations and quantitative indices of emphysema severity using the ECLIPSE cohort. Acad Radiol 2011; 18: pp. 661-671.
48. Regan E.A., Hokanson J.E., Murphy J.R., et. al.: Genetic epidemiology of COPD (COPDGene) study design. COPD 2010; 7: pp. 32-43.
49. Gierada D.S., Bierhals A.J., Choong C.K., et. al.: Effects of CT section thickness and reconstruction kernel on emphysema quantification relationship to the magnitude of the CT emphysema index. Acad Radiol 2010; 17: pp. 146-156.
50. Madani A., De Maertelaer V., Zanen J., et. al.: Pulmonary emphysema: radiation dose and section thickness at multidetector CT quantification–comparison with macroscopic and microscopic morphometry. Radiology 2007; 243: pp. 250-257.
51. Boedeker K.L., McNitt-Gray M.F., Rogers S.R., et. al.: Emphysema: effect of reconstruction algorithm on CT imaging measures. Radiology 2004; 232: pp. 295-301.