
Rationale and Objectives
Lesion conspicuity is typically highly correlated with visual difficulty for lesion detection, and computer-aided detection (CAD) has been widely used as a “second reader” in mammography. Hence, increasing CAD sensitivity in detecting subtle cancers without increasing false-positive rates is important. The aim of this study was to investigate the effect of training database case selection on CAD performance in detecting low-conspicuity breast masses.
Materials and Methods
A full-field digital mammographic image database that included 525 cases depicting malignant masses was randomly partitioned into three subsets. A CAD scheme was applied to detect all initially suspected mass regions and compute region conspicuity. Training samples were iteratively selected from two of the subsets. Four types of training data sets—(1) one including all available true-positive mass regions in the two subsets (“all”), (2) one including 350 randomly selected mass regions (“diverse”), (3) one including 350 high-conspicuity mass regions (“easy”), and (4) one including 350 low-conspicuity mass regions (“difficult”)—were assembled. In each training data set, the same number of randomly selected false-positive regions as the true-positives were also included. Two classifiers, an artificial neural network (ANN) and a k -nearest neighbor (KNN) algorithm, were trained using each of the four training data sets and tested on all suspected regions in the remaining data set. Using a threefold cross-validation method, the performance changes of the CAD schemes trained using one of the four training data sets were computed and compared.
Results
CAD initially detected 1025 true-positive mass regions depicted on 507 cases (97% case-based sensitivity) and 9569 false-positive regions (3.5 per image) in the entire database. Using the all training data set, CAD achieved the highest overall performance on the entire testing database. However, CAD detected the highest number of low-conspicuity masses when the difficult training data set was used for training. Results did agree for both ANN-based and KNN-based classifiers in all tests. Compared to the use of the all training data set, the sensitivity of the schemes trained using the difficult data set decreased by 8.6% and 8.4% for the ANN and KNN algorithm on the entire database, respectively, but the detection of low-conspicuity masses increased by 7.1% and 15.1% for the ANN and KNN algorithm at a false-positive rate of 0.3 per image.
Conclusions
CAD performance depends on the size, diversity, and difficulty level of the training database. To increase CAD sensitivity in detecting subtle cancer, one should increase the fraction of difficult cases in the training database rather than simply increasing the training data set size.
Computer-aided detection (CAD) systems for mammography have been widely used in the clinical practice when interpreting screening breast examinations. CAD systems process digitized or digital mammograms and mark on the images detected suspected regions for masses and microcalcification clusters. The “second reader” approach emphasizes that radiologists should first read and interpret mammograms without CAD, followed by review of CAD results, in particular as related to regions that perhaps were missed and/or underestimated in importance, prior to making a final diagnostic decision. A number of studies have assessed the impact of using CAD on radiologists’ performance, but the results have remained somewhat inconclusive and perhaps even controversial to date . In general, CAD detects more cancers associated with microcalcification clusters than radiologists (ie, 22 vs 15 [2]) but has lower sensitivity in detecting malignant masses than radiologists (ie, 18 vs 26 [2] and 86 vs 105 [5]). Thus, reported cancer detection rates show primarily an increase in the detection of additional microcalcification clusters . When testing the performance of commercial CAD systems on different types of cases, several tendencies were reported, in that CAD performance typically decreases with increases in breast tissue density and decreases in lesion size . As a result, CAD results were found to be relatively highly correlated with radiologists’ visual detection; namely, masses that were missed by radiologists were more likely to be also missed by CAD .
Regardless of the different machine-learning (computerized) classifiers being used, CAD performance depends on specific selection of training and testing data sets. Several studies have used computer-generated (simulated) databases to predict the effect, if any, of database selection on CAD performance and reported a substantially possible bias if CAD was trained with a small data set and/or used a large number of features . Other studies used actual image data to investigate the relationship between CAD performance and database selection. One study investigated the dependence of CAD performance on the “difficulty” of the testing data sets. At a false-positive rate of 1 per image, the sensitivity levels of a preoptimized CAD scheme were 26%, 74%, and 100% on three testing data sets with different difficulty levels . Two studies investigated CAD performance changes as a function of the training data set size when applied to a fixed (independent) testing data set. One reported a performance increase (area under the receiver-operating characteristic curve) from 0.724 to 0.836 as the size of the training data set increased from 50 to 500 , and the other reported that CAD performance increased from 0.715 to 0.874 as the training database size increased from 630 to approximately 2000 and then reached a plateau as training database size increased to 3150 . Other studies also independently trained two CAD schemes, one using masses depicted on “current” examinations on which the masses were detected by radiologists (an “easy” data set) and one using the masses depicted on “prior” examinations on which the masses were missed (or not reported) by the radiologists during the original interpretation but were considered “visible” during a retrospective review (a “difficult” data set). Both studies demonstrated that combining the two schemes improved overall CAD performance .
Get Radiology Tree app to read full this article<
Materials and methods
Image Database
Get Radiology Tree app to read full this article<
Get Radiology Tree app to read full this article<
CAD Scheme
Get Radiology Tree app to read full this article<
Get Radiology Tree app to read full this article<
Get Radiology Tree app to read full this article<
d(yT,xi)=∑14r=1[fr(yT)−fr(xi)]2−−−−−−−−−−−−−−−−−−−√. d
(
y
T
,
x
i
)
=
∑
r
=
1
14
[
f
r
(
y
T
)
−
f
r
(
x
i
)
]
2
.
The smaller the distance, the higher the degree of “similarity” between any two regions being compared. The KNN-generated detection score is computed as follows:
PTP=∑Ni=1wTPi∑Ni=1wTPi+∑Mj=1wFPj, P
TP
=
∑
i
=
1
N
w
i
TP
∑
i
=
1
N
w
i
TP
+
∑
j
=
1
M
w
j
FP
,
where wi=1d(yT,xi)2 w
i
=
1
d
(
y
T
,
x
i
)
2 (a distance weight); wTPi w
i
TP and wFPj w
j
FP are the distance weights for true-positive ( i ) and false-positive ( j ) regions, respectively; N is the number of verified true-positive (TP) mass regions; M is the number of CAD-generated false-positive (FP) regions, and N + M = 15.
Get Radiology Tree app to read full this article<
CAD Performance Assessment
Get Radiology Tree app to read full this article<
Table 1
The Three Data Partitions (Subsets) Generated from the Original Full-Field Digital Mammographic Image Database
Data Subset (Partition) Variable 1 2 3 Number of cases 175 175 175 Number of images 836 836 1060 Number of true-positive mass regions 342 342 341 Number of false-positive regions 2766 2989 3814
Get Radiology Tree app to read full this article<
Get Radiology Tree app to read full this article<
Get Radiology Tree app to read full this article<
Get Radiology Tree app to read full this article<
Results
Get Radiology Tree app to read full this article<
Table 2
Distribution of Normalized Conspicuity Levels for CAD-generated TP and FP Regions
Conspicuity Level Variable Low Moderate High Total Conspicuity ( C ) value 0 ≤ C < 0.33 0.33 ≤ C < 0.67 0.67 ≤ C ≤ 1.0 0 ≤ C ≤ 1.0 Number of TPs 325 (31.7%) 528 (51.5%) 172 (16.8%) 1025 Number of FPs 6734 (70.3%) 2608 (27.3%) 227 (2.4%) 9569
CAD, computer-aided detection; FP, false-positive; TP, true-positive.
Get Radiology Tree app to read full this article<
Get Radiology Tree app to read full this article<
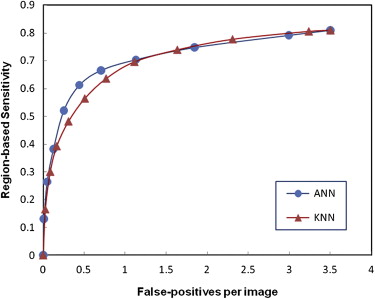
Table 3
Region-based CAD Performance Levels on the Entire Database (Normalized Areas Under FROC Curves and Standard Deviations) for the ANN-based and KNN-based Classifiers That Were Independently Trained by Each of the Four Training Data Sets
Training Dataset All Diverse Easy Difficult CAD using ANN 0.864 ± 0.005 0.814 ± 0.007 0.816 ± 0.007 0.808 ± 0.007 CAD using KNN algorithm 0.854 ± 0.006 0.817 ± 0.007 0.821 ± 0.006 0.821 ± 0.006
ANN, artificial neural network; CAD, computer-aided detection; FROC, free-response receiver-operating characteristic; KNN , k-nearest neighbor.
Data are expressed as mean ± standard deviation.
Get Radiology Tree app to read full this article<
Get Radiology Tree app to read full this article<
Table 4
Number of TP Mass Regions Detected by ANN-based CAD at a False-positive Rate of 0.3 per Image
Conspicuity Level Low Moderate High Total Initially detected TP ROIs 325 528 172 1025 Training data set All 122 (37.5%) 390 (73.9%) 164 (95.3%) 676 (66.0%) Diverse 109 (33.5%) 363 (68.8%) 156 (90.7%) 628 (61.3%) Easy 3 (0.9%) 369 (69.9%) 161 (93.6%) 533 (52.0%) Difficult 145 (44.6%) 330 (62.5%) 113 (65.7%) 588 (57.4%)
ANN, artificial neural network; CAD, computer-aided detection; ROI, region of interest; TP, true-positive.
Get Radiology Tree app to read full this article<
Get Radiology Tree app to read full this article<
Table 5
Number of TP Mass Regions Detected by KNN-based CAD at a False-positive Rate of 0.3 per Image
Conspicuity Level Low Moderate High Total Initially detected TP ROIs 325 528 172 1025 Training data set All 84 (25.8%) 355 (67.2%) 163 (94.7%) 602 (58.7%) Diverse 96 (29.5%) 371 (70.3%) 153 (90.0%) 620 (60.5%) Easy 26 (8.0%) 363 (68.8%) 165 (95.9%) 554 (54.0%) Difficult 133 (40.9%) 315 (59.7%) 68 (39.5%) 516 (50.3%)
CAD, computer-aided detection; KNN, k -nearest neighbor; ROI, region of interest; TP, true-positive.
Get Radiology Tree app to read full this article<
Get Radiology Tree app to read full this article<
![Figure 2, Region-based sensitivity levels in detecting low-conspicuity mass regions at a false-positive of 0.3 per image. The eight computer-aided detection schemes include two classifiers (an artificial neural network [ANN] and a k -nearest neighbor [KNN] algorithm) that were independently trained by each of the four training data sets.](https://storage.googleapis.com/dl.dentistrykey.com/clinical/ComputerAidedDetection/1_1s20S107663321000317X.jpg)
Get Radiology Tree app to read full this article<
Discussion
Get Radiology Tree app to read full this article<
Get Radiology Tree app to read full this article<
Get Radiology Tree app to read full this article<
Get Radiology Tree app to read full this article<
Get Radiology Tree app to read full this article<
Get Radiology Tree app to read full this article<
Get Radiology Tree app to read full this article<
Conclusions
Get Radiology Tree app to read full this article<
Get Radiology Tree app to read full this article<
References
1. Nishikawa R.M., Kallergi M.: Computer-aided detection, in its present form, is not an effective aid for screening mammography. Med Phys 2006; 33: pp. 811-814.
2. Freer T.M., Ulissey M.J.: Screening mammography with computer-aided detection: prospective study of 12,860 patients in a community breast center. Radiology 2001; 220: pp. 781-786.
3. Gur D., Sumkin J.H., Rockette H.E., et. al.: Changes in breast cancer detection and mammography recall rates after the introduction of a computer-aided detection system. J Natl Cancer Inst 2004; 96: pp. 185-190.
4. Khoo L.A., Taylor P., Given-Wilson R.M.: Computer-aided detection in the United Kingdom National Breast Screening Programme: prospective study. Radiology 2005; 237: pp. 444-449.
5. Morton M.J., Whaley D.H., Brandt K.R., et. al.: Screening mammograms: Interpretation with computer-aided detection—prospective evaluation. Radiology 2006; 239: pp. 375-383.
6. Fenton J.J., Taplin S.H., Carney P.A., et. al.: Influence of computer-aided detection on performance of screening mammography. N Engl J Med 2007; 356: pp. 1399-1409.
7. Obenauer S., Sohns C., Werner C., et. al.: Impact of breast density on computer-aided detection in full-field digital mammography. J Digit Imaging 2006; 19: pp. 258-263.
8. Sadaf A, Crystal P, Scaranelo A, et al. Performance of computer-aided detection applied to full-field digital mammography in detection of breast cancers. Eur J Radiol. In press.
9. Gur D., Stalder J.S., Hardesty L.A., et. al.: Computer-aided detection performance in mammographic examination of masses: assessment. Radiology 2004; 223: pp. 418-423.
10. Kupinski M.A., Giger M.L.: Feature selection with limited datasets. Med Phys 1999; 26: pp. 2176-2182.
11. Chan H.P., Sahiner B., Wagner R.F., et. al.: Classifier design for computer-aided diagnosis: effects of finite sample size on the mean performance of classical and neural network classifiers. Med Phys 1999; 26: pp. 2654-2668.
12. Sahiner B., Chan H.P., Hadjiiski L.: Classifier performance prediction for computer-aided diagnosis using a limited dataset. Med Phys 2008; 35: pp. 1559-1570.
13. Nishikawa R.M., Giger M.L., Doi K., et. al.: Effect of case selection on the performance of computer-aided detection schemes. Med Phys 1994; 21: pp. 265-269.
14. Zheng B., Chang Y.H., Good W.F., et. al.: Adequacy testing of training set sample sizes in the development o f a computer-assisted diagnosis scheme. Acad Radiol 1997; 4: pp. 497-502.
15. Park S.C., Sulkthankar R., Mummert L., et. al.: Optimization of reference library used in content-based medical image retrieval scheme. Med Phys 2007; 34: pp. 4331-4339.
16. Zheng B., Good W.F., Armfield D.R., et. al.: Performance change of a mammographic CAD scheme optimized using most recent and prior image database. Acad Radiol 2003; 10: pp. 233-238.
17. Wei J., Chan H.P., Sahiner B., et. al.: Dual system approach to computer-aided detection of breast masses on mammograms. Med Phys 2006; 33: pp. 4157-4168.
18. Kundel H.L., Revesz G.: Lesion conspicuity, structure noise, and film reader error. AJR Am J Roentgenol 1976; 126: pp. 1233-1238.
19. Revesz G., Kundel H.L.: Psychophysical studies of detection errors in chest radiology. Radiology 1977; 123: pp. 559-562.
20. Revesz G., Kundel H.L., Toto L.C.: Densitometric measurements of lung nodules on the chest radiographs. Invest Radiol 1981; 16: pp. 201-205.
21. Zheng B., Chang Y.H., Good W.F., et. al.: Performance gain in computer-assisted detection schemes by averaging scores generated from artificial neural networks with adaptive filtering. Med Phys 2001; 28: pp. 2302-2308.
22. Zheng B., Chang Y.H., Gur D.: Computerized detection of masses in digitized mammograms using single-image segmentation and a multilayer topographic feature analysis. Acad Radiol 1995; 2: pp. 959-966.
23. Mitchell T.M.: Machine Learning.1997.WCB/McGraw-HillBoston
24. Park S.C., Pu J., Zheng B.: Improving performance of computer-aided detection scheme by combining results from two machine learning classifiers. Acad Radiol 2009; 16: pp. 266-274.
25. Zheng B., Lu A., Hardesty L.A., et. al.: A method to improve visual similarity of breast masses for an interactive computer-aided diagnosis environment. Med Phys 2006; 33: pp. 111-117.
26. Yoon H.J., Zheng B., Sahiner S., et. al.: Evaluating computer-aided detection algorithms. Med Phys 2007; 34: pp. 2024-2034.
27. The J.S., Schilling K.J., Hoffmeister J.W., et. al.: Detection of breast cancer with full-field digital mammography and computer-aided detection. AJR Am J Roentgenol 2009; 192: pp. 337-340.
28. Li Q.: Reliable evaluation of performance level for computer-aided diagnostic scheme. Acad Radiol 2007; 14: pp. 985-991.