
Rationale and Objectives
The ability to automatically detect and monitor implanted devices may serve an important role in patient care by aiding the evaluation of device and treatment efficacy. The purpose of this research was to develop a system for the automated detection of one-way endobronchial valves that were implanted for less invasive lung volume reduction.
Materials and Methods
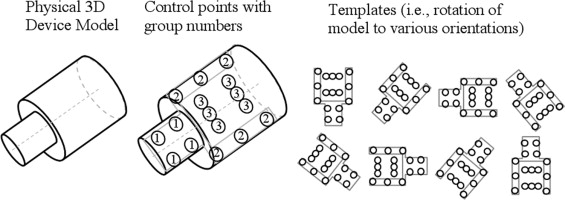
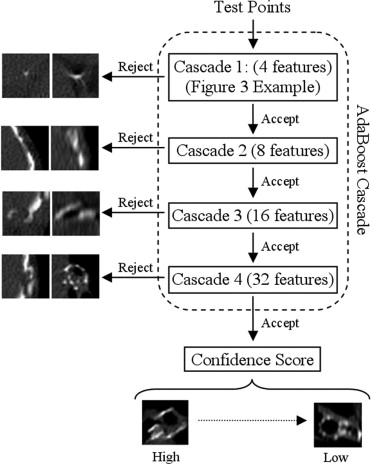
Volumetric thin-section computed tomographic data was obtained for 194 subjects; 95 subjects implanted with 246 devices were used for system development and 99 subjects implanted with 354 devices were reserved for testing. The detection process consisted of preprocessing, pattern recognition based detection, and a final device selection. Following the preprocessing, a set of classifiers was trained using AdaBoost to discriminate true devices from false positives. The classifiers in the cascade used two simple features (either the mean or maximum attenuation) of a local region computed at multiple fixed landmarks relative to a template model of the valve.
Results
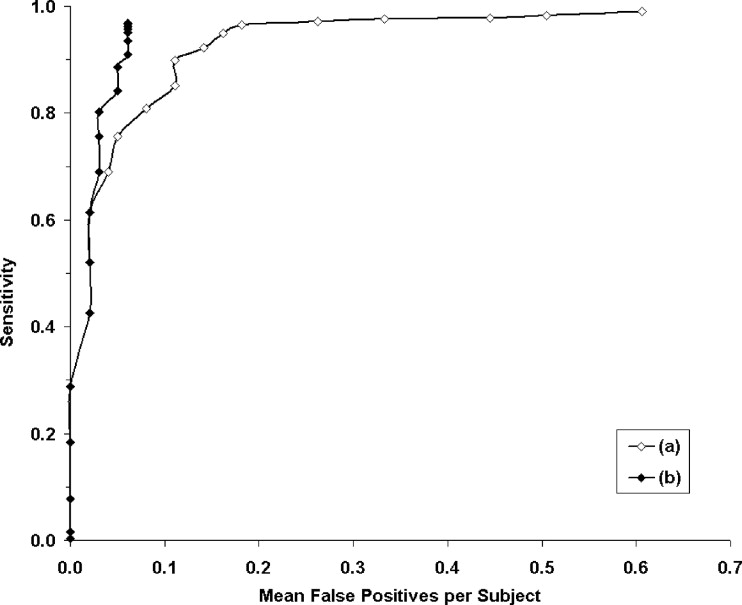
Free-response receiver-operating characteristic analysis was performed for the evaluation; the system could be set so the mean sensitivity was 96.5% with a mean of 0.18 false positives per subject. If knowledge of the number of implanted devices were incorporated, the sensitivity would be 96.9% with a mean of 0.061 false positives per subject; this corresponds to a total of 12 false negatives and six false positives for the 99 subjects in the test dataset.
Conclusion
Software was developed for automated detection of endobronchial valves on volumetric computed tomography. The proposed device modeling and detection techniques may be applicable to other devices as well as useful for evaluation of treatment response.
Initial studies of a one-way endobronchial valve (Emphasys Medical Inc., Redwood City, CA) for less-invasive emphysema treatment have recently been completed with favorable results, although the results from a large multicenter clinical trial are still pending ( ). Previous approaches for emphysema treatment have been palliative therapy or lung volume reduction surgery. The objective of the new endobronchial valve therapy, and other newly emerging alternative therapies, is to place multiple one-way valves into the airways of a targeted, diseased lobe of the lung to prevent entry of air into the lobe, while still allowing air inside the lobe to flow out ( ). By only allowing air out, the treatment aims to reduce the volume of the lobe so that neighboring, healthier lung tissue will expand, providing a treatment benefit to the patient.
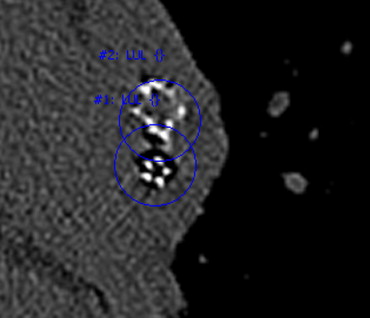
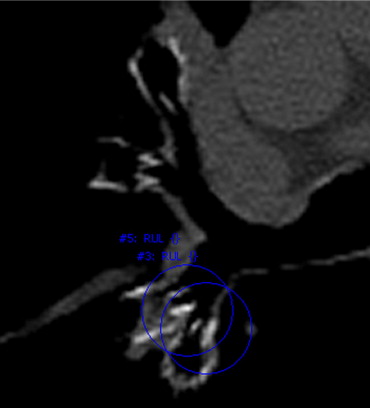
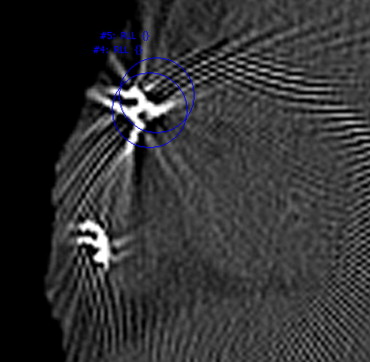
The motivation for this research is to improve the care of patients implanted with medical devices. The ability to detect and monitor implanted devices is important for the evaluation of device and treatment efficacy. Treatment plans may provide guidance to physicians of possible treatment locations; however, either intentionally or unintentionally, physicians may not always place devices in the planned locations. Additionally, once implanted, devices may not always be stable; they can migrate into surrounding lung parenchyma or be coughed out. Figure 1 shows an example of a valve that migrated into the parenchyma, as well as another example of a valve that was placed too distal for complete occlusion of the lobe.
 Open full size image
Figure 1
Computed tomographic image of a valve that migrated into the posterior parenchyma ( top , bone window/level). An image of another valve placed too distal for complete occlusion of all segmental airways of a lobe in also shown ( bottom , lung window/level).
Get Radiology Tree app to read full this article<
Get Radiology Tree app to read full this article<
Get Radiology Tree app to read full this article<
Materials and methods
Device Detection
Get Radiology Tree app to read full this article<
Domain-specific preprocessing
Get Radiology Tree app to read full this article<
Get Radiology Tree app to read full this article<
Get Radiology Tree app to read full this article<
Control points and features
Get Radiology Tree app to read full this article<
Get Radiology Tree app to read full this article<
Get Radiology Tree app to read full this article<
Get Radiology Tree app to read full this article<
Get Radiology Tree app to read full this article<
Get Radiology Tree app to read full this article<
AdaBoost machine learning
Get Radiology Tree app to read full this article<
Get Radiology Tree app to read full this article<
Get Radiology Tree app to read full this article<
Get Radiology Tree app to read full this article<
Get Radiology Tree app to read full this article<
Get Radiology Tree app to read full this article<
Table 1
The Classification Conditions and Training Error of the Four Weak Classifiers Selected by the AdaBoost Algorithm for the First Level of the Cascade Classifier
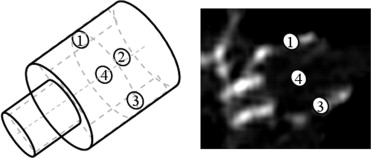
Point Weak Classifier Condition Training Error 1 Max > 320 HU 0.080 2 Max > 475 HU 0.092 3 Max > 460 HU 0.190 4 Max ≤ 150 HU 0.167
Together, these four weak classifiers could reduce the initial number of snegative samples by 90% during training. The point number corresponds to the illustration in Figure 3 .
Get Radiology Tree app to read full this article<
Get Radiology Tree app to read full this article<
Table 2
Results of the Training Process; Each Additional Level to the Cascade Caused an Approximate 10-Fold Reduction in the Number of Negative Samples
Cascade Level Weak Classifiers (one per feature) Negatives Specificity Initial — 11,433,366 — 1 4 1,109,209 90.03% 2 8 11,4273 99.00% 3 16 33,504 99.71% 4 32 1197 99.99%
The number of weak classifiers used at each level as well as the specificity of the cascade classifier up to and including that level is also shown.
Get Radiology Tree app to read full this article<
Device confidence score
Get Radiology Tree app to read full this article<

Get Radiology Tree app to read full this article<
Implementation
Get Radiology Tree app to read full this article<

Get Radiology Tree app to read full this article<
Endobronchial Valve Dataset
Get Radiology Tree app to read full this article<
Get Radiology Tree app to read full this article<
Get Radiology Tree app to read full this article<
Statistical Analysis
Get Radiology Tree app to read full this article<
Results
Get Radiology Tree app to read full this article<
Get Radiology Tree app to read full this article<
Get Radiology Tree app to read full this article<
Get Radiology Tree app to read full this article<
Get Radiology Tree app to read full this article<
Discussion
Get Radiology Tree app to read full this article<
Get Radiology Tree app to read full this article<
Get Radiology Tree app to read full this article<
Get Radiology Tree app to read full this article<
Get Radiology Tree app to read full this article<
Get Radiology Tree app to read full this article<
Get Radiology Tree app to read full this article<
Conclusion
Get Radiology Tree app to read full this article<
Get Radiology Tree app to read full this article<
References
1. Toma T., Hopkinson N., Hillier J., Hansell D., Morgan C., Goldstraw P., Polkey M., Geddes D.: Bronchoscopic volume reduction with valve implants in patients with severe emphysema. Lancet 2003; 361: pp. 931-933.
2. Wan I.Y.P., Toma T.P., Geddes D.M., et. al.: Bronchoscopic lung volume reduction for end-stage emphysema: report on the first 98 patients. Chest 2006; 129: pp. 518-526.
3. Yim A., Hwong T., Lee T., Li W., Lam S., Yeung T., Hui D., Ko F., Sihoe A., Thung K., Arifi A.: Early results of endoscopic lung volume reduction for emphysema. J Thorac Cardiovasc Surg 2004; 127: pp. 1564-1573.
4. Maxfield R.A.: New and emerging minimally invasive techniques for lung volume reduction. Chest 2004; 125: pp. 777-783.
5. Harris E., McNair H., Evans P.: Feasibility of fully automated detection of fiducial markers implanted into the prostate using electronic portal imaging: A comparison of methods. Int J Radiation Oncology Biol Phys 2006; 66: pp. 1263-1270.
6. van der Weide R., Bakker C., Viergever M.: Localization of intravascular devices with paramagnetic markers in MR images. IEEE Trans Med Imaging 2001; 20: pp. 1061-1071.
7. Brown M.S., Goldin J.G., McNitt-Gray M.F., Greaser L.E., Sapra A., Li K.T., Sayre J.W., Martin K., Aberle D.R.: Knowledge-based segmentation of thoracic CT images for assessment of split lung function. Med Phys 2000; 27: pp. 592-598.
8. Abramson Y., Freund Y.: SEmi-automatic VIsuaL LEarning (SEVILLE): a tutorial on active learning for visual object recognition. IEEE Computer Society Conference on Computer Vision and Pattern Recognition 2005;
9. Viola P., Jones M.: Rapid object detection using a boosted cascade of simple features. IEEE Computer Society Conference on Computer Vision and Pattern Recognition 2001;
10. Duda R.O., Hart P.E., Stork D.G.: Pattern classification.2nd ed.2001.John Wiley and SonsNew York, NY
11. Ochs R., Goldin J., Abtin F., Kim H.J., Brown K., Batra P., Roback D., McNitt-Gray M., Brown M.: Automated classification of lung bronchovascular anatomy in CT using AdaBoost. Med Image Anal 2007; 11: pp. 315-324.
12. Food and Drug Administration: Critical Path Opportunities List. http://www.fda.gov/oc/initiatives/criticalpath/reports/opp_list.pdf Accessed September 29, 2008
13. Das K.M., El-Menyar A.A., Salam A.M., Singh R., Dabdoob W.A.K., Albinali H.A., Suwaidi J.A.: Contrast-enhanced 64-section coronary multidetector CT angiography versus conventional coronary angiography for stent assessment. Radiology 2007; 245: pp. 424-432.