
Rationale and Objectives
The purpose of this study was to develop an automated method for detection of the hyperintense ischemic lesions related to subcortical vascular dementia based on conventional magnetic resonance images (T1-weighted, T2-weighted, and fluid-attenuated inversion-recovery images [FLAIR]).
Materials and Methods
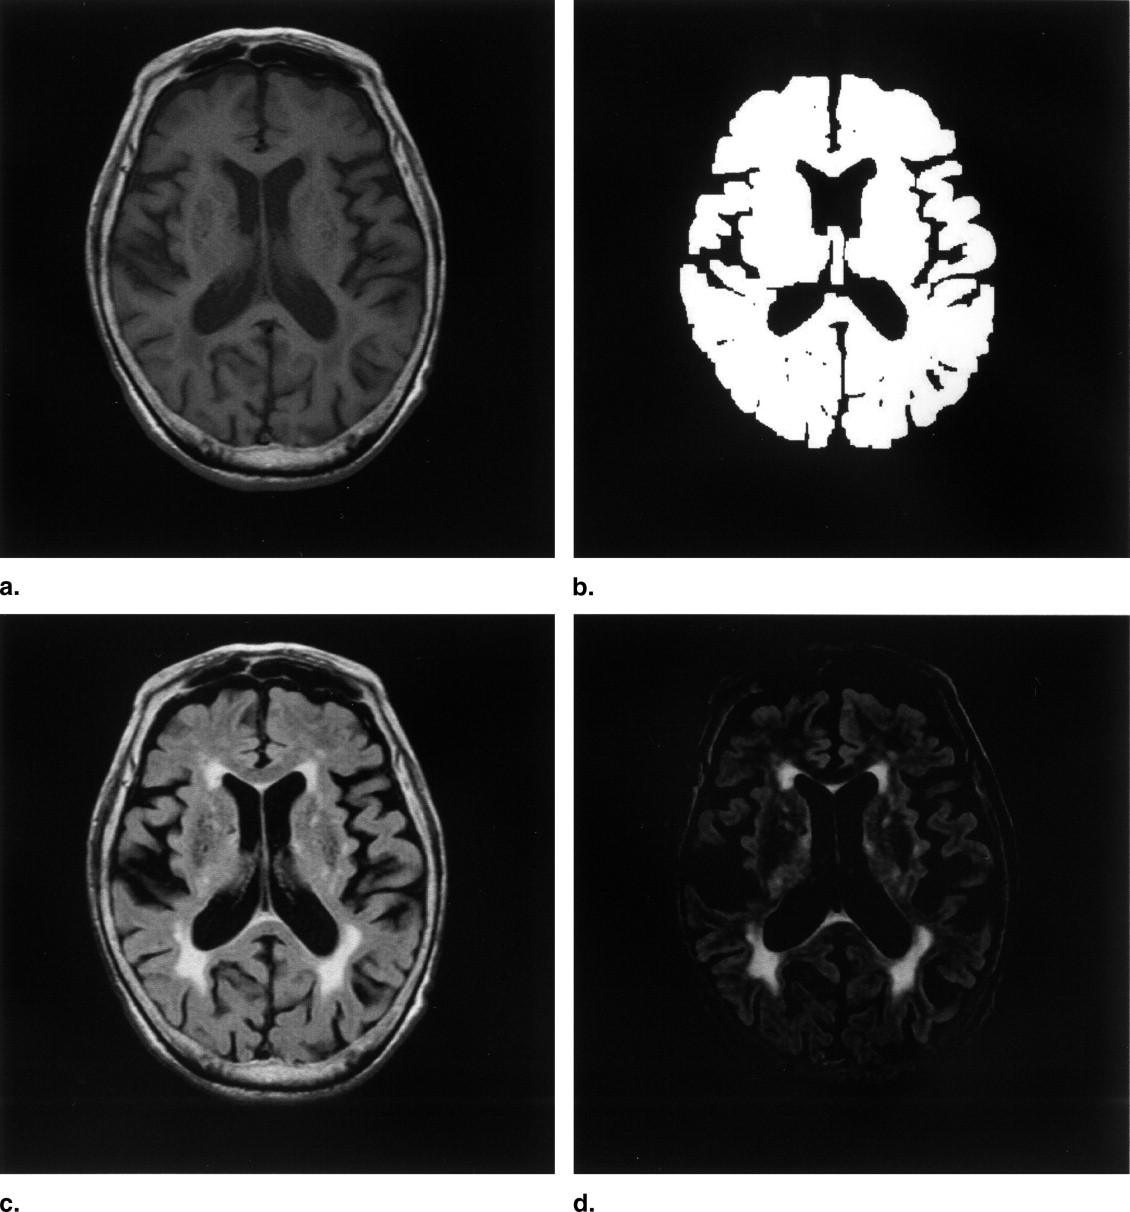
Our proposed method was based on subtraction between the T1-weighted image and the FLAIR image. First, a brain region was extracted by an automated thresholding technique based on a linear discriminant analysis for a pixel value histogram. Next, for enhancement of ischemic lesions, the T1-weighted image was subtracted from the fluid-attenuated inversion-recovery image. Ischemic lesion candidates were identified using a multiple gray-level thresholding technique and a feature-based region-growing technique on the subtraction image. Finally, an artificial neural network trained with 15 image features of the ischemic candidates was used to remove false-positives. We applied our method to nine patients with vascular dementia (age range, 64−94 years, mean age, 69.4 years; four males and five females), who were scanned on a 1.5-T magnetic resonance unit.
Results
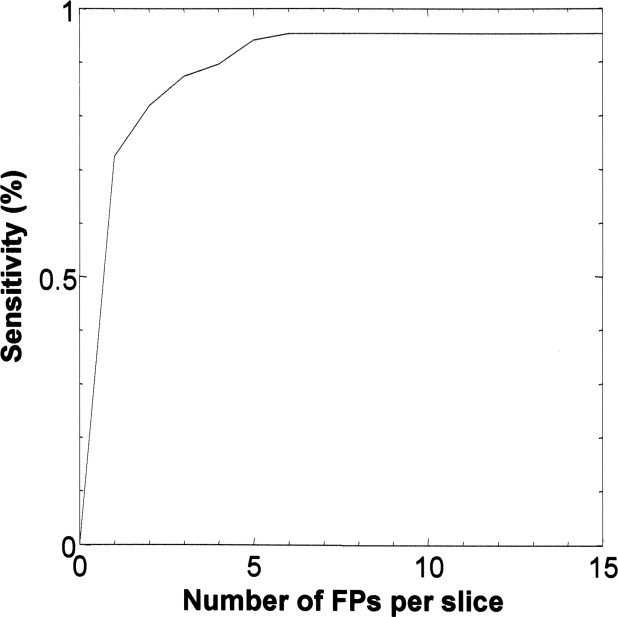
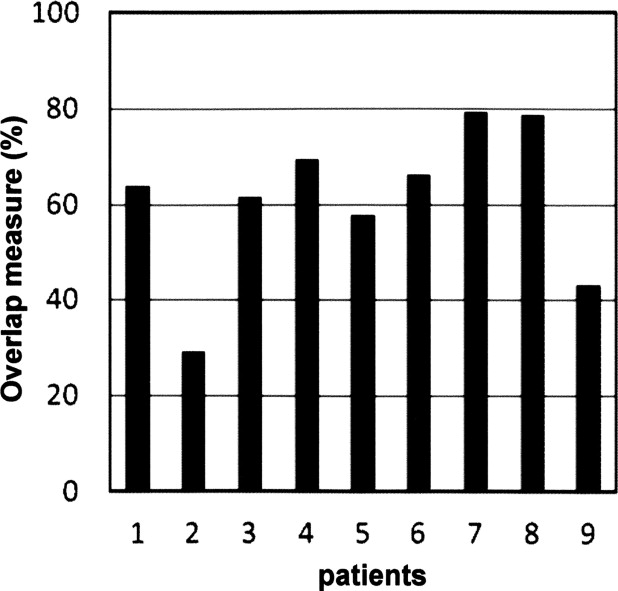
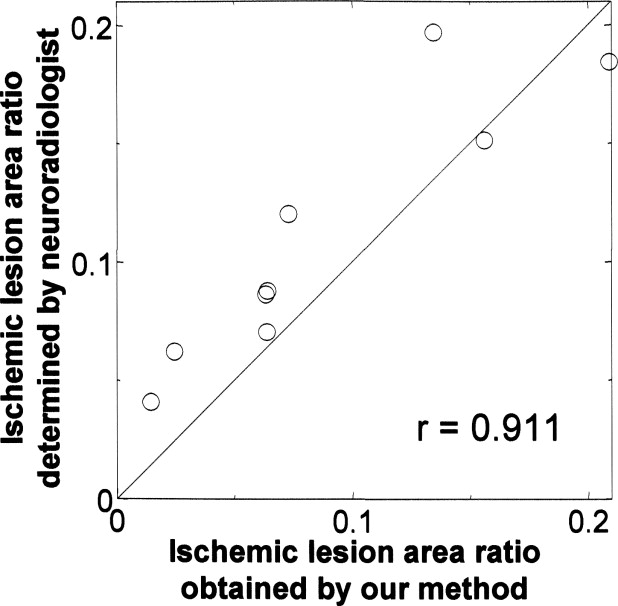
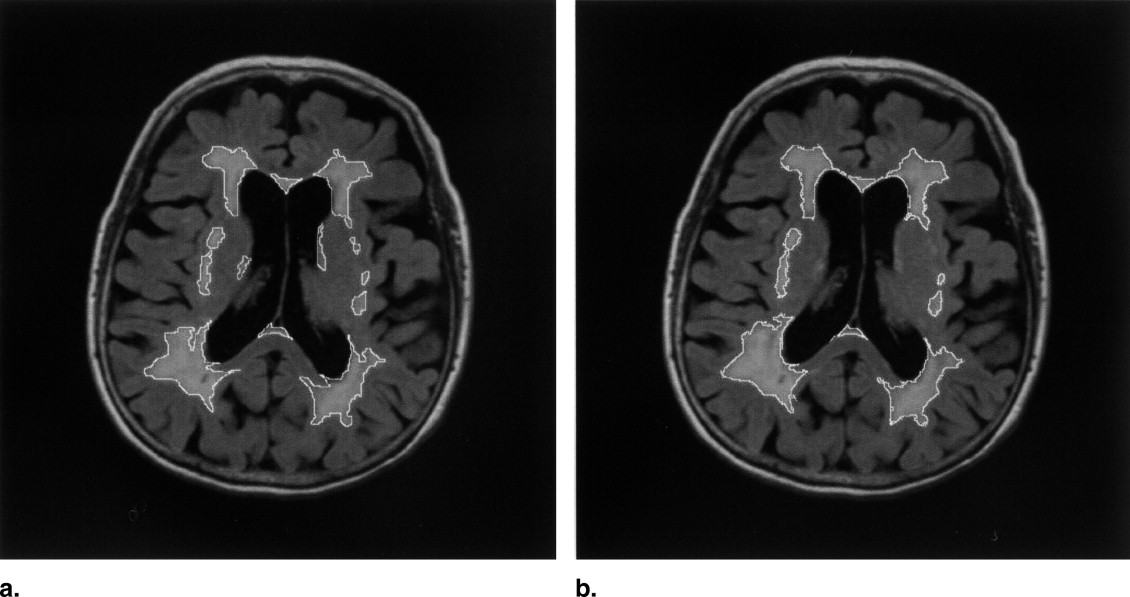
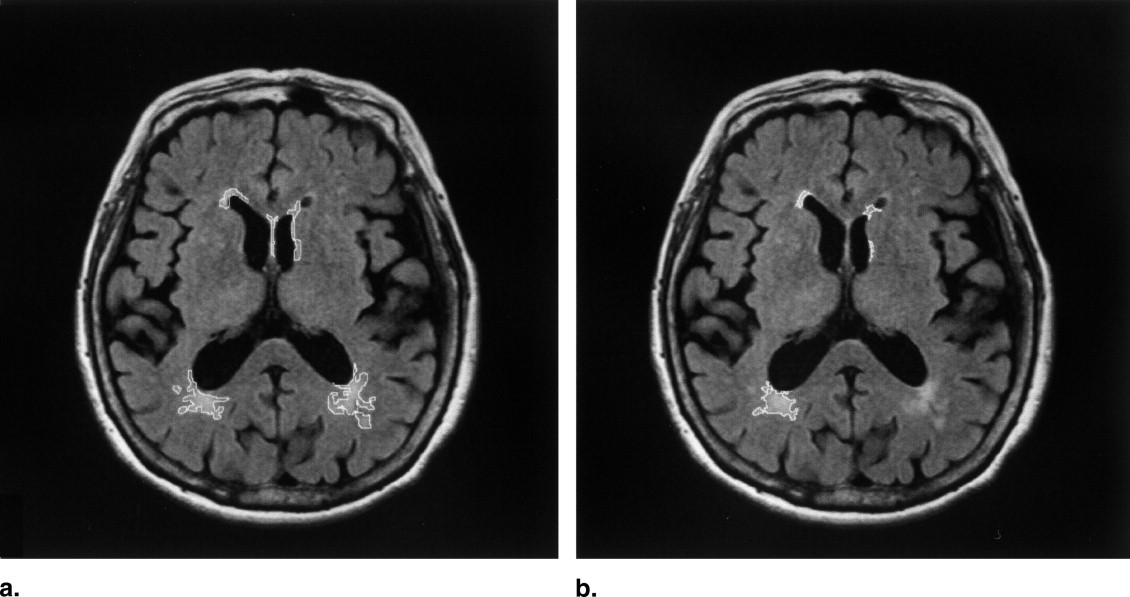
Our method achieved a sensitivity of 90% with 4.0 false-positives per slice in detection of ischemic lesions. The overlap measure between ischemic lesion areas obtained by our method and a neuroradiologist was 60.7% on average. The ratio of ischemic lesion area to the whole brain area obtained by our method correlated with that determined by a neuroradiologist with a correlation coefficient of 0.911.
Conclusion
Our preliminary results suggest that the proposed method may have feasibility for evaluation of the ischemic lesion area ratio.
Subcortical vascular dementia (VaD) is the second most common type of dementia in Japan. The prevalence of dementia disorders in Japanese population older than 70 years is 51% to 58% for Alzheimer’s disease (AD), which is the most common dementia disorder; 24% to 26% for VaD, 2% for mixed dementia (AD/VaD), and 14% to 23% for other types of dementia ( ). Ischemic lesions related to subcortical VaD are shown as hyperintense regions in the cerebral white matter on fluid-attenuated inversion-recovery (FLAIR) or T2-weighted images at magnetic resonance (MR) imaging. Several studies reported that the degree of the VaD correlated with a ratio of ischemic lesion area to the whole brain (ischemic lesion area ratio) ( ), which could provide the diagnostic information for VaD. Thus, it is very important to estimate the ischemic lesion area ratio to evaluate the degree of VaD. However, it would be difficult and very time consuming in routine clinical practice for neuroradiologists to evaluate the ischemic lesion area manually. A number of researchers attempted to develop methods for identifying and segmenting the ischemic lesions of the stroke ( ). Mohamed et al. ( ) developed a method for segmenting white matter lesions including the ischemic lesions in patients with VaD based on a modified k-nearest-neighbor method, using multispectral three-dimensional (3D) tissue MR images (i.e., T1-weighted, T2-weighted, and proton-density images). They showed that the 3D tissue segmentation technique could characterize white matter lesions with similar intensities on T2-weighted images. However, there is a need for a study that focuses on the ischemic lesions of VaD, because white matter lesions are similar in terms of intensity but their characteristics (eg, shape and location) differ. Therefore, the purpose of this study was to develop an automated method for detection of the hyperintense ischemic lesions related to subcortical VaD based on three types of MR images—T1-weighted, T2-weighted images, and FLAIR images.
Materials and methods
Subjects and MR Imaging
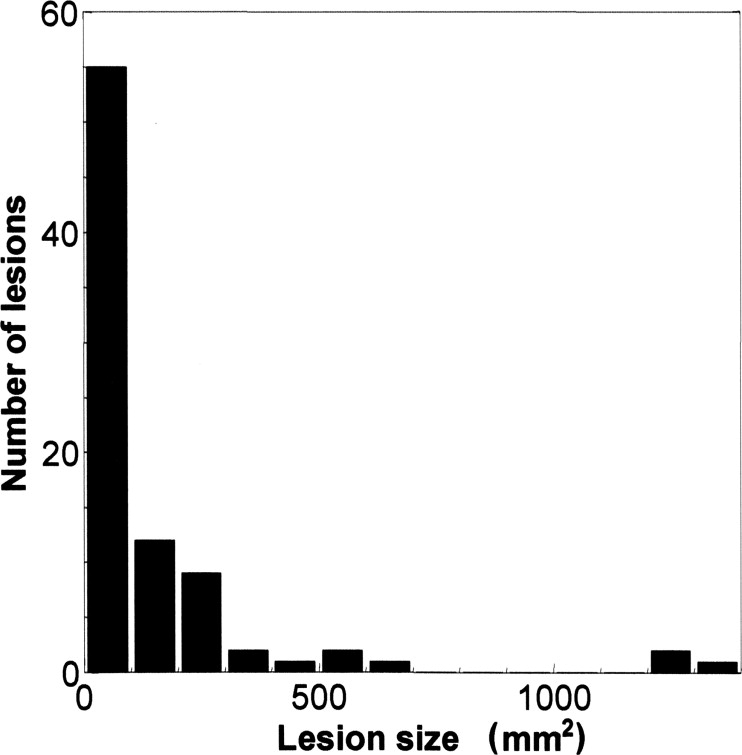
Nine clinical cases used in this study were imaged on a 1.5-T MR unit (Excelart; Toshiba, Tochigi, Japan) under the protocol approved by the institutional review board of Kyorin University Hospital after the nature of the procedure had been fully explained. The nine patients with clinically diagnosed VaD (age range, 64−94 years; mean age, 69.4 years; four males and five females) were scanned, using a slice thickness of 5 mm and a slice gap of 1.5 mm with T1-weighted (TR [repetition time]/TE [echo time]: 496/12 ms), T2-weighted (TR/TE 4280/105 ms), and FLAIR (TR/TE/TI [inversion time] 8000/105/2300 ms) sequences. Each MR image consisted of 320 × 320 to 512 × 512 pixels with a pixel size of 0.43 mm, and the number of gray levels was 10 bits. An experienced neuroradiologist and an experienced medical physicist selected a slice with the most hyperintense ischemic lesions (9.4 lesions on average) from each case, considering size, shape, and contrast. The total number of the ischemic lesions was 85, and the mean area was 147 ± 256 mm 2 . Figure 1 shows the area histogram of all ischemic lesions used for this study. The ischemic lesions with an area smaller than 100 mm 2 are 65% of 85 “truth” lesions determined visually by an experienced neuroradiologist.
Get Radiology Tree app to read full this article<
Detection of Hyperintense Regions in MR Images
Get Radiology Tree app to read full this article<
R=1XY∑X−1X=0∑Y−1Y=0(T(x,y)−T¯¯¯)(F(x,y)−F¯¯¯)tf R
=
1
X
Y
∑
X
=
0
X
−
1
∑
Y
=
0
Y
−
1
(
T
(
x
,
y
)
−
T
¯
)
(
F
(
x
,
y
)
−
F
¯
)
t
f
where T¯¯¯ T
¯ and t are the mean and the standard deviation, respectively, of the T1-weighted image T ( x, y ); F¯¯¯ F
¯ and f are the mean and the standard deviation, respectively, of the FLAIR image F ( x, y ); and X and Y are the number of pixels in x and y widths, respectively, of the region overlapped between the T1-weighted and FLAIR images.
Get Radiology Tree app to read full this article<
Get Radiology Tree app to read full this article<
ca<Da<ba c
a
<
D
a
<
b
a
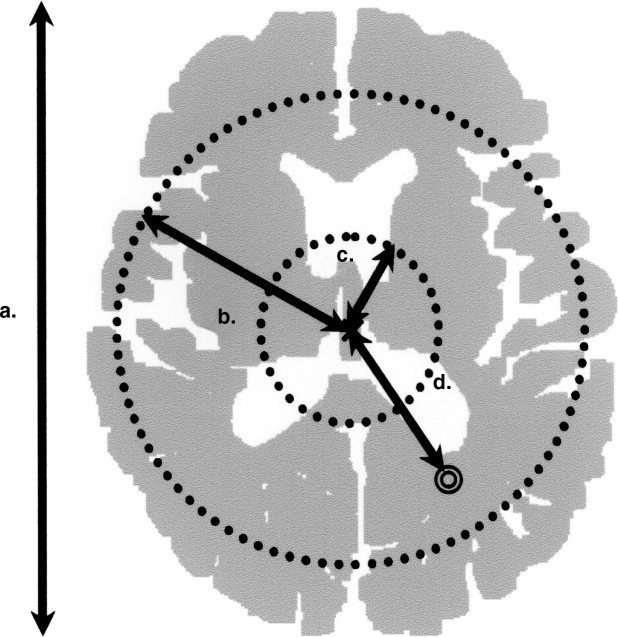
where a is the anteroposterior length of a brain as shown in Figure 4 ; b is the longest distance from a centroid of a head to an ischemic region; c is the shortest distance from a centroid of a head to an ischemic region; and D is the distance from a centroid to each ischemic region. The parameter a was automatically calculated for each case from a binalized brain image. The parameters c and b in Equation 2 shown in Figure 4 were empirically determined and fixed for all cases in this study so that all ischemic lesions in the white matter regions related to the VaD could be detected.
Get Radiology Tree app to read full this article<
Get Radiology Tree app to read full this article<
Reduction of False-Positives by Using an Artificial Neural Network
Get Radiology Tree app to read full this article<
Evaluation of Performance
Get Radiology Tree app to read full this article<
OverlapMeasure=n(T∩M)n(T∪M)×100 O
v
e
r
l
a
p
M
e
a
s
u
r
e
=
n
(
T
∩
M
)
n
(
T
∪
M
)
×
100
T is the “truth” regions determined visually by an experienced neuroradiologist, M is the candidate regions obtained by our method, and n is the number of pixels. This overlap measure indicates the degree of consistency between the “truth” regions and candidate regions. The FROC curve was produced by changing a threshold value for the ANN output, which was considered as the possibility of the ischemic lesion.
Get Radiology Tree app to read full this article<
Get Radiology Tree app to read full this article<
Results
Get Radiology Tree app to read full this article<
Get Radiology Tree app to read full this article<
Discussion
Get Radiology Tree app to read full this article<
Get Radiology Tree app to read full this article<
Get Radiology Tree app to read full this article<
Conclusion
Get Radiology Tree app to read full this article<
Acknowledgments
Get Radiology Tree app to read full this article<
Get Radiology Tree app to read full this article<
References
1. Yamada T., Kadekaru H., Matsumoto S., et. al.: Prevalence of dementia in the older Japanese-Brazilian population. Psychiatry Clin Neurosci 2002; 56: pp. 71-75.
2. Schmidt R., Fazekas F., Offenbacher H., et. al.: Magnetic resonance imaging white matter lesions and cognitive impairment in hypertensive individuals. Arch Neurol 1991; 48: pp. 417-420.
3. Breteler M.M., van Swieten J.C., Bots M.L., et. al.: Cerebral white matter lesions, vascular risk factors, and cognitive function in a population-based study: The Rotterdam Study. Neurology 1994; 44: pp. 1246-1252.
4. DeCarli C., Murphy D.G.M., Tranh M., et. al.: The effect of white matter hyperintensity volume on brain structure, cognitive performance, and cerebral metabolism of glucose in 51 healthy adults. Neurology 1995; 45: pp. 2077-2084.
5. Skoog I., Berg S., Johansson B., Palmertz B., Andreasson L.A.: The influence of white matter lesions on neuropsychological functioning in demented and non-demented 85-year-olds. Acta Neurol Scand 1996; 93: pp. 142-148.
6. Gootjes L., Teipel S.J., Zebuhr Y., et. al.: Regional distribution of white matter hyperintensities in vascular dementia, Alzheimer’s disease and healthy aging. Dement Geriatr Cogn Disord 2004; 18: pp. 180-188.
7. Ylikoski R., Ylikoski A., Erkinjuntti T., Sulkava , Raininko R., Tilvis R.: White matter changes in healthy elderly persons correlate with attention and speed of mental processing. Arch Neurol 1993; 50: pp. 818-824.
8. Mitsias P.D., Jacobs M.A., Hammoud R., et. al.: Multiparametric MRI ISODATA ischemic lesion analysis: Correlation with the clinical neurological deficit and single-parameter MRI techniques. Stroke 2002; 33: pp. 2839-2844.
9. Wu L., Jie T., Jianping D.: Automatic segmentation of cerebral ischemic lesions from diffusion tensor MR images. Proc SPIE 2004; 5370: pp. 1640-1649.
10. Wu L., Jie T., Jianping D.: Segmentation and quantification of ischemic lesions on DWI images with different b-value at high magnetic field (3.0T). Proc SPIE 2004; 5369: pp. 613-622.
11. Mohamed F.B., Vinitski S., Gonzalez C., et. al.: Increased differentiation of intracranial white matter lesions by multispectral 3D-tissue segmentation: Preliminary results. Magn Reson Imaging 2001; 19: pp. 207-218.
12. Otsu N.: A threshold selection method from gray level histograms. IEEE Trans Syst Man Cybern SMC 1979; 9: pp. 62-66.
13. Arimura H., Katsuragawa S., Suzuki K., et. al.: Computerized scheme for automated detection of lung nodules in low-dose CT images for lung cancer screening. Acad Radiol 2004; 11: pp. 617-629.
14. Arimura H., Yamashita Y., Tsuchiya K.: Computerized detection of ischemic lesions related to subcortical vascular dementia on magnetic resonance images. Proc ISICE 2007; pp. 235-238.
15. Wen W., Sachdev P.: The topography of white matter hyperintensities on brain MRI in healthy 60- to 64-year-old individuals. NeuroImage 2004; 22: pp. 144-154.