
Rationale and Objectives
To compare the performance of computer aided detection (CAD) systems on pairs of full-field digital mammogram (FFDM) and screen-film mammogram (SFM) obtained from the same patients.
Materials and Methods
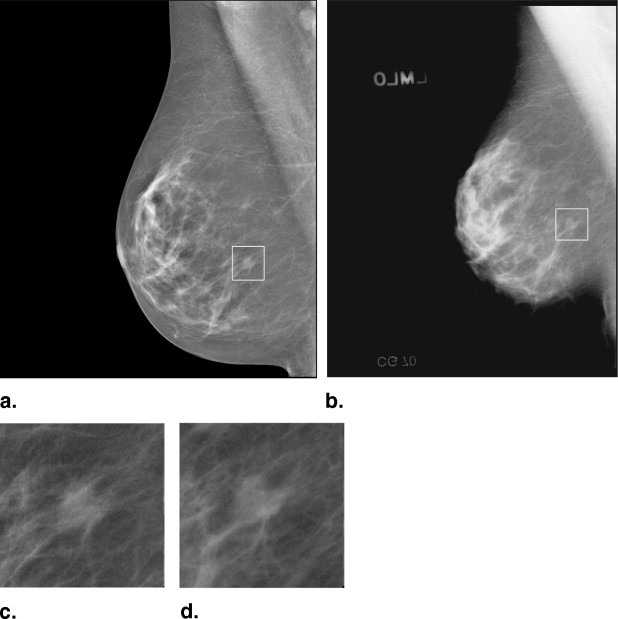
Our CAD systems on both modalities have similar architectures that consist of five steps. For FFDMs, the input raw image is first log-transformed and enhanced by a multiresolution preprocessing scheme. For digitized SFMs, the input image is smoothed and subsampled to a pixel size of 100 μm × 100 μm. For both CAD systems, the mammogram after preprocessing undergoes a gradient field analysis followed by clustering-based region growing to identify suspicious breast structures. Each of these structures is refined in a local segmentation process. Morphologic and texture features are then extracted from each detected structure, and trained rule-based and linear discriminant analysis classifiers are used to differentiate masses from normal tissues. Two datasets, one with masses and the other without masses, were collected. The mass dataset contained 131 cases with 131 biopsy proven masses, of which 27 were malignant and 104 benign. The true locations of the masses were identified by an experienced Mammography Quality Standards Act (MQSA) radiologist. The no-mass data set contained 98 cases. The time interval between the FFDM and the corresponding SFM was 0 to 118 days.
Results
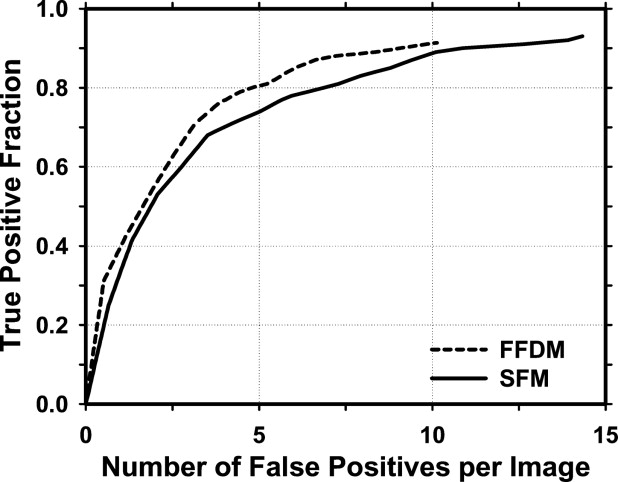
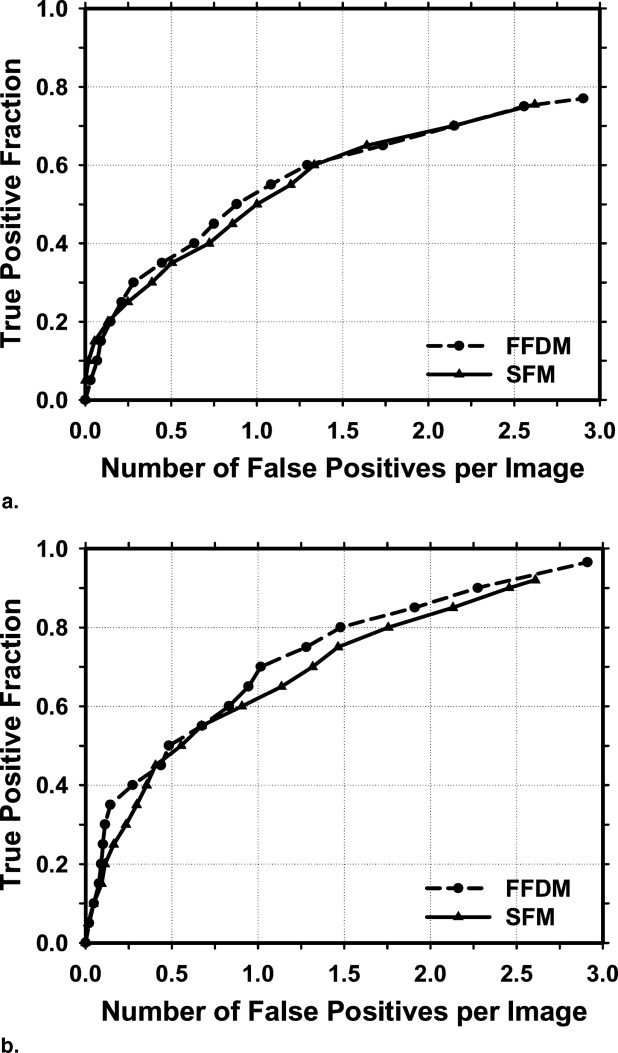
Our CAD system achieved case-based sensitivities of 70%, 80%, and 90% at 0.9, 1.5, and 2.6 false positive (FP) marks/image, respectively, on FFDMs, and the same sensitivities at 1.0, 1.4, and 2.6 FP marks/image, respectively, on SFMs.
Conclusions
The difference in the performances of our FFDM and SFM CAD systems did not achieve statistical significance.
Full-field digital mammography (FFDM) and screen-film mammography (SFM) are two available methods for breast cancer screening in clinical practice. FFDM detectors provide higher detective quantum efficiency (DQE) and signal-to-noise ratio (SNR), wider dynamic range, and higher contrast sensitivity than SFM. FFDM may alleviate some of the limitations of SFM, especially in breasts with dense fibroglandular tissue ( ). In the last few years, several FFDM systems became commercially available because of the potential of digital imaging to improve breast cancer detection.
Several clinical trials have been conducted to compare radiologists’ interpretation on FFDMs and SFMs. Lewin et al ( ) conducted a clinical study to compare FFDMs and SFMs for the detection of breast cancer in 6,737 examinations of women 40 years of age and older collected from two institutions. Forty-two cancers were detected within this population. The difference in cancer detection was not statistically significant ( P > .1) between FFDMs and SFMs. FFDMs resulted in fewer recalls than did SFM, which was statistically significant ( P < .001). Another clinical trial ( ) aiming at collecting data for US Food and Drug Administration approval included SFMs and FFDMs of 676 women who were scheduled to undergo breast biopsy. The average area under the receiver operating characteristic (ROC) curve, the sensitivity and the specificity were 0.715, 0.66 and 0.67 for printed FFDM and 0.765, 0.74, 0.60 for SFM, respectively. However, none of these differences achieved statistical significance. Skaane et al ( ) has conducted several clinical studies to compare SFM and FFDM with soft-copy interpretation for reader performance in detection and classification of breast lesions. According to their findings, there was no significant difference between FFDM and SFM either in detection or in classification. A recent study by Pisano et al ( ) collected a total of 49,528 patients at 33 sites in the United States and Canada. Mammograms were interpreted independently by two radiologists. The overall diagnostic accuracy of FFDMs and SFMs for breast cancers was similar. However, FFDM was more accurate in women younger than age 50 years, women with radiographically dense breasts, and premenopausal or perimenopausal women.
Get Radiology Tree app to read full this article<
Materials and methods
Materials
Get Radiology Tree app to read full this article<
Get Radiology Tree app to read full this article<
Table 1
Description of Cases in the Mass Datasets and Subsets for Training and Testing in the Twofold Cross-Validation Scheme
Mass Set Mass Subset 1 Mass Subset 2 FFDM SFM FFDM SFM FFDM SFM Total number of cases 131 131 65 65 66 66 Total number of images 262 262 130 130 132 132 Number of visible masses (by case) 131 130 65 65 66 65 Number of masses only visible on one view 8 9 5 5 3 4 Number of visible masses (by image) 254 251 125 125 129 126 Number of visible malignant masses 27 27 12 12 15 15 Number of visible benign masses 104 103 53 53 51 50
FFDM: full-field digital mammogram; SFM: screen-film mammogram.
Get Radiology Tree app to read full this article<
Methods
CAD System
Get Radiology Tree app to read full this article<
Get Radiology Tree app to read full this article<
Get Radiology Tree app to read full this article<
Get Radiology Tree app to read full this article<
Get Radiology Tree app to read full this article<
Training and Test CAD System
Get Radiology Tree app to read full this article<
Get Radiology Tree app to read full this article<
Get Radiology Tree app to read full this article<
Evaluation Methods
Get Radiology Tree app to read full this article<
Get Radiology Tree app to read full this article<
Get Radiology Tree app to read full this article<
Get Radiology Tree app to read full this article<
Results
Get Radiology Tree app to read full this article<
Get Radiology Tree app to read full this article<
Get Radiology Tree app to read full this article<
Get Radiology Tree app to read full this article<
Get Radiology Tree app to read full this article<
Get Radiology Tree app to read full this article<
Table 2
Estimation of the Statistical Significance of the Difference in the FROC Performances Between the FFDM and SFM CAD Systems
A 1 (AFROC) FOM (JAFROC) All Cases Malignant Cases All Cases Malignant Cases Test Subset 1 Test Subset 2 Test Subset 1 Test Subset 2 Test Subset 1 Test Subset 2 Test Subset 1 Test Subset 2 FFDM 0.48 0.49 0.51 0.49 0.47 0.48 0.55 0.47 SFM 0.42 0.43 0.47 0.42 0.46 0.41 0.48 0.42P values .17 .16 .56 .23 .73 .33 .29 .59
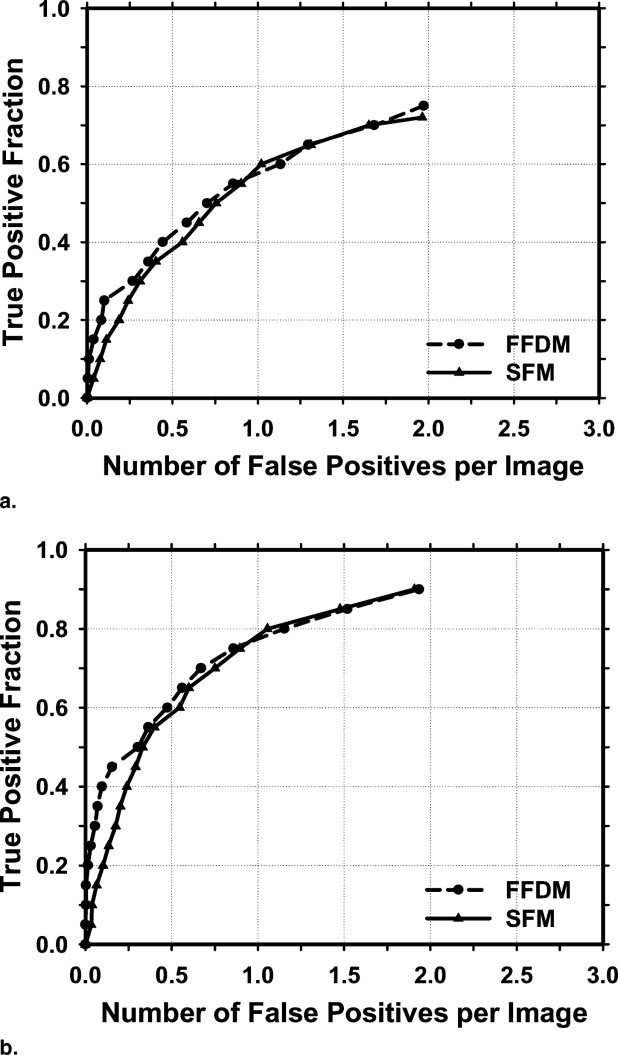
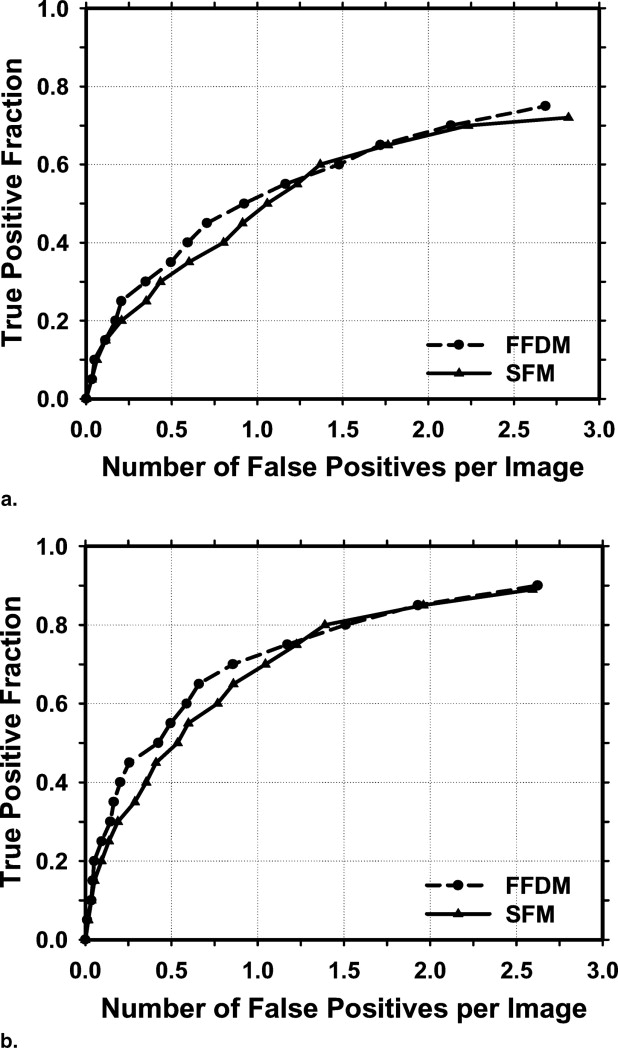
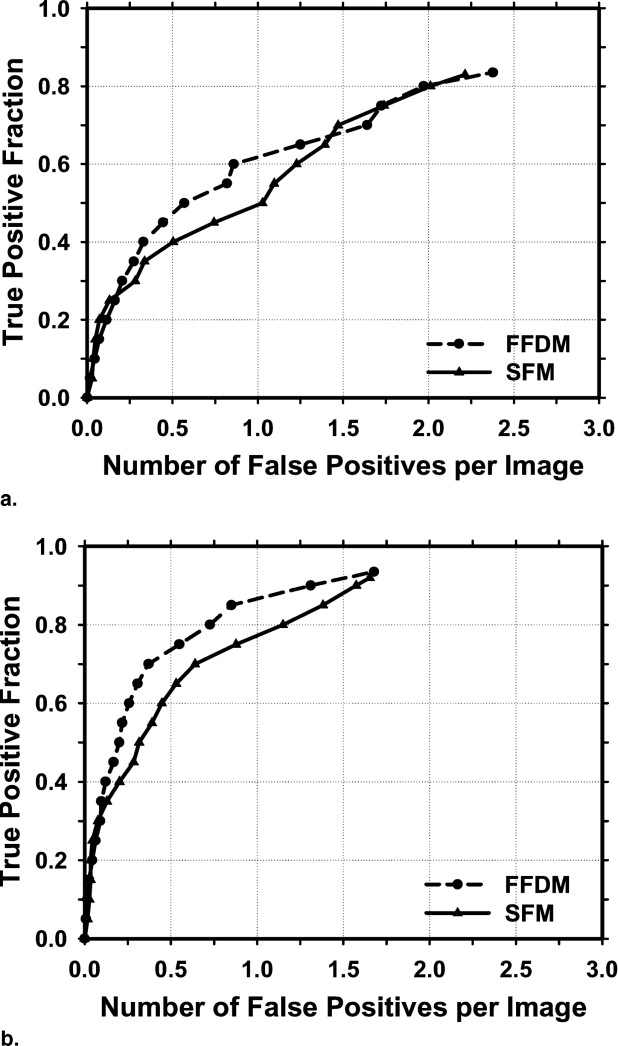
The FROC curves with the FP marker rates obtained from the no-mass dataset were compared.
FROC, ; FFDM, full-field digital mammogram; SFM, screen-film mammogram; CAD, computed-aided detection; AFROC, alternative free-response receiver operating characteristic; FOM, figure-of-merit; JAFROC, jackknife free-response ROC.
Get Radiology Tree app to read full this article<
Get Radiology Tree app to read full this article<
Get Radiology Tree app to read full this article<
Get Radiology Tree app to read full this article<
Get Radiology Tree app to read full this article<
Discussion
Get Radiology Tree app to read full this article<
Get Radiology Tree app to read full this article<
Get Radiology Tree app to read full this article<
Get Radiology Tree app to read full this article<
Get Radiology Tree app to read full this article<
Get Radiology Tree app to read full this article<
Conclusion
Get Radiology Tree app to read full this article<
Get Radiology Tree app to read full this article<
References
1. Pisano E.D., Gasonis C., Hendrick E., et. al.: Diagnostic performance of digital versus film mammography for breast-cancer screening. N Engl J Med 2005; 353: pp. 1773-1783.
2. Lewin J.M., Hendrick R.E., D’Orsl C.J., et. al.: Comparison of full-field digital mammography with screen-film mammography for cancer detection: results of 4,945 paired examinations. Radiology 2001; 218: pp. 873-880.
3. Lewin J.M., D’Orsi C.J., Hendrick R.E., et. al.: Clinical comparison of full-field digital mammography and scree-film mammography for detection of breast cancer. AJR Am J Roentgenol 2002; 179: pp. 671-677.
4. Cole E., Pisano E., Brown M., et. al.: Diagnostic accuracy of Fischer SenoScan digital mammography versus screen-film mammography in a diagnostic mammography population. Acad Radiol 2004; 11: pp. 876-880.
5. Skaane P., Young K., Skjennald A.: Population-based mammography screening: comparison of screen-film and full-field digital mammography with soft-copy reading—Oslo I Study. Radiology 2003; 229: pp. 877-884.
6. Skaane P., Skjennald A.: Screen-film mammography versus full-field digital mammography with soft-copy reading: randomized trial in a population-based screening program—The Oslo II Study. Radiology 2004; 232: pp. 197-204.
7. Skaane P., Balleyguier C., Diekmann F., et. al.: Breast lesion detection and classification: comparison of screen-film mammography and full-field digital mammography with soft-copy reading—observer performance study. Radiology 2005; 237: pp. 37-44.
8. Hillman B.J., Fajardo L.L., Hunter T.B., et. al.: Mammogram interpretation by physician assistants. AJR Am J Roentgenol 1987; 149: pp. 907-911.
9. Bassett L.W., Bunnell D.H., Jahanshahi R., et. al.: Breast cancer detection: one versus two views. Radiology 1987; 165: pp. 95-97.
10. Wallis M.G., Walsh M.T., Lee J.R.: A review of false negative mammography in a symptomatic population. Clin Radiol 1991; 44: pp. 13-15.
11. Harvey J.A., Fajardo L.L., Innis C.A.: Previous mammograms in patients with impalpable breast carcinomas: retrospective vs blinded interpretation. AJR Am J Roentgenol 1993; 161: pp. 1167-1172.
12. Bird R.E., Wallace T.W., Yankaskas B.C.: Analysis of cancers missed at screening mammography. Radiology 1992; 184: pp. 613-617.
13. Beam C.A., Layde P.M., Sullivan D.C.: Variability in the interpretation of screening mammograms by US radiologists—findings from a national sample. Arch Intern Med 1996; 156: pp. 209-213.
14. Beam V., Sullivan D., Layde P.: Effect of human variability on independent double reading in screening mammography. Acad Radiol 1996; 3: pp. 891-897.
15. Shtern F., Stelling C., Goldberg B., et. al.: Novel technologies in breast imaging: National Cancer Institute perspective.1995.pp. 153-156. In: Society of Breast Imaging Conference. Orlando, FL,
16. Vyborny C.J.: Can computers help radiologists read mammograms?. Radiology 1994; 191: pp. 315-317.
17. Li L., Clark R.A., Thomas J.A.: Computer-aided diagnosis of masses with full-field digital mammography. Acad Radiol 2002; 9: pp. 4-12.
18. Petrick N., Chan H.P., Sahiner B., et. al.: Breast cancer detection: evaluation of a mass detection algorithm for computer-aided diagnosis: experience in 263 patients. Radiology 2002; 224: pp. 217-224.
19. Wei J., Sahiner B., Hadjiiski L.M., et. al.: Two-view information fusion for improvement of computer-aided detection (CAD) of breast masses on mammograms. SPIE Proc 2006; 6144: pp. 241-247.
20. Wei J., Sahiner B., Chan H.P., et. al.: Computer aided diagnosis system for mass detection: comparison of performance on full-field digital mammograms and digitized film mammograms.2003.pp. 387. RSNA 2003, Chicago, November 30–December 5,
21. Wei J., Sahiner B., Hadjiiski L.M., et. al.: Computer aided detection of breast masses on full field digital mammograms. Med Phys 2005; 32: pp. 2827-2838.
22. Burt P.J., Adelson E.H.: The Laplacian pyramid as a compact image code. IEEE Trans Commun 1983; pp. 337-345. COM-31
23. Wei J., Sahiner B., Hadjiiski L.M., et. al.: Computer aided detection of breast masses on full-field digital mammograms: false positive reduction using gradient field analysis. Proc SPIE Med Imaging 2004; 5370: pp. 992-998.
24. Petrick N., Chan H.P., Sahiner B., et. al.: Combined adaptive enhancement and region-growing segmentation of breast masses on digitized mammograms. Med Phys 1999; 26: pp. 1642-1654.
25. Sahiner B., Petrick N., Chan H.P., et. al.: Computer-aided characterization of mammographic masses: accuracy of mass segmentation and its effects on characterization. IEEE Tran Med Imaging 2001; 20: pp. 1275-1284.
26. Wei D., Chan H.P., Petrick N., et. al.: False-positive reduction technique for detection of masses on digital mammograms: global and local multiresolution texture analysis. Med Phys 1997; 24: pp. 903-914.
27. Norusis M.J.: 1993.SPSS IncChicago, IL
28. Hadjiiski L.M., Sahiner B., Chan H.P., et. al.: Analysis of temporal change of mammographic features: computer-aided classification of malignant and benign breast masses. Med Phys 2001; 28: pp. 2309-2317.
29. Metz C.E., Herman B.A., Shen J.H.: Maximum-likelihood estimation of receiver operating characteristic (ROC) curves from continuously-distributed data. Stat Med 1998; 17: pp. 1033-1053.
30. Sahiner B., Chan H.P., Petrick N., et. al.: Feature selection and classifier performance in computer-aided diagnosis: the effect of finite sample size. Med Phys 2000; 27: pp. 1509-1522.
31. Swensson R.G.: Unified measurement of observer performance in detection and localizing target objects on images. Med Phys 1996; 23: pp. 1709-1724.
32. Chakraborty D.P., Winter L.H.L.: Free-response methodology: alternate analysis and a new observer-performance experiment. Radiology 1990; 174: pp. 873-881.
33. Chakraborty D.P., Berbaum K.S.: Observer studies involving detection and localization: modeling, analysis, and validation. Med Phys 2004; 31: pp. 2313-2330.
34. Hendrick R., Lewin J., D’Orsi C., et. al.: Non-inferiority study of FFDM in an enriched diagnostic cohort: comparison with screen-film mammography in 625 women.Yaffe M.J.IWDM 2000: 5th International Workshop on Digital Mammography: Medical Physics.2001.pp. 475-481.
35. Chan H.P., Wei J., Zhou C., Helvie M.A., et. al.: Comparison of mammographic density estimated on digital mammograms and screen-film mammograms.2003.pp. 424. RSNA 89th Scientific Assembly (Chicago, IL)
36. Chan H.P., Sahiner B., Wagner R.F., et. al.: Classifier design for computer-aided diagnosis: effects of finite sample size on the mean performance of classical and neural network classifiers. Med Phys 1999; 26: pp. 2654-2668.
37. Kupinski M.A., Giger M.L.: Feature selection with limited datasets. Med Phys 1999; 26: pp. 2176-2182.
38. O’Shaughnessy K.F., Castellino R.A., Muller S.L., et. al.: Computer-aided detection (CAD) on 90 biopsy-proven breast cancer cases acquired on a full-field digital mammography (FFDM) system. Radiology 2001; 221: pp. 471.
39. Warren Burhenne L.J., Wood S.A., D’Orsi C.J., et. al.: Potential contribution of computer-aided detection to the sensitivity of screening mammography. Radiology 2000; 215: pp. 554-562.
40. Brem R.E., Hoffmeister J.W., Rapelyea J.A., et. al.: Impact of breast density on computer-aided detection for breast cancer. AJR Am J Roentgenol 2005; 184: pp. 439-444.