
Rationale and Objectives
This study evaluates the accuracy of dual-energy spectral computed tomography (DEsCT) imaging with the aid of computer-aided diagnosis (CAD) system in assessing serosal invasion in patients with gastric cancer.
Materials and Methods
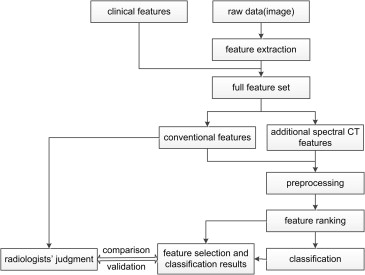
Thirty patients with gastric cancer were enrolled in this study. Two types of features (information) were collected with the use of DEsCT imaging: conventional features including patient’s clinical information (eg, age, gender) and descriptive characteristics on the CT images (eg, location of the lesion, wall thickness at the gastric cardia) and additional spectral CT features extracted from monochromatic images (eg, 60 keV) and material-decomposition images (eg, iodine- and water-density images). The classification results of the CAD system were compared to pathologic findings. Important features can be found out using support vector machine classification method in combination with feature-selection technique thereby helping the radiologists diagnose better.
Results
Statistical analysis showed that for the collected cases, the feature “long axis” was significantly different between group A (serosa negative) and group B (serosa positive) ( P < .05). By adding quantitative spectral features from several regions of interest (ROIs), the total classification accuracy was improved from 83.33% to 90.00%. Two feature ranking algorithms were used in the CAD scheme to derive the top-ranked features. The results demonstrated that low single-energy (approximately 60 keV) CT values, tumor size (long axis and short axis), iodine (water) density, and Effective-Z values of ROIs were important for classification. These findings concurred with the experience of the radiologist.
Conclusions
The CAD system designed using machine-learning algorithms may be used to improve the identification accuracy in the assessment of serosal invasion in patients of gastric cancer with DEsCT imaging and provide some indicators which may be useful in predicting prognosis.
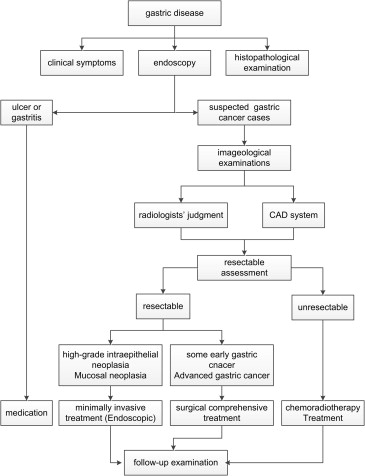
Gastric cancer, one of the leading causes of cancer death, imposes a large burden on several countries in Asia, Latin America, and Central and Eastern Europe . Curative surgery is the only option to cure gastric cancer; therefore, early detection is critical for gastric cancer resectability . The tumor-node metastasis (TNM) classification system is the most commonly used staging system for gastric cancer. T describes the size of the primary tumor and whether it has invaded nearby tissues; N describes the involved regional lymph nodes; and M describes distant metastases . Numerous studies have been conducted to evaluate various examinations in the TNM staging of gastric cancer and to determine the effects of such examinations on treatment . The correlation between radiology examinations and pathology is critical for appropriate treatment planning . Lee et al. finalized the current imaging and inspection techniques for gastric cancer according to the latest revision of the seventh American Joint Committee on Cancer guidelines .
Figure 1 displays the stratification of the gastric wall and the visualization of its different layers. The stomach wall is composed of five layers: mucosa, submucosa, proper muscularis, subserosa, and serosa. However, only three layers can be observed from multiple-detector computed tomography (MDCT) images. In particular, mucosal layers exhibit high attenuation, submucosal layers appear as low attenuation signals, and musculoserosal layers display high attenuation shadow . Identifying the accurate tumor invasion depth through a comprehensive preoperative evaluation combined with reasonable individual postoperative therapy is important to improve prognosis . Accordingly, this work attempts to analyze the dual-energy spectral CT (DEsCT) imaging data from the perspective of tumor invasion depth prediction.
 Open full size image
Figure 1
Schematic drawing of a cross-sectional gastric wall. CT, computed tomography.
Get Radiology Tree app to read full this article<
Get Radiology Tree app to read full this article<
Get Radiology Tree app to read full this article<
 Open full size image
Figure 2
DEsCT images of a 54-year-old man with mucinous adenocarcinoma in the gastric antrum of mucosal layer invasion. (a) A 70-keV monochromatic image; (b) iodine-based material-decomposition image; (c) water-based material-decomposition image; (d) monochromatic review with spectral Hounsfield unit (HU) curve to show the spectral signature of lesion ( red ) and normal gastric wall ( yellow ). (Color version of figure is available online.)
 Open full size image
Figure 3
DEsCT images of a 63-year-old man with adenocarcinoma in the gastric antrum of serosa layer invasion. (a) A 70-keV monochromatic image; (b) iodine-based material-decomposition image; (c) water-based material-decomposition image; (d) monochromatic review with spectral Hounsfield unit (HU) curve to show the spectral signature of lesion ( red ) and normal gastric wall ( yellow ). (Color version of figure is available online.)
Get Radiology Tree app to read full this article<
Get Radiology Tree app to read full this article<
Materials and Methods
Patients
Get Radiology Tree app to read full this article<
CT Scan
Get Radiology Tree app to read full this article<
Get Radiology Tree app to read full this article<
Image Interpretation
Get Radiology Tree app to read full this article<
CAD System
Get Radiology Tree app to read full this article<
Get Radiology Tree app to read full this article<
Table 1
Characteristics of Patients
Feature Description Number Gender 0, Male; 1, female 1 Age Year 1 Cardia Thickness/mm 1 Gastric body Thickness/mm 1 Antrum Thickness/mm 1 Location 0, Angle/1, antrum/2, body/3, cardia 1 Long axis Mm 1 Short axis Mm 1 Monochromatic CT values 40–140 keV (AP and PP) 22 Calcium–iodine Material-decomposition density (AP and PP) 2 Calcium–uricacid Material-decomposition density (AP and PP) 2 Calcium–water Material-decomposition density (AP and PP) 2 Calcium–fat Material-decomposition density (AP and PP) 2 Fat–calcium Material-decomposition density (AP and PP) 2 Fat–iodine Material-decomposition density (AP and PP) 2 Fat–water Material-decomposition density (AP and PP) 2 Iodine–calcium Material-decomposition density (AP and PP) 2 Iodine–uricacid Material-decomposition density (AP and PP) 2 Iodine–water Material-decomposition density (AP and PP) 2 Iodine–fat Material-decomposition density (AP and PP) 2 Uricacid–calcium Material-decomposition density (AP and PP) 2 Uricacid–iodine Material-decomposition density (AP and PP) 2 Water–calcium Material-decomposition density (AP and PP) 2 Water–iodine Material-decomposition density (AP and PP) 2 Water–fat Material-decomposition density (AP and PP) 2 Effective-Z AP and PP 2 Total 288
AP, arterial phase; CT, computed tomography; PP, portal venous phase.
Conventional features: 8 (including clinical features and descriptive image features).
Additional spectral CT features: 280 (monochromatic CT values, material-decomposition density values, and Effective-Z value).
Total features: 8 + (11 × 2 + 17 × 2) × 5 = 288.
Get Radiology Tree app to read full this article<
Get Radiology Tree app to read full this article<
Get Radiology Tree app to read full this article<
Get Radiology Tree app to read full this article<
Get Radiology Tree app to read full this article<
Get Radiology Tree app to read full this article<
Get Radiology Tree app to read full this article<
Get Radiology Tree app to read full this article<
Table 2
Results of Statistical Analysis
Statistical Analysis Count Gender Age Long Axis Short Axis Male Female Serosa negative ∗ 14 12 2 61.64 ± 10.70 32.39 ± 14.84 13.99 ± 9.66 Serosa positive ∗ 16 13 3 59.19 ± 11.92 59.43 ± 20.23 19.97 ± 6.36 Test value_c_ 2 = 0.107t = 0.590t = −4.121t = −2.023P value .743 .949 .00 .053
Statistical Analysis Location Gastric Body Antrum Cardia Angle Antrum Body Cardia Serosa negative ∗ 6 5 2 1 2.86 ± 0.607 6.44 ± 3.57 7.45 ± 1.70 Serosa positive ∗ 3 7 6 0 3.25 ± 1.077 8.17 ± 3.19 7.49 ± 2.22 Test value_c_ 2 = 4.219t = −1.198t = −1.401t = −0.055P value 0.239 0.241 0.172 0.957
Get Radiology Tree app to read full this article<
Get Radiology Tree app to read full this article<
Results
Get Radiology Tree app to read full this article<
Table 3
Classification Results with Conventional Features ∗
Depth of Invasion Predicted Group Membership Total Mucosa Serosa Conventional features † Count Mucosa 11 3 14 Serosa 2 14 16 % Mucosa 78.57 21.43 100.0 Serosa 12.50 87.50 100.0
Get Radiology Tree app to read full this article<
Get Radiology Tree app to read full this article<
Table 4
Classification Results with Full features ∗
Depth of Invasion Predicted Group Membership Total Mucosa Serosa Conventional features plus quantitative spectral CT features † Count Mucosa 12 2 14 Serosa 1 15 16 % Mucosa 85.71 14.29 100.0 Serosa 6.25 93.75 100.0
Get Radiology Tree app to read full this article<
Get Radiology Tree app to read full this article<
Table 5
Feature Ranking Results
Algorithm Ranking Features (Top 8) The Fisher score Long axis, 80, 70, and 60 keV (lesion portal venous phase), calcium (iodine), iodine (water), Effective-Z The Laplacian score Long axis, age, short axis, 50, 40, and 60 keV, Effective-Z (antrum portal venous phase), calcium (iodine)
Get Radiology Tree app to read full this article<
Get Radiology Tree app to read full this article<
Get Radiology Tree app to read full this article<
Get Radiology Tree app to read full this article<
Get Radiology Tree app to read full this article<
![Figure 5, Classification accuracy versus the number of selected features. (a) The Fisher score ranking method (support vector machine [SVM]) and (b) the Laplacian score ranking method (SVM).](https://storage.googleapis.com/dl.dentistrykey.com/clinical/ComputerAidedDiagnosisforPreoperativeInvasionDepthofGastricCancerwithDualEnergySpectralCTImaging/1_1s20S1076633214003134.jpg)
Get Radiology Tree app to read full this article<
Discussion
Get Radiology Tree app to read full this article<
Get Radiology Tree app to read full this article<
Get Radiology Tree app to read full this article<
Get Radiology Tree app to read full this article<
Get Radiology Tree app to read full this article<
Get Radiology Tree app to read full this article<
Get Radiology Tree app to read full this article<
Get Radiology Tree app to read full this article<
Acknowledgment
Get Radiology Tree app to read full this article<
References
1. Ferro A., Peleteiro B., Malvezzi M., et. al.: Worldwide trends in gastric cancer mortality (1980–2011), with predictions to 2015, and incidence by subtype. Eur J Cancer 2014; 50: pp. 1330-1344.
2. Jemal A., Siegal R., Ward E., et. al.: Cancer facts & figures.2013. Available at: http://www.cancer.org/research/cancerfactsstatistics/cancerfactsfigures2013/ Accessed January 18, 2014
3. Takahashi T., Saikawa Y., Kitagawa Y.: Gastric cancer: current status of diagnosis and treatment. Cancers 2013; 5: pp. 48-63.
4. Seevaratnam R., Cardoso R., Mcgregor C., et. al.: How useful is preoperative imaging for tumor, node, metastasis (TNM) staging of gastric cancer? A meta-analysis. Gastric Cancer 2012; 15: pp. 3-18.
5. Edge S.B., Compton C.C.: The American Joint Committee on Cancer: the 7th edition of the AJCC cancer staging manual and the future of TNM. Ann Surg Oncol 2010; 17: pp. 1471-1474.
6. Zurleni T., Gjoni E., Ballabio A., et. al.: Sixth and seventh tumor-node-metastasis staging system compared in gastric cancer patients. World J Gastrointest Surg 2013; 5: pp. 287-293.
7. Minami M., Kawauchi N., Itai Y., et. al.: Gastric tumors: radiologic-pathologic correlation and accuracy of T staging with dynamic CT. Radiology 1992; 185: pp. 173-178.
8. Halvorsen R.A., Yee J., McCormick V.D.: Diagnosis and staging of gastric cancer. Semin Oncol 1996; 23: pp. 325-335.
9. Furukawa K., Miyahara R., Itoh A., et. al.: Diagnosis of the invasion depth of gastric cancer using MDCT with virtual gastroscopy: comparison with staging with endoscopic ultrasound. Am J Roentgenol 2011; 197: pp. 867-875.
10. Choi J., Kim S., Im J., et. al.: Comparison of endoscopic ultrasonography and conventional endoscopy for prediction of depth of tumor invasion in early gastric cancer. Endoscopy 2010; 42: pp. 705-713.
11. Tsuzuki T., Okada H., Kawahara Y., et. al.: Usefulness and problems of endoscopic ultrasonography in prediction of the depth of tumor invasion in early gastric cancer. Acta Med Okayama 2011; 65: pp. 105-112.
12. Hwang S.W., Lee D.H., Lee S.H., et. al.: Preoperative staging of gastric cancer by endoscopic ultrasonography and multidetector-row computed tomography. J Gastroenterol Hepatol 2010; 25: pp. 512-518.
13. Langan D.: Gemstone spectral imaging: GE white paper.2008.GE HealthcareWaukesha, Wis
14. Chandra N., Langan D.A.: Gemstone Detector: dual energy imaging via fast kVp switching.Johnson T.F.Fink C.Schönberg S.O.Reiser M.F.Dual energy CT in clinical practice.2011.Springer-VerlagBerlin, Germany:
15. Pan Z., Pang L., Ding B., et. al.: Gastric cancer staging with dual energy spectral CT imaging. PloS One 2013; 8: pp. e53651.
16. Doi K.: Computer-aided diagnosis in medical imaging: historical review, current status and future potential. Comput Med Imag Grap 2007; 31: pp. 198-211.
17. Fujita H., Uchiyama Y., Nakagawa T., et. al.: Computer-aided diagnosis: the emerging of three CAD systems induced by Japanese health care needs. Comput Meth Prog Bio 2008; 92: pp. 238-248.
18. Duda R.O., Hart P.E., Stork D.G.: Pattern classification.2012.John Wiley & Sons
19. Gu Q, Li Z, Han J. Generalized fisher score for feature selection. arXiv preprint arXiv:12023725. 2012.
20. He X., Cai D., Niyogi P.: Laplacian score for feature selection. NIPS 2005; pp. 189.
21. Kwee R.M., Kwee T.C.: Imaging in local staging of gastric cancer: a systematic review. J Clin Oncol 2007; 25: pp. 2107-2116.
22. Puli S.R., Reddy J.B.K., Bechtold M.L., et. al.: How good is endoscopic ultrasound for TNM staging of gastric cancers? A meta-analysis and systematic review. World J Gastroenterol 2008; 14: pp. 4011.
23. Choi J., Kim S.G., Im J.P., et. al.: Endoscopic prediction of tumor invasion depth in early gastric cancer. Gastrointest Endosc 2011; 73: pp. 917-927.
24. Yan C., Zhu Z.G., Yan M., et. al.: Value of multidetector-row computed tomography in the preoperative T and N staging of gastric carcinoma: A large-scale Chinese study. J Surg Oncol 2009; 100: pp. 205-214.
25. Motohara T., Semelka R.: MRI in staging of gastric cancer. Abdom Imaging 2002; 27: pp. 376-383.
26. Lei C., Huang L., Wang Y., et. al.: Comparison of MRI and endoscope ultrasound detection in preoperative T/N staging of gastric cancer. Mol Clin Oncol 2013; 1: pp. 699-702.
27. Joo I., Lee J.M., Kim J.H., et. al.: Prospective comparison of 3T MRI with diffusion-weighted imaging and MDCT for the preoperative TNM staging of gastric cancer. J Magn Reason Imaging 2014;
28. Arocena M.G., Barturen A., Bujanda L., et. al.: MRI and endoscopic ultrasonography in the staging of gastric cancer. Rev Esp Enferm Dig 2006; 98: pp. 582.
29. Lim J.S., Yun M.J., Kim M.-J., et. al.: CT and PET in stomach cancer: preoperative staging and monitoring of response to therapy 1. Radiographics 2006; 26: pp. 143-156.
30. Hallinan J., Venkatesh S.K.: Gastric carcinoma: imaging diagnosis, staging and assessment of treatment response. Cancer Imaging 2013; 13: pp. 212-227.
31. South Australian upper gastrointestinal cancer care pathway. In: Department of Health GoSA ed.2010; 140.
32. Moschetta M., Ianora A.A.S., Cazzato F., et. al.: The role of computed tomography in the imaging of gastric carcinoma.2011.
33. He J., Ma X., Wang Q., et. al.: Spectral CT demonstration of the superior mesenteric artery: comparison of monochromatic and polychromatic imaging. Acad Radiol 2013;
34. Matsumoto K., Jinzaki M., Tanami Y., et. al.: Virtual monochromatic spectral imaging with fast kilovoltage switching: improved image quality as compared with that obtained with conventional 120-kVp CT. Radiology 2011; 259: pp. 257-262.
35. Yamada Y., Jinzaki M., Tanami Y., et. al.: Virtual monochromatic spectral imaging for the evaluation of hypovascular hepatic metastases: the optimal monochromatic level with fast kilovoltage switching dual-energy computed tomography. Invest Radiol 2012; 47: pp. 292-298.
36. Lin X.Z., Miao F., Li J.Y., et. al.: High-definition CT Gemstone spectral imaging of the brain: initial results of selecting optimal monochromatic image for beam-hardening artifacts and image noise reduction. J Comput Assist Tomo 2011; 35: pp. 294.
37. Yu L., Leng S., McCollough C.H.: Dual-energy CT–based monochromatic imaging. Am J Roentgenol 2012; 199: pp. S9-S15.
38. Lv P., Lin X.Z., Li J., et. al.: Differentiation of small hepatic hemangioma from small hepatocellular carcinoma: recently introduced spectral CT method. Radiology 2011; 259: pp. 720-729.
39. Li B.: Dual-energy CT with fast-kVp switching and its applications in orthopedics. OMICS J Radiol 2013;
40. Zhang X.F., Lu Q., Wu L.M., et. al.: Quantitative iodine-based material decomposition images with spectral CT imaging for differentiating prostatic carcinoma from benign prostatic hyperplasia. Acad Radiol 2013; 20: pp. 947-956.
41. Lv P., Lin X., Gao J., et. al.: Spectral CT: preliminary studies in the liver cirrhosis. Korean J Radiol 2012; 13: pp. 434-442.
42. Joshi M, Langan D, Sahani D, et al. Effective atomic number accuracy for kidney stone characterization using spectral CT. Proceedings of SPIE Vol. 7622, 76223K (2010)
43. Chan H.-P., Hadjiiski L., Zhou C., et. al.: Computer-aided diagnosis of lung cancer and pulmonary embolism in computed tomography—a review. Acad Radiol 2008; 15: pp. 535-555.