
Rational and Objectives
To develop a computer-aided diagnostic (CAD) scheme for classifying focal liver lesions (FLLs) by use of physicians’ subjective classification of echogenic patterns of FLLs on baseline and contrast-enhanced ultrasonography (US).
Materials and Methods
A total of 137 hepatic lesions in 137 patients were evaluated with B-mode and NC100100 (Sonazoid)-enhanced pulse-inversion US; lesions included 74 hepatocellular carcinomas (HCCs) (23: well-differentiated, 36: moderately differentiated, 15: poorly differentiated HCCs), 33 liver metastases, and 30 liver hemangiomas. Three physicians evaluated single images at B-mode and arterial phases with a cine mode. Physicians were asked to classify each lesion into one of eight B-mode and one of eight enhancement patterns, but did not make a diagnosis. To classify five types of FLLs, we employed a decision tree model with four decision nodes and four artificial neural networks (ANNs). The results of the physicians’ pattern classifications were used successively for four different ANNs in making decisions at each of the decision nodes in the decision tree model.
Results
The classification accuracies for the 137 FLLs were 84.8% for metastasis, 93.3% for hemangioma, and 98.6% for all HCCs. In addition, the classification accuracies for histological differentiation types of HCCs were 65.2% for well-differentiated HCC, 41.7% for moderately differentiated HCC, and 80.0% for poorly differentiated HCC.
Conclusions
This CAD scheme has the potential to improve the diagnostic accuracy of liver lesions. However, the accuracy in the histologic differential diagnosis of HCC based on baseline and contrast-enhanced US is still limited.
In the diagnosis of focal liver lesions (FLLs) including hepatocellular carcinoma (HCC), liver metastases, hemangioma, and focal nodular hyperplasia (FNH), contrast-enhanced computed tomography (CT) and magnetic resonance imaging (MRI) have been employed more commonly than ultrasonography (US). However, the ultrasonographic equipment is less expensive and can be installed easily compared with CT and MRI. Therefore, US may become more popular in the future, especially in the developing countries. In addition, contrast-enhanced US (CEUS) with pulse-inversion (phase-inversion) imaging techniques has been applied for improvement of the diagnostic accuracy of FLLs. Recently, second-generation ultrasonographic contrast agents, such as DMP 115 (Definity; Lantheus Inc., MA) in Canada and BR 1 (SonoVue; Bracco, Milan, Italy) in Europe and China, have been applied in clinical practice. The agent NC100100 (Sonazoid; GE Healthcare, Oslo, Norway) has become clinically available since January 2007, in Japan ahead of other countries. Although the second-generation ultrasonographic contrast agents have not yet been applied in clinical practice for the diagnosis of FLLs in United States, CEUS with these agents are being widely used worldwide.
The problem with US, however, is a disparity in the diagnostic accuracy among institutions. Generally, US strongly depends on subjective aspect of the sonologist, compared to CT and MRI . Although this problem has not been so serious in so-called “high-volume centers,” where US is used routinely for the diagnosis of FLLs, the diagnostic accuracy in an institution where US is performed infrequently can be poorer than that in a “high-volume center.” For reducing this disparity as much as possible, the development of a computer-aided diagnosis (CAD) scheme for the classification of FLLs on CEUS has been attempted .
Get Radiology Tree app to read full this article<
Materials and methods
Patient Population
Get Radiology Tree app to read full this article<
Get Radiology Tree app to read full this article<
Get Radiology Tree app to read full this article<
Get Radiology Tree app to read full this article<
Ultrasonographic Technique
Get Radiology Tree app to read full this article<
Get Radiology Tree app to read full this article<
Observer study for Obtaining Subjective Classifications of Echogenic Patterns
Get Radiology Tree app to read full this article<
Get Radiology Tree app to read full this article<
Get Radiology Tree app to read full this article<
Get Radiology Tree app to read full this article<
Get Radiology Tree app to read full this article<
Computer-aided Diagnostic Scheme for the Classification of FLLs
Get Radiology Tree app to read full this article<
Get Radiology Tree app to read full this article<
Get Radiology Tree app to read full this article<
Get Radiology Tree app to read full this article<
Get Radiology Tree app to read full this article<
Results
Get Radiology Tree app to read full this article<
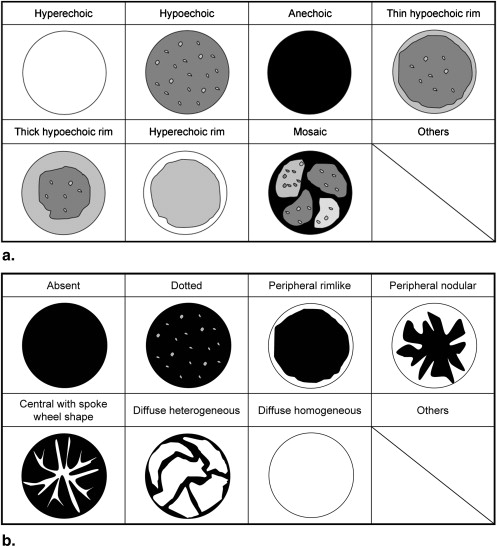
Table 1
The Total Number of Lesions Rated by Three Readers for Subjective Classification of Eight Ultrasonographic Patterns of B-mode Imaging
Classification by Three Readers Lesion Number of Lesions Hyperechoic Hypoechoic Anechoic Thin Hypoechoic Rim Thick Hypoechoic Rim Hyperechoic Rim Mosaic Others HCC 74 18 (8%) 92 (41%) 0 (0%) 50 (23%) 4 (2%) 3 (1%) 44 (20%) 11 (5%) w-HCC 23 2 (3%) 42 (61%) 0 (0%) 9 (13%) 1 (1%) 1 (1%) 11 (16%) 3 (4%) m-HCC 36 11 (10%) 42 (39%) 0 (0%) 29 (27%) 2 (2%) 1 (1%) 17 (16%) 6 (6%) p-HCC 15 5 (11%) 8 (18%) 0 (0%) 12 (27%) 1 (2%) 1 (2%) 16 (36%) 2 (4%) Metastasis 33 16 (14%) 24 (24%) 2 (2%) 5 (5%) 42 (42%) 0 (0%) 3 (3%) 7 (7%) Hemangioma 30 37 (41%) 27 (30%) 0 (0%) 2 (2%) 0 (0%) 22 (24%) 2 (2%) 0 (0%)
Note. Numbers in parentheses are the percentage for the mean number of readers who rated the lesions for each pattern.
m-HCC, moderately differentiated hepatocellular carcinoma; p-HCC, poorly differentiated hepatocellular carcinoma; w-HCC, well-differentiated hepatocellular carcinoma.
Get Radiology Tree app to read full this article<
Get Radiology Tree app to read full this article<
Table 2
The Total Number of Lesions Rated by Three Readers for Subjective Classification of Eight Ultrasonographic Patterns of Contrast Harmonic Imaging
Classification by Three Readers Lesion Number of Lesions Absent Dotted Peripheral Rimlike Peripheral Nodular Central with Spoke Wheel Shape Diffuse Homogeneous Diffuse Heterogeneous Others HCC 74 0 (0%) 0 (0%) 2 (1%) 19 (9%) 0 (0%) 104 (47%) 97 (44%) 0 (0%) w-HCC 23 0 (0%) 0 (0%) 0 (0%) 2 (3%) 0 (0%) 34 (49%) 33 (48%) 0 (0%) m-HCC 36 0 (0%) 0 (0%) 1 (1%) 6 (6%) 0 (0%) 69 (64%) 32 (30%) 0 (0%) p-HCC 15 0 (0%) 0 (0%) 1 (2%) 11 (24%) 0 (0%) 1 (2%) 32 (71%) 0 (0%) Metastasis 33 0 (0%) 0 (0%) 28 (28%) 40 (40%) 2 (2%) 1 (1%) 28 (28%) 0 (0%) Hemangioma 30 0 (0%) 0 (0%) 45 (50%) 43 (48%) 0 (0%) 2 (2%) 0 (0%) 0 (0%)
Note. Numbers in parentheses are the percentage for the mean number of readers who rated the lesions for each pattern.
m-HCC, moderately differentiated hepatocellular carcinoma; p-HCC, poorly differentiated hepatocellular carcinoma; w-HCC, well-differentiated hepatocellular carcinoma.
Get Radiology Tree app to read full this article<
Get Radiology Tree app to read full this article<
Table 3
Performance of CAD Scheme for Classification in Five Categories Using Physicians’ Subjective Pattern Classification
Classification with CAD HCC Lesion Number of Lesions w-HCC m-HCC p-HCC Metastasis Hemangioma HCC 74 w-HCC 23 15 (65.2%) 4 (17.4%) 4 (17.4%) 0 (0.0%) 0 (0.0%) m-HCC 36 16 (44.4%) 15 (41.7%) 5 (13.9%) 0 (0.0% 1 (2.7%) p-HCC 15 1 (6.7%) 1 (6.7%) 12 (80.0%) 1 (6.7%) 0 (0.0%) Metastasis 33 1 (3.0%) 0 (0.0%) 1 (3.0%) 28 (84.8%) 3 (9.1%) Hemangioma 30 0 (0.0%) 0 (0.0%) 1 (3.3%) 1 (3.3%) 28 (93.3%)
CAD, computed-aided diagnosis; m-HCC, moderately differentiated hepatocellular carcinoma; p-HCC, poorly differentiated hepatocellular carcinoma; w-HCC, well-differentiated hepatocellular carcinoma.
Overall diagnostic accuracy: 98/137 (71.5 %).
CAD performance was evaluated by a leave-one-case-out method.
Table 4
Performance of CAD Scheme for Classification in Three Categories Using Physicians’ Subjective Pattern Classification
Classification with CAD Lesion Number of Lesions HCC Metastasis Hemangioma HCC 74 73 (98.6%) 1 (1.4%) 0 (0.0%) Metastasis 33 2 (6.1%) 28 (84.8%) 3 (9.1%) Hemangioma 30 1 (3.3%) 1 (3.3%) 28 (93.3%)
CAD, computed-aided diagnosis; HCC, hepatocellular carcinoma.
Overall diagnostic accuracy: 129/137 (94.2 %).
CAD performance was evaluated by a leave-one-case out method.
Get Radiology Tree app to read full this article<
Get Radiology Tree app to read full this article<
Get Radiology Tree app to read full this article<
Discussion
Get Radiology Tree app to read full this article<
Get Radiology Tree app to read full this article<
Get Radiology Tree app to read full this article<
Get Radiology Tree app to read full this article<
Get Radiology Tree app to read full this article<
Get Radiology Tree app to read full this article<
Get Radiology Tree app to read full this article<
Get Radiology Tree app to read full this article<
Get Radiology Tree app to read full this article<
Get Radiology Tree app to read full this article<
Get Radiology Tree app to read full this article<
Get Radiology Tree app to read full this article<
Get Radiology Tree app to read full this article<
Get Radiology Tree app to read full this article<
Conclusion
Get Radiology Tree app to read full this article<
Acknowledgement
Get Radiology Tree app to read full this article<
References
1. Laghi A., Iannaccone R., Rossi P., et. al.: Hepatocellular carcinoma: detection with triple-phase multi-detector row helical CT in patients with chronic hepatitis. Radiology 2003; 226: pp. 543-549.
2. Martin D.R., Semelka R.C.: Imaging of benign and malignant focal liver lesions. Magn Reson Imaging Clin N Am 2001; 9: pp. 785-802.
3. Hussain S.M., Semelka R.C., Mitchell D.G.: MR imaging of hepatocellular carcinoma. Magn Reson Imaging Clin N Am 2002; 10: pp. 31-52.
4. Yamashita Y., Hatanaka Y., Yamamoto H., et. al.: Differential diagnosis of focal liver lesions: role of spin-echo and contrast-enhanced dynamic MR imaging. Radiology 1994; 193: pp. 59-65.
5. Burns P.N., Wilson S.R., Simpson D.H.: Pulse inversion imaging of liver blood flow: improved method for characterizing focal masses with microbubble contrast. Invest Radiol 2000; 35: pp. 58-71.
6. Harvey C.J., Blomley M.J.K., Eckersley R.J., et. al.: Hepatic malignancies: improved detection with pulse-inversion US in late phase of enhancement with SH U 508A-early experience. Radiology 2000; 216: pp. 903-908.
7. Huang-Wei C., Bleuzen A., Bourlier P., et. al.: Differential diagnosis of focal nodular hyperplasia with quantitative parametric analysis in contrast-enhanced sonography. Invest Radiol 2006; 41: pp. 363-368.
8. Doi K.: Computer status and future potential of computer-aided diagnosis in medical imaging. Br J Radiol 2005; 78: pp. S3-S19.
9. Doi K.: Computer-aided diagnosis in medical imaging: historical review, current status and future potential. Comput Med Imaging Graph 2007; 31: pp. 198-211.
10. International Working Party : Terminology of nodular hepatocellular lesions. Hepatology 1995; 22: pp. 983-993.
11. Couinaud C.: Le foie: etsudes anatomiques et chirurgicales.1957.MassonParis, France 9–12
12. Bismuth H.: Surgical anatomy and anatomical surgery of the liver. World J Surg 1982; 6: pp. 3-8.
13. Itai Y., Ohtomo K., Ohnishi S., et. al.: Ultrasonography of small hepatic tumors. Radiat Med 1987; 5: pp. 14-19.
14. Quaia E., Calliada F., Betolotto M., et. al.: Characterization of focal liver lesions with contrast-specific US modes and a sulfur hexafluoride-filled microbubble contrast agent: diagnostic performance and confidence. Radiology 2004; 232: pp. 420-430.
15. Ashizawa K., MacMahon H., Ishida T., et. al.: Effect of an artificial neural network on radiologists’ performance in the differential diagnosis of interstitial lung disease using chest radiographs. AJR Am J Roentgenol 1999; 172: pp. 1311-1315.
16. Abe H., Ashizawa K., Li F., et. al.: Artificial neural networks (ANNs) for differential diagnosis of interstitial lung disease: results of a simulation test with actual clinical cases. Acad Radiol 2004; 11: pp. 29-37.
17. De Gaetano A.M., Barbaro B., Chiarla C., et. al.: The tissue characterization of focal liver lesions by color Doppler echography. [in Italian] Radiol Med (Torino) 1995; 89: pp. 453-463.
18. Snow J.H., Goldstein H.M., Wallace S.: Comparison of scintigraphy, sonography, and computed tomography in the evaluation of hepatic neoplasma. AJR Am J Roentgenol 1979; 132: pp. 915-918.
19. Becker-Gaab C., zur Nieden J., Sauer U., et. al.: Sonographic diagnosis of liver tumors: results of comparative studies of ultrasound, computerized tomography, laparoscopy, biopsy and scintigraphy in 413 patients. [in German] Digitale Bilddiagn 1987; 7: pp. 35-42.
20. Noone T.C., Semelka R.C., Chaney D.M., et. al.: Abdominal imaging studies: comparison of diagnostic accuracies resulting from ultrasound, computed tomography, and magnetic resonance imaging in the same individual. Magn Reson Imaging 2004; 22: pp. 19-24.
21. Vlachos L., Trakadas S., Gouliamos A., et. al.: Comparative study between ultrasound, computed tomography, intra-arterial digital subtraction angiography, and magnetic resonance imaging in the differentiation of tumors of the liver. Gastrointest Radiol 1990; 15: pp. 102-106.
22. Wilson S.R., Burns P.N.: An algorithm for the diagnosis of focal liver masses using microbubble contrast-enhanced pulse-inversion sonography. AJR Am J Roentgenol 2006; 186: pp. 1401-1412.
23. Jang H.J., Kim T.K., Burns P.N., et. al.: Enhancement patterns of hepatocellular carcinoma at contrast-enhanced US: comparison with histologic differentiation. Radiology 2007; 244: pp. 898-906.
24. Makuuchi M., Hasegawa H., Yamazaki S., et. al.: Ultrasonographic features of hepatocellular carcinoma under 5 cm in diameter: mosaic pattern of internal echo and posterior echo enhancement. [in Japanese] Acta Hepatol 1981; 22: pp. 1740.
25. Shinagawa T., Ohto M., Kimura K., et. al.: Diagnosis and clinical features of small hepatocellular carcinoma with emphasis on the utility of real-time ultrasonography. A study of 51 patients. Gastroenterology 1984; 86: pp. 495-502.
26. Sugimoto K., Moriyasu F., Kamiyama N., et. al.: Analysis of morphological vascular changes of hepatocellular carcinoma by micro flow imaging using contrast-enhanced sonography. Hepatol Res 2008; 38: pp. 790-799.
27. Shiraishi J., Sugimoto K., Moriyasu F., et. al.: Computer-aided diagnosis for the classification of focal liver lesions by use of contrast-enhanced ultrasonography. Med Phys 2008; 235: pp. 1734-1746.
28. Kim T.K., Jang H.J., Burns P.N., et. al.: Focal nodular hyperplasia and hepatic adenoma: differentiation with low-mechanical-index contrast-enhanced sonography. AJR Am J Roentgenol 2008; 190: pp. 58-66.