
Rationale and Objectives
The aim of this study was to evaluate the effect of computer-aided diagnosis (CAD) on radiologists’ estimates of the likelihood of malignancy of lung nodules on computed tomographic (CT) imaging.
Methods and Materials
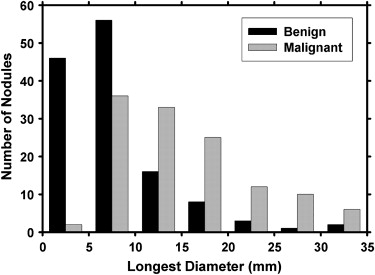
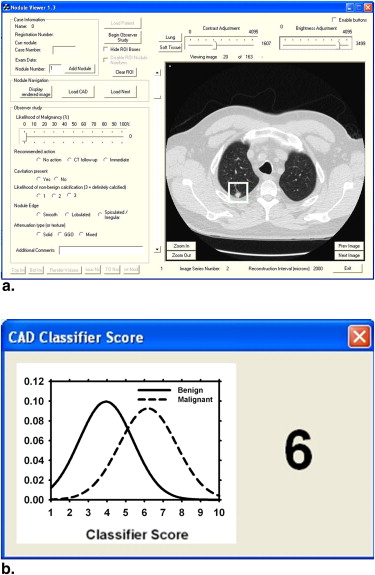
A total of 256 lung nodules (124 malignant, 132 benign) were retrospectively collected from the thoracic CT scans of 152 patients. An automated CAD system was developed to characterize and provide malignancy ratings for lung nodules on CT volumetric images. An observer study was conducted using receiver-operating characteristic analysis to evaluate the effect of CAD on radiologists’ characterization of lung nodules. Six fellowship-trained thoracic radiologists served as readers. The readers rated the likelihood of malignancy on a scale of 0% to 100% and recommended appropriate action first without CAD and then with CAD. The observer ratings were analyzed using the Dorfman-Berbaum-Metz multireader, multicase method.
Results
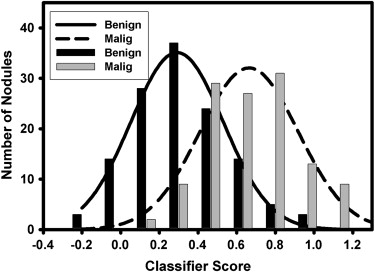
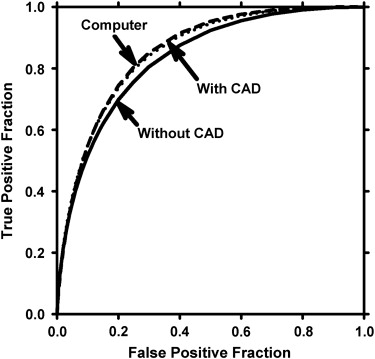
The CAD system achieved a test area under the receiver-operating characteristic curve ( A z ) of 0.857 ± 0.023 using the perimeter, two nodule radii measures, two texture features, and two gradient field features. All six radiologists obtained improved performance with CAD. The average A z of the radiologists improved significantly ( P < .01) from 0.833 (range, 0.817–0.847) to 0.853 (range, 0.834–0.887).
Conclusion
CAD has the potential to increase radiologists’ accuracy in assessing the likelihood of malignancy of lung nodules on CT imaging.
The use of computed tomographic (CT) imaging for lung cancer screening is an area of active research. CT imaging has been shown to be more sensitive for lung nodule detection than chest x-ray, especially for smaller nodules . Henschke et al reported a 92% survival rate among patients who underwent surgical resection for detected stage I lung cancers. Sobue et al reported an almost 100% 5-year survival rate for patients with nodules < 9 mm in size. These data suggest the benefits of earlier intervention with early detection. It is expected that the National Lung Screening Trial , which is a randomized, controlled study of >50,000 enrolled patients, will provide more definitive results as to whether early detection with CT imaging compared to CXR will lead to reduced patient mortality.
The higher sensitivity of CT imaging results in an increase in the number of nodules detected and thus an increase in the nodules that need to be followed up and managed. This may require expensive diagnostic tests such as follow-up CT scans and biopsies. Multiple–detector row CT technology has resulted in thinner slices and higher resolution. However, the large number of images that radiologists must interpret greatly increases their workload. Despite higher quality images, Swensen et al reported that as many as 50% of nodules resected at surgery are benign, signifying the difficulty radiologists have in determining whether a lung nodule is malignant or not on the basis of CT and other clinical information. This emphasizes the importance of developing methods that can assist radiologists in characterizing nodules.
Get Radiology Tree app to read full this article<
Get Radiology Tree app to read full this article<
Methods and materials
Collection of CT Studies
Get Radiology Tree app to read full this article<
Nodule Selection
Get Radiology Tree app to read full this article<
Get Radiology Tree app to read full this article<
Get Radiology Tree app to read full this article<
Get Radiology Tree app to read full this article<
CAD System
Get Radiology Tree app to read full this article<
Get Radiology Tree app to read full this article<
Get Radiology Tree app to read full this article<
Get Radiology Tree app to read full this article<
Observer Study
Get Radiology Tree app to read full this article<
Get Radiology Tree app to read full this article<
Get Radiology Tree app to read full this article<
Get Radiology Tree app to read full this article<
Get Radiology Tree app to read full this article<
Get Radiology Tree app to read full this article<
Get Radiology Tree app to read full this article<
Statistical Analysis
Get Radiology Tree app to read full this article<
Get Radiology Tree app to read full this article<
Get Radiology Tree app to read full this article<
Results
Get Radiology Tree app to read full this article<
Get Radiology Tree app to read full this article<
Table 1
Individual and Average Performance of the Observers in Terms of A z without and with CAD
Observer_A_ z without CAD_A_ z with CAD 1 0.817 ± 0.026 0.846 ± 0.024 2 0.845 ± 0.025 0.857 ± 0.024 3 0.843 ± 0.024 0.847 ± 0.024 4 0.829 ± 0.025 0.853 ± 0.023 5 0.847 ± 0.024 0.877 ± 0.021 6 0.817 ± 0.026 0.834 ± 0.025 Average ∗ 0.833 0.854
A z , area under the receiver-operating characteristic curve; CAD, computer-aided diagnosis.
Get Radiology Tree app to read full this article<
Get Radiology Tree app to read full this article<
Get Radiology Tree app to read full this article<
Table 2
The Number of Times on Average That Observers Changed Their LM Estimates and Recommended Actions with CAD
LM Change Action Change Total 126 ± 46.8 (49 ± 17%) 10.8 ± 5.8 Correct 95 ± 34.0 (37 ± 13%) 6.8 ± 2.5 (3 ± 1%) Incorrect 31 ± 18.2 (12 ± 7%) 4 ± 3.6 (2 ± 1%)
CAD, computer-aided diagnosis; LM, likelihood of malignancy.
Values in parentheses are percentages relative to the total number of nodules.
Get Radiology Tree app to read full this article<
Get Radiology Tree app to read full this article<
Get Radiology Tree app to read full this article<
Get Radiology Tree app to read full this article<
Table 3
Average Performance of the Observers in Terms of A z and A0.9z A
z
0.9 for the Entire Data Set, the Primary and Metastatic Subsets, and the Data Set Excluding the Eight Masses > 30mm in Diameter
Average A z Average A0.9z A
z
0.9 Data Set Without CAD With CAD Without CAD With CAD All 256 nodules 0.833 0.853 0.390 0.456 Primary cancers 0.823 0.846 0.338 0.415 Metastatic cancers 0.849 0.861 0.493 0.535 Excluding masses > 30 mm in diameter 0.832 0.850 0.392 0.455
A z , area under the receiver-operating characteristic curve; A0.9z A
z
0.9 , partial A z (the area under the receiver-operating characteristic curve above a true-positive fraction value of 0.9) CAD, computer-aided diagnosis.
All improvements with CAD were statistically significant ( P < .05), except for the metastatic cancer subset ( P = .06).
Get Radiology Tree app to read full this article<
Get Radiology Tree app to read full this article<
Get Radiology Tree app to read full this article<
Get Radiology Tree app to read full this article<
Get Radiology Tree app to read full this article<
Discussion
Get Radiology Tree app to read full this article<
Get Radiology Tree app to read full this article<
Get Radiology Tree app to read full this article<
Get Radiology Tree app to read full this article<
Get Radiology Tree app to read full this article<
Get Radiology Tree app to read full this article<
Get Radiology Tree app to read full this article<
Get Radiology Tree app to read full this article<
Get Radiology Tree app to read full this article<
Get Radiology Tree app to read full this article<
Get Radiology Tree app to read full this article<
Get Radiology Tree app to read full this article<
Get Radiology Tree app to read full this article<
Get Radiology Tree app to read full this article<
Acknowledgment
Get Radiology Tree app to read full this article<
Get Radiology Tree app to read full this article<
References
1. Sone S., Takashima S., Li F., et. al.: Mass screening for lung cancer with mobile spiral computed tomography scanner. Lancet 1998; 351: pp. 1242-1245.
2. Henschke C.I., McCauley D.I., Yankelevitz D.F., et. al.: Early lung cancer action project: overall design and findings from baseline screening. Lancet 1999; 354: pp. 99-105.
3. Nawa T., Nakagawa T., Kusano S., et. al.: Lung cancer screening using low-dose spiral CT: results of baseline and 1-year follow-up studies. Chest 2002; 122: pp. 15-20.
4. Diederich S., Wormanns D., Semik M., et. al.: Screening for early lung cancer with low-dose spiral CT: Prevalence in 817 asymptomatic smokers. Radiology 2002; 222: pp. 773-781.
5. Henschke C.I., Yankelevitz D.F., Libby D.M., et. al.: Survival of patients with stage I lung cancer detected on CT screening. N Engl J Med 2006; 355: pp. 1763-1771.
6. Sobue T., Moriyama N., Kaneko M., et. al.: Screening for lung cancer with low-dose helical computed tomography: anti-lung cancer association project. J Clin Oncol 2002; 20: pp. 911-920.
7. Gierada D.S., Pilgram T.K., Ford M., et. al.: Lung cancer: interobserver agreement on interpretation of pulmonary findings at low-dose CT screening. Radiology 2008; 246: pp. 265-272.
8. Swensen S.J., Jett J.R., Hartman T.E., et. al.: Lung cancer screening with CT: Mayo Clinic experience. Radiology 2003; 226: pp. 756-761.
9. Das M., Muhlenbruch G., Mahnken A.H., et. al.: Small pulmonary nodules: Effect of two computer-aided detection systems on radiologist performance. Radiology 2006; 241: pp. 564-571.
10. Brown M.S., Goldin J.G., Rogers S., et. al.: Computer-aided lung nodule detection in CT results of large-scale observer test. Acad Radiol 2005; 12: pp. 681-686.
11. Awai K., Murao K., Ozawa A., et. al.: Pulmonary nodules at chest CT: effect of computer-aided diagnosis on radiologists’ detection performance. Radiology 2004; 230: pp. 347-352.
12. Armato S., Li F., Giger M., et. al.: Lung cancer: performance of automated lung nodule detection applied to cancers missed in a CT screening program. Radiology 2002; 225: pp. 685-692.
13. Li F., Arimura H., Suzuki K., et. al.: Computer-aided detection of peripheral lung cancers missed at CT: ROC analyses without and with localization. Radiology 2005; 237: pp. 684-690.
14. Sahiner B., Hadjiiski L.M., Chan H.P., et. al.: The effect of nodule segmentation on the accuracy of computerized lung nodule detection on CT scans: comparison on a data set annotated by multiple radiologists. Proc SPIE 2007; 6514: pp. 65140L-65141L. 65147
15. Way T.W., Hadjiiski L.M., Sahiner B., et. al.: Computer-aided diagnosis of pulmonary nodules on CT scans: segmentation and classification using 3D active contours. Med Phys 2006; 33: pp. 2323-2337.
16. Shah S.K., McNitt-Gray M.F., Rogers S.R., et. al.: Computer-aided diagnosis of the solitary pulmonary nodule. Acad Radiol 2005; 12: pp. 570-575.
17. McNitt-Gray M.F., Hart E.M., Wyckoff N., Sayre J.W., Goldin J.G., Aberle D.R.: A pattern classification approach to characterizing solitary pulmonary nodules imaged on high resolution CT: preliminary results. Med Phys 1999; 26: pp. 880-888.
18. Armato S.G., Altman M.B., Wilkie J.: Automated lung nodule classification following automated nodule detection on CT: a serial approach. Med Phys 2003; 30: pp. 1188-1197.
19. Kawata Y., Niki N., Ohmatsu H., et. al.: Quantitative surface characterization of pulmonary nodules based on thin-section CT images. IEEE Trans Nucl Sci 1998; 45: pp. 2132-2138.
20. Lo S.C.B., Hsu L.Y., Freedman M.T., et. al.: Classification of lung nodules in diagnostic CT: an approach based on 3-D vascular features, nodule density distributions, and shape features. Proc SPIE 2003; 5032: pp. 183-189.
21. Li F., Aoyama M., Shiraishi J., et. al.: Radiologists’ performance for differentiating benign from malignant lung nodules on high-resolution CT using computer-estimated likelihood of malignancy. AJR Am J Roentgenol 2004; 183: pp. 1209-1215.
22. Aoyama M., Li Q., Katsuragawa S., et. al.: Computerized scheme for determination of the likelihood measure of malignancy for pulmonary nodules on low-dose CT images. Med Phys 2003; 30: pp. 387-394.
23. Suzuki K., Li F., Sone S., Doi K.: Computer-aided diagnostic scheme for distinction between benign and malignant nodules in thoracic low-dose CT by use of massive training artificial neural network. IEEE Trans Med Imaging 2005; 24: pp. 1138-1150.
24. Matsuki Y., Nakamura K., Watanabe H., et. al.: Usefulness of an artificial neural network for differentiating benign from malignant pulmonary nodules on high-resolution CT: evaluation with receiver operating characteristic analysis. AJR Am J Roentgenol 2002; 178: pp. 657-663.
25. Shah S.K., McNitt-Gray M.F., De Zoysa K.R., et. al.: Solitary pulmonary nodule diagnosis on CT results of an observer study. Acad Radiol 2005; 12: pp. 496-501.
26. Li F., Li Q., Engelmann R., et. al.: Improving radiologists’ recommendations with computer-aided diagnosis for management of small nodules detected by CT. Acad Radiol 2006; 13: pp. 943-950.
27. Awai K., Murao K., Ozawa A., et. al.: Pulmonary nodules: Estimation of malignancy at thin-section helical CT—effect of computer-aided diagnosis on performance of radiologists. Radiology 2006; 239: pp. 276-284.
28. Way T.W., Sahiner B., Chan H.-P., et. al.: Computer aided diagnosis of pulmonary nodules on CT scans: improvement of classification performance with nodule surface features. Med Phys 2009; 36: pp. 3086-3098.
29. Sahiner B., Chan H.P., Petrick N., et. al.: Computerized characterization of masses on mammograms: the rubber band straightening transform and texture analysis. Med Phys 1998; 25: pp. 516-526.
30. Galloway M.M.: Texture classification using gray level run lengths. Comput Graph Image Process 1975; 4: pp. 172-179.
31. Dasarathy B.R., Holder E.B.: Image characterizations based on joint gray-level run-length distributions. Patt Recog Lett 1991; 12: pp. 497-502.
32. Ge Z., Sahiner B., Chan H.P., et. al.: Computer aided detection of lung nodules: false positive reduction using a 3D gradient field method and 3D ellipsoid fitting. Med Phys 2005; 32: pp. 2443-2454.
33. Metz C.E.: Some practical issues of experimental design and data analysis in radiological ROC studies. Invest Radiol 1989; 24: pp. 234-245.
34. Dorfman D.D., Berbaum K.S., Metz C.E.: ROC rating analysis: generalization to the population of readers and cases with the jackknife method. Invest Radiol 1992; 27: pp. 723-731.
35. Jiang Y., Metz C.E., Nishikawa R.M.: A receiver operating characteristic partial area index for highly sensitive diagnostic tests. Radiology 1996; 201: pp. 745-750.
36. Sahiner B., Chan H.P., Petrick N., et. al.: Design of a high-sensitivity classifier based on a genetic algorithm: application to computer-aided diagnosis. Phys Med Biol 1998; 43: pp. 2853-2871.
37. Obuchowski N.: Nonparametric analysis of clustered ROC curve data. Biometrics 1997; 53: pp. 567-578.
38. Lee M.-L.T., Rosner B.A.: The average area under correlated receiver operating characteristic curves: a nonparametric approach based on generalized two-sample Wilcoxon statistics. J R Stat Soc Ser C Appl Stat 2001; 50: pp. 337-344.
39. Hadjiiski L.M., Chan H.P., Sahiner B., et. al.: Breast masses: computer-aided diagnosis with serial mammograms. Radiology 2006; 240: pp. 343-356.
40. Li Q., Li F., Shiraishi J., Katsuragawa S., et. al.: Investigation of new psychophysical measures for evaluation of similar images on thoracic computed tomography for distinction between benign and malignant nodules. Med Phys 2003; 30: pp. 2584-2593.
41. Gurney J.W.: Determining the likelihood of malignancy in solitary pulmonary nodules with Bayesian analysis—part I. Theory. Radiology 1993; 186: pp. 405-413.
42. Bogot N.R., Kazerooni E.A., Kelly A.M., et. al.: Interobserver and intraobserver variability in the assessment of pulmonary nodule size on CT using film and computer display methods. Acad Radiol 2005; 12: pp. 948-956.
43. Meyer C.R., Johnson T.D., McLennan G., et. al.: Evaluation of lung MDCT nodule annotation across radiologists and methods. Acad Radiol 2006; 13: pp. 1254-1265.
44. Jiang Y., Nishikawa R.M., Schmidt R.A., et. al.: Potential of computer-aided diagnosis to reduce variability in radiologists’ interpretations of mammograms depicting microcalcifications. Radiology 2001; 220: pp. 787-794.
45. Gur D., Bandos A.I., Cohen C.S., et. al.: The “laboratory” effect: comparing radiologists’ performance and variability during prospective clinical and laboratory mammography interpretations. Radiology 2008; 249: pp. 47-53.