
Rationale and Objectives
The purpose of this study was to develop and test a computer-assisted detection method for the identification and measurement of pulmonary abnormalities on chest computed tomographic (CT) imaging in cases of infection, such as novel H1N1 influenza. The method developed could be a potentially useful tool for classifying and quantifying pulmonary infectious disease on CT imaging.
Materials and Methods
Forty chest CT examinations were studied using texture analysis and support vector machine classification to differentiate normal from abnormal lung regions on CT imaging, including 10 patients with immunohistochemistry-proven infection, 10 normal controls, and 20 patients with fibrosis.
Results
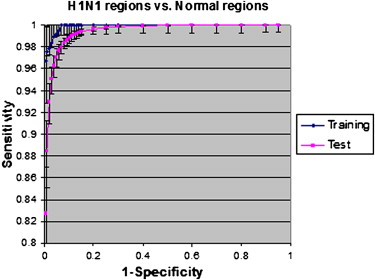
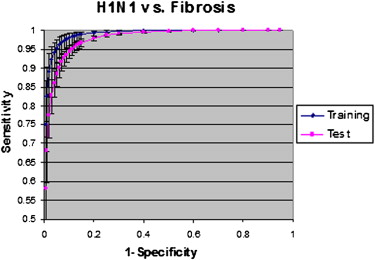
Statistically significant differences in the receiver-operating characteristic curves for detecting abnormal regions in H1N1 infection were obtained between normal lung and regions of fibrosis, with significant differences in texture features of different infections. These differences enabled the quantification of abnormal lung volumes on CT imaging.
Conclusion
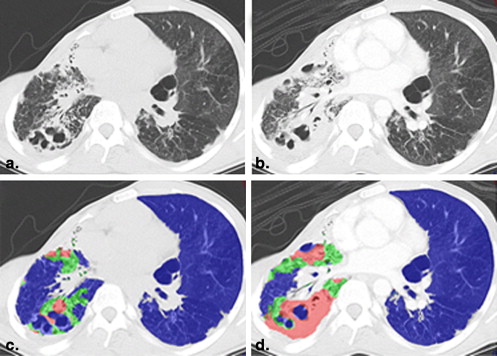
Texture analysis and support vector machine classification can distinguish between areas of abnormality in acute infection and areas of chronic fibrosis, differentiate lesions having consolidative and ground-glass appearances, and quantify those texture features to increase the precision of CT scoring as a potential tool for measuring disease progression and severity.
In trying to increase the clinical utility of infectious disease imaging, researchers currently face several challenges, including the relatively low specificity for diagnosing pathogens and the limited quantification of disease burden for assessing severity and predicting outcomes. The low specificity of infectious disease imaging stems from the similarity between visual appearances of infectious and inflammatory diseases . The second major challenge, the quantification of severity through radiologic techniques, requires standardized methods for measuring lesions and translating those measurements into validated clinical implications. A third unsolved problem is that the detection of subtle pulmonary parenchymal changes may not be visually apparent, and traditional visual scoring methods for pulmonary disease on computed tomographic (CT) imaging are often limited by interobserver biases and lack of validation. These limitations came to light during the outbreak of novel swine-origin influenza A/H1N1 in 2009 and 2010 . Reports indicated that severe infection with novel H1N1 demonstrate patchy ground-glass opacities with consolidations on thoracic CT scans . Unfortunately, this visual appearance is so similar to other infectious and inflammatory etiologies that it is difficult to unequivocally diagnose H1N1 on the basis of CT findings alone . Although most cases of H1N1 were predominately mild in severity, with a mortality of <1%, the severe cases often rapidly led to respiratory impairment and death, and it was clinically and radiologically challenging to prognosticate and identify these severe cases for earlier treatment .
In this report, we present a pilot method for detecting and quantifying H1N1 pulmonary infection using computer-assisted texture analysis and support vector machines (SVMs). To our knowledge, H1N1 pulmonary infection and associated inflammation have not been characterized using texture analysis to date. Simply defined, texture analysis quantifies an image by identifying statistical relationships among the pixels’ densities, which can be used to identify lesions and quantify the volume of an organ manifesting those patterns associated with lesions. It has been established that specific tissues and even specific pathologies yield unique texture patterns on chest CT images. Therefore, these textures could be important attributes for characterizing and distinguishing objects, lesions, and regions .
Get Radiology Tree app to read full this article<
Get Radiology Tree app to read full this article<
Materials and methods
Data Sets
Get Radiology Tree app to read full this article<
Table 1
Summary of Patient Population
Cohort Number of Patients (Male/Female) Age (y), Range (Mean ± SD) H1N1 4 (3/1) 31–59 (50 ± 13) Fibrosis 20 (11/9) 30–79 (55 ± 12) Normal 10 (4/6) 38–75 (53 ± 12) Infection other than H1N1 Pneumonia 3 (3/0) 17–44 (33 ± 14) Parainfluenza 2 (1/1) 59–60 MAC 1 (1/0) 82 All 40 (17/23) 17–82 (53 ± 14)
MAC, mycobacterium avium complex; SD, standard deviation.
Get Radiology Tree app to read full this article<
Method Overview
Get Radiology Tree app to read full this article<
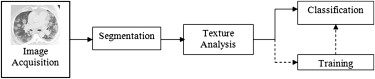
Get Radiology Tree app to read full this article<
Lung Segmentation
Get Radiology Tree app to read full this article<
Texture Analysis
Get Radiology Tree app to read full this article<
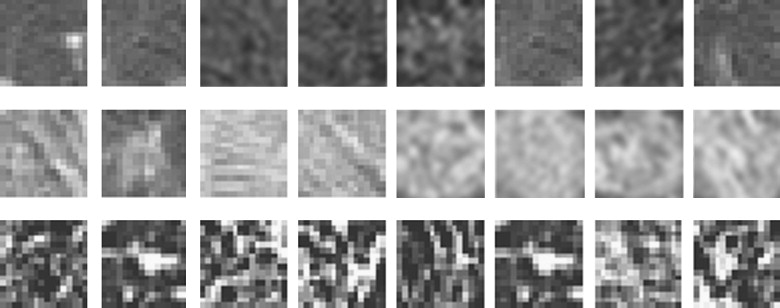
Get Radiology Tree app to read full this article<
Get Radiology Tree app to read full this article<
Table 2
List of Texture Features
Histogram Statistics Co-occurrence Matrix Run-length Matrix Mean Energy Long run emphasis Skewness Inertia difference Run length non-uniformity Deviation Correlation Low gray-level run emphasis Variance Average difference Short run low gray-level emphasis Kurtosis Entropy difference Long run low gray-level emphasis Inertia Short run high gray-level emphasis Entropy Long run high gray-level emphasis Average sum Short run emphasis Run gray-level non-uniformity Run percentage
Get Radiology Tree app to read full this article<
Training and SVMs
Get Radiology Tree app to read full this article<
Get Radiology Tree app to read full this article<
Get Radiology Tree app to read full this article<
Get Radiology Tree app to read full this article<
Pixelwise Classification
Get Radiology Tree app to read full this article<
Get Radiology Tree app to read full this article<
Statistical Analysis
Get Radiology Tree app to read full this article<
Results
Get Radiology Tree app to read full this article<
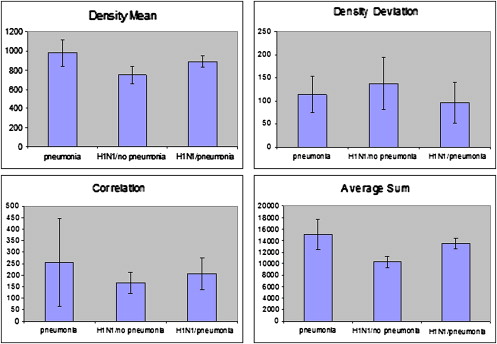
![Figure 3, Comparison of six texture features for seven classes of patterns. Descriptive statistics (mean and standard deviation of texture values) are plotted for six texture features (density mean, density deviation, correlation, average sum, gray-level nonuniformity, and high gray-level run emphasis). Seven different texture patterns (H1N1, fibrosis, mycobacterium avium complex [MAC], parainfluenza, normal, and normal in H1N1) are compared. The features show statistically significant difference ( P < .001) between abnormal H1N1 region and fibrosis and between H1N1 region and normal lung regions.](https://storage.googleapis.com/dl.dentistrykey.com/clinical/ComputeraidedDiagnosisofPulmonaryInfectionsUsingTextureAnalysisandSupportVectorMachineClassification/2_1s20S1076633210006355.jpg)
Get Radiology Tree app to read full this article<
Get Radiology Tree app to read full this article<
Get Radiology Tree app to read full this article<
Get Radiology Tree app to read full this article<
Get Radiology Tree app to read full this article<
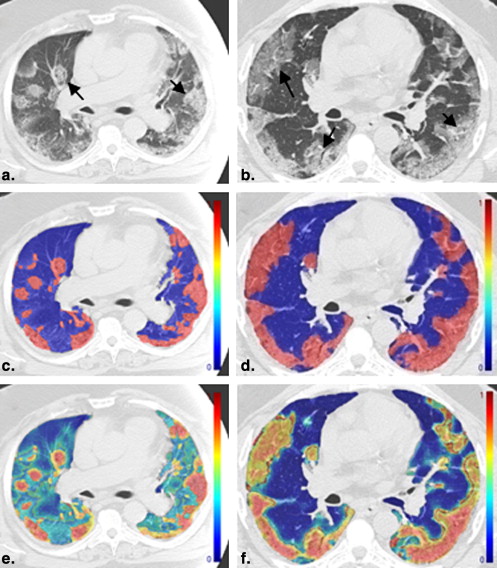
Table 3
Pixelwise Classification of Four Patients with H1N1
Patient Right Lung Volume (cm 3 ) Right Lung Abnormal Volume (cm 3 ) Left Lung Volume (cm 3 ) Left Lung Abnormal Volume (cm 3 ) Total Lung Volume (cm 3 ) Total Lung Abnormal Volume (cm 3 ) Right Lung Ratio Left Lung Ratio Total Lung Ratio 1 1617 1210 1662 262 3278 1472 0.75 0.16 0.45 2 1125 739 1211 195 2336 934 0.66 0.16 0.40 3 1809 623 1814 638 3624 1261 0.34 0.35 0.35 4 1659 405 1478 625 3138 1030 0.24 0.42 0.33
Get Radiology Tree app to read full this article<
Get Radiology Tree app to read full this article<
Get Radiology Tree app to read full this article<
Get Radiology Tree app to read full this article<
Get Radiology Tree app to read full this article<
Get Radiology Tree app to read full this article<
Discussion
Get Radiology Tree app to read full this article<
Get Radiology Tree app to read full this article<
Get Radiology Tree app to read full this article<
Get Radiology Tree app to read full this article<
Get Radiology Tree app to read full this article<
Future Work
Get Radiology Tree app to read full this article<
Get Radiology Tree app to read full this article<
Get Radiology Tree app to read full this article<
Get Radiology Tree app to read full this article<
Conclusions
Get Radiology Tree app to read full this article<
Acknowledgments
Get Radiology Tree app to read full this article<
Get Radiology Tree app to read full this article<
References
1. Kim E.A., Lee K.S., Primack S.L., et. al.: Viral pneumonias in adults: radiologic and pathologic findings. Radiographics 2002; 22: pp. S137-S149.
2. Mollura D., Asnis E., Conetta R.: Imaging findings in a fatal case of pandemic swine-origin influenza A (H1N1). AJR Am J Roentgenol 2009; 193: pp. 1500-1503.
3. Agarwal P., Cinti S., Kazerooni E.: Chest radiographic and CT findings in novel swine-origin influenza A (H1N1) virus (S-OIV) infection. AJR Am J Roentgenol 2009; 193: pp. 1488-1493.
4. Ajlan A.M., Quiney B., Nicolaou S., et. al.: Swine-origin influenza A (H1N1) viral infection: radiographic and CT findings. AJR Am J Roentgenol 2009; 193: pp. 1494-1499.
5. Chabat F., Yang G.-Z., Hansell D.: Obstructive lung diseases: texture classification for differentiation at CT. Radiology 2003; 228: pp. 871-877.
6. Barequet G., Shapiro D., Tal A.: Multilevel sensitive reconstruction of polyhedral surfaces from parallel slices. Vis Comput 2000; 16: pp. 116-133.
7. Yao J, Avila N, Dwyer A, et al. Computer-aided grading of lymphangioleiomyomatosis (LAM) using HRCT. Presented at: International Conference of Pattern Recognition; Tampa, FL; 2008.
8. Sluimer I., Schilham A., Prokop M., et. al.: Computer analysis of computed tomography scans of the lung: a survey. IEEE Trans Med Imaging 2006; 25: pp. 385-405.
9. van Rikxoort E.M., de Hoop B., van de Vorst S., et. al.: Automatic segmentation of pulmonary segments from volumetric chest CT scans. IEEE Trans Med Imaging 2009; 28: pp. 621-630.
10. Uppaluri R., Hoffman E.A., Sonka M., et. al.: Computer recognition of regional lung disease patterns. Am J Respir Crit Care Med 1999; 160: pp. 648-654.
11. Zavaletta VA, Bartholmai BJ, Robb RA. 3D morphological analysis of lung pathology. Presented at: IEEE International Symposium on Biomedical Imaging; Arlington, VA; 2007.
12. Caban J, Yao J, Avila NA, et al. Texture-based computer-aided diagnosis system for lung fibrosis. Presented at: SPIE Medical Imaging (CAD); San Diego, CA; 2007.
13. Lee Y, Seo JB, Bokyoung K, et al. Performance comparison of classifiers for differentiation among obstructive lung diseases based on features of texture analysis at HRCT. In: SPIE Medical Imaging: Image Processing. San Diego, CA, 2007. Available at: http://spie.org/x648.html?product_id=710394 .
14. Cristianini N., Taylor J.S.: An introduction to support vector machines.2000.Cambridge University PressCambridge, UK
15. Yao J., Summers R.M., Hara A.K.: Optimizing the support vector machines (SVM) committee configuration in colonic polyp CAD system. Presented at2005.SPIE Medical ImagingSan Diego, CA
16. Metz C., Herman B., Roe C.: Statistical comparison of two ROC curve estimates obtained from partially-paired datasets. Med Decis Making 1998; 18: pp. 110-121.
17. Morens D.M., Taubenberger J.K., Fauci A.S.: Predominant role of bacterial pneumonia as a cause of death in pandemic influenza: implications for pandemic influenza preparedness. J Infect Dis 2008; 198: pp. 962-970.
18. Mueller-Mang C., Grosse C., Schmid K., et. al.: What every radiologist should know about idiopathic interstitial pneumonias. Radiographics 2007; 27: pp. 595-615.
19. Sumikawa H., Johkoh T., Ichikado K., et. al.: Usual interstitial pneumonia and chronic idiopathic interstitial pneumonia: analysis of CT appearance in 92 patients. Radiology 2006; 241: pp. 258-266.
20. van den Brand J., Stittelaar K.J., van Amerongen G., et. al.: Severity of pneumonia due to new H1N1 influenza virus in ferrets is intermediate between that due to seasonal H1N1 virus and highly pathogenic avian influenza H5N1 virus. J Infect Dis 2010; 201: pp. 993-999.
21. Martinez S., McAdams H.P., Batchu C.S.: The many faces of pulmonary nontuberculous mycobacterial infection. AJR Am J Roentgenol 2007; 189: pp. 177-186.