
Rationale and Objectives
The aim of this study was to develop a computer-aided diagnosis (CAD) system in assessing the sonographic morphologic and texture features of soft-tissue tumors.
Materials and Methods
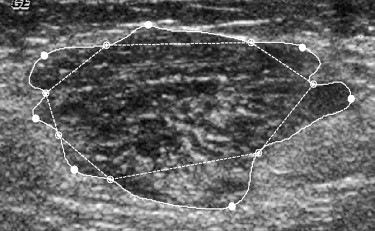
The retrospective study involved 114 pathology proven cases including 73 benign and 41 malignant soft-tissue tumors. The tumor regions were delineated by an experienced radiologist who was unknown to the pathologic result. Then, we applied 10 morphologic features and 6 gray-level co-occurrence matrix texture features to analyze the tumor regions. To classify the tumors as benign or malignant, we used two methods, a linear discriminant analysis with stepwise feature selection and a multilayer neural network with the back-propagation algorithm as classifiers. The classification performances are evaluated by the area A z under the receiver operating characteristic. Furthermore, four radiologists provided malignancy grades for all tumors in the comparison of the CAD system.
Results
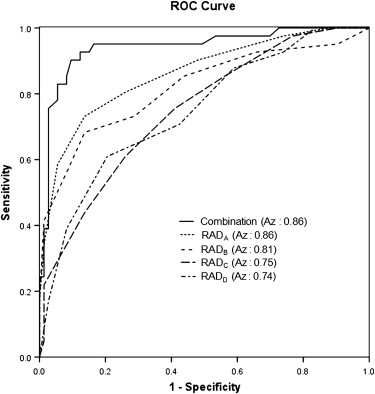
In this analysis, the CAD system based on the combination of morphologic and texture feature sets can give the optimal CAD result by LDA with an accuracy of 89.5%, a sensitivity of 90.2%, a specificity of 89.0%, a positive predictive value (PPV) of 82.2%, negative predictive value (NPV) of 94.2%, and A z value of 0.96, and by the multilayer perception with an accuracy of 88.6%, a sensitivity of 90.2%, a specificity of 87.5%, a positive predictive value of 80.4%, negative predictive value of 94.2%, and A z value of 0.95. The A z values of the four radiologists were ranged between 0.74 and 0.86, and the optimal CAD results were shown the highest A z values than the four radiologists’ rankings.
Conclusions
This study has shown that performing the CAD system with both morphologic and texture features on sonography, can successfully distinguish between benign and malignant soft-tissue tumors. Moreover, it can also provide a second opinion for the tumor diagnosis and avert unnecessary biopsy.
Soft-tissue tumors, which can arise anywhere in the body, occur in the extremities about two-thirds of the time and the other one-third of the time in the trunk, retroperitoneum, abdomen, or other locations . Malignant soft-tissue tumors, which have more than 50 histologic subtypes, constitute less than 1% of all cancers. Moreover, the overall survival of malignant soft-tissue tumors is about 50% at 5 years . The high death rate may be due to the lack of accurate diagnosis in early stages because such tumors usually grow without specific symptoms and pains. In addition, certain soft-tissue tumors have similar appearances between benignancy and malignancy; this phenomenon frequently leads to the delayed diagnosis without adequate initial management . If malignant tumors can be diagnosed correctly, patients’ survival rate will be increased .
Several imaging modalities have been used to assess soft-tissue tumors, with sonography being the preferred first-line screening tool in the clinic because of its advantages of low cost, nonionizing radiation, and real-time imaging. But some reports have indicated that sonography is limited to the differentiation between cysts and solid masses . Moreover, the sonographic examination relies heavily on the radiologists’ experience, so the reproducibility is hard to maintain among different measures. Fortunately, improvements in ultrasound technology have enabled the fine anatomic structures of tumors to be visualized in recent years .
Get Radiology Tree app to read full this article<
Get Radiology Tree app to read full this article<
Materials and methods
Database Acquisition
Get Radiology Tree app to read full this article<
Feature Extraction
Get Radiology Tree app to read full this article<
Morphologic features
Get Radiology Tree app to read full this article<
Circularity=4π×AreaPerimeter2 C
i
r
c
u
l
a
r
i
t
y
=
4
π
×
A
r
e
a
P
e
r
i
m
e
t
e
r
2
where perimeter is the length of the tumor’s perimeter. Circularity can show the extent of a tumor approaching to a circle. If the value of circularity is close to 1, the tumor shape should be near regularity. Get Radiology Tree app to read full this article<
Compactness=Area∩AreaeqArea C
o
mpactness
=
A
r
e
a
∩
A
r
e
a
e
q
A
r
e
a
where Area eq is an equivalent circle of the tumor area. If the ratio is close to 1, a tumor would be approaching the uniformity. Get Radiology Tree app to read full this article<
Eccentricity=a2−b2√a E
c
c
e
n
t
r
i
c
i
t
y
=
a
2
−
b
2
a
where a and b represent the major and minor axes of the equivalent ellipse. 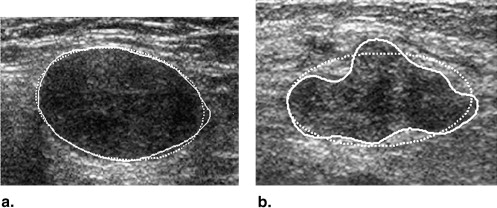
Get Radiology Tree app to read full this article<
ENC=Ellipseeq_PerimeterPerimeter E
N
C
=
E
l
l
i
p
s
e
eq
_
P
e
r
i
m
e
t
e
r
P
e
r
i
m
e
t
e
r
where Ellipse eq _Perimeter denotes the perimeter of the equivalent ellipse. When ENC is close to 1, the tumor boundary exhibited slight lobulations and smooth shape. Get Radiology Tree app to read full this article<
EAR=Area∩EllipseeqArea E
AR
=
A
r
e
a
∩
E
l
l
i
p
s
e
e
q
A
r
e
a
where Ellipse eq is the equivalent ellipse of the tumor. The feature is similar to compactness. When EAR is close to 0, the tumor has a high probability of being malignant. Get Radiology Tree app to read full this article<
Roundness=4×Areaπ×Max_Diameter2 R
o
u
n
d
n
e
s
s
=
4
×
A
r
e
a
π
×
M
a
x
_
D
i
a
m
e
t
e
r
2
where Max_Diameter is measured with the length of the major axis from the equivalent ellipse of a tumor. Get Radiology Tree app to read full this article<
Get Radiology Tree app to read full this article<
Li=Amax−AminAavg L
i
=
A
max
−
A
min
A
a
v
g
where A max and A min denote the sizes of the largest and the smallest lobulations, and A avg indicates the average size of all lobulations. The measure of a malignant tumor usually accompany with a larger LI value. Get Radiology Tree app to read full this article<
Get Radiology Tree app to read full this article<
Texture features
Get Radiology Tree app to read full this article<
Table 1
The Pixel Resolutions of the Sonography under the Different Scan Widths by Depths
Sonography (Width × Depth) Resolution (mm/pixel) 4 cm × 3 cm 0.08 4 cm × 4 cm 0.10 4 cm × 5 cm 0.12 4 cm × 6 cm 0.15
Get Radiology Tree app to read full this article<
Get Radiology Tree app to read full this article<
Classification Method
Get Radiology Tree app to read full this article<
Radiologists’ Rankings
Get Radiology Tree app to read full this article<
Results
Get Radiology Tree app to read full this article<
Table 2
Database of Different Histologic Subtypes with their Corresponding Amount and Misdiagnosis Numbers of Soft-tissue Tumors
Benign tumor Number/Ma/Mb Malignant tumor Number/Ma/Mb Lipoma 18/3/4 Metastasis tumor 9/1/1 Schwannoma 11/1/1 Malignant fibrous histiocytoma 7/0/1 Giant cell tumor 9/0/2 Liposarcoma 6/0/0 Glomus tumor 9/1/0 Lymphoma 4/0/0 Hemangioma 6/1/1 Osteogenic sarcoma 4/0/0 Fibroma 5/0/0 Alveolar soft part sarcoma 3/1/1 Leiomyoma 5/1/1 Epithelioid sarcoma 3/2/1 Aneurysm 4/0/0 Hemangiopericytoma 2/0/0 Neurofibroma 4/1/0 Fibromyxoid sarcoma 1/0/0 Benign fibrous histiocytoma 1/0/0 Synovial sarcoma 1/0/0 Glomangioma 1/0/0 Dermatofibrosarcoma 1/0/0 Total number 73/8/9 41/4/4
Ma, misdiagnosis of the linear discriminant analysis classifier; Mb, misdiagnosis of the multilayer perception classifier.
Get Radiology Tree app to read full this article<
Get Radiology Tree app to read full this article<
Get Radiology Tree app to read full this article<
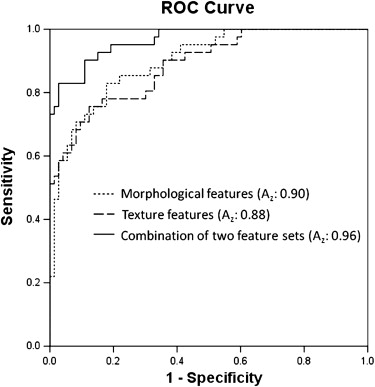
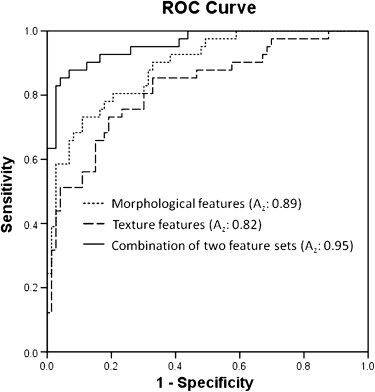
Table 3
Optimal Classification Performances of Soft-tissue Tumor with LDA and MLP Classifiers
LDA MLP Benign Malignant Benign Malignant Pathology Benign 65 4 64 4 Malignant 8 37 9 37 Total number 73 41 73 41
LDA, linear discriminant analysis; MLP, multilayer perception.
Table 4
Optimal Results by LDA and MLP Methods for the Classification of Soft-tissue Tumors
Classifier Accuracy Sensitivity Specificity PPV NPV A z LDA 89.5% 90.2% 89.0% 82.2% 94.2% 0.96 MLP 88.6% 90.2% 87.5% 80.4% 94.2% 0.95
LDA, linear discriminant analysis; MLP, multilayer perception; PPV, positive predictive value; NPV, negative predictive value.
Get Radiology Tree app to read full this article<
Get Radiology Tree app to read full this article<
Get Radiology Tree app to read full this article<
Discussion
Get Radiology Tree app to read full this article<
Get Radiology Tree app to read full this article<
Get Radiology Tree app to read full this article<
Get Radiology Tree app to read full this article<
Get Radiology Tree app to read full this article<
References
1. Brisse H., Orbach D., Klijanienko J., et. al.: Imaging and diagnostic strategy of soft tissue tumors in children. Eur Radiol 2006; 16: pp. 1147-1164.
2. Drukker K., Giger M., Metz C.: Robustness of computerized lesion detection and classification scheme across different breast US platforms. Radiology 2005; 237: pp. 834-840.
3. Kotilingam D., Lev D., Lazar A., et. al.: Staging soft tissue sarcoma: evolution and change. CA Cancer J Clin 2006; 56: pp. 282-291. quiz 314–285
4. García-Gómez J.M., Vidal C., Martí-Bonmatí L., et. al.: Benign/malignant classifier of soft tissue tumors using MR imaging. MAGMA 2004; 16: pp. 194-201.
5. Chiou H.J., Chou Y.H., Chiou S.Y., et. al.: High-resolution ultrasonography in superficial soft tissue tumors. J Med Ultrasound 2007; 15: pp. 152-174.
6. Gandhi M.R., Benson M.D.: Ultrasound of soft tissue masses. World J Surg 2000; 24: pp. 227-231.
7. Hwang S., Adler R.S.: Sonographic evaluation of the musculoskeletal soft tissue masses. Ultrasound Q 2005; 21: pp. 259-270.
8. Gielen J., Ceulemans R., Mv Holsbeeck: Ultrasound of soft tissue tumors.2006.Springer BerlinBerlin
9. Chiou H.J., Chou Y.H., Chiou S.Y., et. al.: Peripheral nerve lesions: role of high-resolution US. Radiographics 2003; 23: pp. e15.
10. Chen C.Y., Chiou H.J., Chou Y.H., et. al.: Computer-aided diagnosis of soft tissue tumors on high-resolution ultrasonography with geometrical and morphological features. Acad Radiol 2009; 16: pp. 618-626.
11. Clark M.A., Fisher C., Judson I., et. al.: Soft-tissue sarcomas in adults. N Engl J Med 2005; 353: pp. 701-711.
12. Skaane P., Engedal K.: Analysis of sonographic features in the differentiation of fibroadenoma and invasive ductal carcinoma. AJR Am J Roentgenol 1998; 170: pp. 109-114.
13. Wu W.J., Moon W.K.: Ultrasound breast tumor image computer-aided diagnosis with texture and morphological features. Acad Radiol 2008; 15: pp. 873-880.
14. Chen C.M., Chou Y.H., Han K.C., et. al.: Breast lesions on sonograms: computer-aided diagnosis with nearly setting-independent features and artificial neural networks. Radiology 2003; 226: pp. 504-514.
15. Chen D.R., Chang R.F., Huang Y.L.: Computer-aided diagnosis applied to US of solid breast nodules by using neural networks. Radiology 1999; 213: pp. 407-412.
16. Baker J.A., Kornguth P.J., Lo J.Y., et. al.: Artificial neural network: improving the quality of breast biopsy recommendations. Radiology 1996; 198: pp. 131-135.
17. Morrison D.: Multivariate statistical methods.2nd ed.1976.McGraw-HillTokyo
18. Fisher R.A.: The use of multiple measurements in taxonomic problems. Ann Eugenics 1936; 7: pp. 179-188.
19. Joo S., Yang Y.S., Moon W.K., et. al.: Computer-aided diagnosis of solid breast nodules: use of an artificial neural network based on multiple sonographic features. IEEE Trans Med Imaging 2004; 23: pp. 1292-1300.
20. Rumelhart D.E., Hinton G.E., William R.J.: Learning representation by backpropagation errors. Nature 1986; 3: pp. 4.
21. Hirose Y., Yamashita K., Hijiva S.: Back-propagation algorithm which varies the number of hidden units. Neural Networks 1991; 4: pp. 6.
22. Chan H.P., Sahiner B., Lam K.L., et. al.: Computerized analysis of mammographic microcalcifications in morphological and texture feature spaces. Med Phys 1998; 25: pp. 2007-2019.
23. Chen C.M., Chou Y.H., Han K.C., et. al.: Breast lesions on sonograms: computer-aided diagnosis with nearly setting-independent features and artificial neural networks. Radiology 2003; 226: pp. 504-514.
24. Haralick R.M., Shanmugam K., Dinstein I.H.: Textural features for image classification. IEEE Trans Systems. Man Cybernetics 1973; 3: pp. 610-621.
25. Chang R.F., Wu W.J., Moon W.K., et. al.: Automatic ultrasound segmentation and morphology based diagnosis of solid breast tumors. Breast Cancer Res Treat 2005; 89: pp. 179-185.
26. Kim K.G., Cho S.W., Min S.J., et. al.: Computerized scheme for assessing ultrasonographic features of breast masses. Acad Radiol 2005; 12: pp. 58-66.
27. Sahiner B., Chan H.P., Roubidoux M.A., et. al.: Computerized characterization of breast masses on three-dimensional ultrasound volumes. Med Phys 2004; 31: pp. 744-754.
28. Kuo W.J., Chang R.F., Moon W.K., et. al.: Computer-aided diagnosis of breast tumors with different US systems. Acad Radiol 2002; 9: pp. 793-799.
29. Kakkos S.K., Nicolaides A.N., Kyriacou E., et. al.: Effect of zooming on texture features of ultrasonic images. Cardiovasc Ultrasound 2006; 4: pp. 8.
30. Widmann G., Riedl A., Schoepf D., et. al.: State-of-the-art HR-US imaging findings of the most frequent musculoskeletal soft-tissue tumors. Skeletal Radiol 2008; 38: pp. 637-649.