
Rationale and Objectives
The detection and management of asymptomatic lacunar infarcts on magnetic resonance (MR) images are important tasks for radiologists to ensure the prevention of severe cerebral infarctions. However, accurate identification of the lacunar infarcts on MR images is a difficult task for the radiologists. Therefore the purpose of this study was to develop a computer-aided diagnosis scheme for the detection of lacunar infarcts to assist radiologists’ interpretation as a “second opinion.”
Materials and Methods
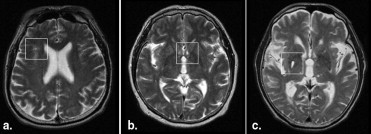
Our database comprised 1,143 T1- and 1,143 T2-weighted images obtained from 132 patients. The locations of the lacunar infarcts were determined by experienced neuroradiologists. We first segmented the cerebral region in a T1-weighted image by using a region growing technique for restricting the search area of lacunar infarcts. For identifying the initial lacunar infarcts candidates, a top-hat transform and multiple-phase binarization were then applied to the T2-weighted image within the segmented cerebral region. For eliminating the false positives (FPs), we determined 12 features—the locations x and y, signal intensity differences in the T1- and T2-weighted images, nodular components from a scale of 1 to 4, and nodular and linear components from a scale of 1 to 4. The nodular components and the linear components were obtained using a filter bank technique. The rule-based schemes and a support vector machine with 12 features were applied to the regions of the initial candidates for distinguishing between lacunar infarcts and FPs.
Results
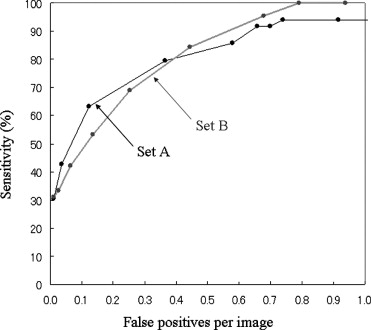
Our computerized scheme was evaluated by using a holdout method. The sensitivity of the detection of lacunar infarcts was 96.8% (90/93) with 0.76 FP per image.
Conclusions
Our computerized scheme would be useful in assisting radiologists for identifying lacunar infarcts in MR images.
Cerebrovascular disease is the third major cause of death in Japan ( ). Therefore, a health check system for cerebral and cerebrovascular diseases, which is named Brain Dock, is widely performed in Japan. In this system, unruptured cerebral aneurysms and asymptomatic lacunar infarcts are often detected using magnetic resonance angiography (MRA) and magnetic resonance imaging (MRI). However, their accurate identification is difficult task for radiologists. Thus we have been developed computer-aided diagnosis (CAD) schemes in Brain Dock for the detection of cerebral and cerebrovascular diseases on brain magnetic resonance images ( ) in order to assist radiologists’ diagnosis as a “second opinion.”
The detection of unruptured aneurysms in MRA studies is important because aneurysms rupture is the main cause of subarachnoid hemorrhage. However, it is difficult to detect small aneurysms in MRA studies because of the overlapping of aneurysms and adjacent vessels on maximum intensity projection image. Therefore several CAD schemes have been reported for the detection of aneurysms in MRA studies ( ). CAD schemes can determine the locations of the candidates for unruptured aneurysms by analyzing certain image features such as the size or shape of the candidate ( ). Approximately 90%–95% of the aneurysms can be accurately detected using the current CAD schemes. An observer study for conducting the effect of a developed CAD scheme was also carried out ( ). The results of this study indicated that the CAD improved the performance of neuroradiologists’ and general radiologists’ in detecting intracranial aneurysms by MRA. Although a number of studies have reported on CAD schemes for the detection of aneurysms, there have been no reports on the detection of lacunar infarcts without our previous study.
Get Radiology Tree app to read full this article<
Get Radiology Tree app to read full this article<
Materials and methods
Clinical Cases
Get Radiology Tree app to read full this article<
Gold Standard
Get Radiology Tree app to read full this article<
Get Radiology Tree app to read full this article<
Extraction of the Cerebral Region
Get Radiology Tree app to read full this article<
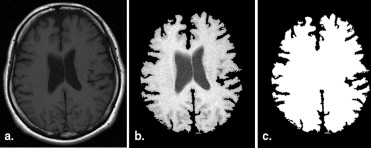
Get Radiology Tree app to read full this article<
Determination of Initial Candidates for Lacunar Infarcts
Get Radiology Tree app to read full this article<
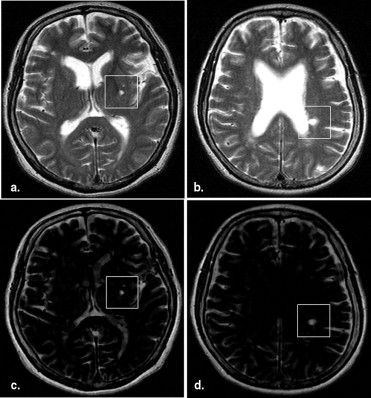
Get Radiology Tree app to read full this article<
Get Radiology Tree app to read full this article<
Twelve Features for Elimination of FPs
Get Radiology Tree app to read full this article<
Location
Get Radiology Tree app to read full this article<
Signal intensity difference
Get Radiology Tree app to read full this article<
NCs and NLCs
Get Radiology Tree app to read full this article<
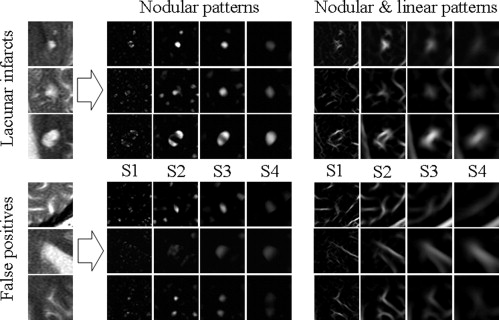
Get Radiology Tree app to read full this article<
Elimination of FPs
Get Radiology Tree app to read full this article<
Get Radiology Tree app to read full this article<
Results
Get Radiology Tree app to read full this article<
Get Radiology Tree app to read full this article<
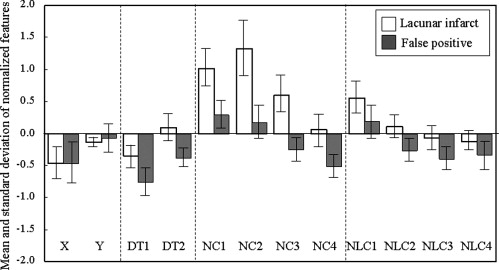
Table 1
Test for Univariate Equality of Group Means in Distinguishing Between Lacunar Infarcts and FPs
Feature Willis’s Lambda F Value_P_ Value Location x 1.000 0.003 .954 Location y 0.999 7.534 .006 Density deference T1 0.986 95.372 <.001 Density deference T2 0.955 324.377 <.001 NC at scale 1 0.966 239.583 <.001 NC at scale 2 0.938 456.921 <.001 NC at scale 3 0.934 486.145 <.001 NC at scale 4 0.967 231.115 <.001 NLC at scale 1 0.994 41.351 <.001 NLC at scale 2 0.977 162.121 <.001 NLC at scale 3 0.980 1239.512 <.001 NLC at scale 4 0.996 24.581 <.001
Get Radiology Tree app to read full this article<
Get Radiology Tree app to read full this article<
Get Radiology Tree app to read full this article<
Discussion
Get Radiology Tree app to read full this article<
Get Radiology Tree app to read full this article<
Get Radiology Tree app to read full this article<
Get Radiology Tree app to read full this article<
Conclusions
Get Radiology Tree app to read full this article<
Acknowledgments
Get Radiology Tree app to read full this article<
Get Radiology Tree app to read full this article<
References
1. Health and Welfare Statistics Association: Vital Stat Jap 2003; pp. 1.
2. Yokoyama R., Lee Y., Hara T., et. al.: An automated detection of lacunar infarct regions in brain MR images: preliminary study (in Japanese). Jap J Radiol Tech 2002; 58: pp. 399-405.
3. Yokoyama R., Matsui A., Fujita H.: Development of an automated method for detection of lacunar infarct regions on brain MR images. International Conference Series 2005; 1281: pp. 1407.
4. Uchiyama Y., Matsui A., Yokoyama R., et. al.: CAD scheme for detection of lacunar infarcts in brain MR image. Int J Comp Assisted Radiol Surg 2006; 1: pp. 382-385.
5. Uchiyama Y., Ando H., Yokoyama R.: Computer-aided diagnosis scheme for detection of unruptured intracranial aneurysms in MR angiography. Proc IEEE Engineering Med Biol 27th Annu Int Conf 2005; pp. 3031-3034.
6. Uchiyama Y., Yamauchi M., Ando H.: Automated classification of cerebral arteries in MRA images and its application to maximum intensity projection. Proc IEEE Engineering Med Biol 28th Annu Int Conf 2006; pp. 4865-4868.
7. Yamauchi M., Uchiyama Y., Yokoyama R., et. al.: Computerized scheme for detection of arterial occlusion in brain MRA images. Proc SPIE Med Imaging, Computer-Aided Diagnosis 2007; pp. 65142C-1-65142C-9.
8. Arimura H., Li Q., Korogi Y., et. al.: Automated computerized scheme for detection of unruptured intracranial aneurysms in three-dimensional MRA. Acad Radiol 2004; 11: pp. 1093-1104.
9. Arimura H., Li Q., Korogi Y., et. al.: Computerized detection of intracranial aneurysms for three-dimensional MR angiography: feature extraction of small protrusions based on a shape-based difference image technique. Med Phys 2006; 33: pp. 394-401.
10. Hayashi N., Masutani Y., Matsumoto H., et. al.: Feasibility of a curvature-based enhanced display system for detection cerebral aneurysms in MR angiography. Magn Res Med Sci 2003; 2: pp. 29-36.
11. Kobashi S., Kondo K., Hata Y.: Computer-aided diagnosis of intracranial aneurysms in MRA images with case-based reasoning. IEICE Trans Inform Syst 2006; E89-D: pp. 340-350.
12. Hirai T., Korogi Y., Arimura H., et. al.: Intracranial aneurysms at MR angiography: effect of computer-aided diagnosis on radiologists’ detection performance. Radiology 2006; 237: pp. 605-610.
13. Kobayashi S., Okada K., Koide H., et. al.: Subcortical silent brain infarction as a risk factor for clinical stroke. Stroke 1997; 28: pp. 1932-1939.
14. Vermeer S.E., Hollander M., Dijk E.J., et. al.: Silent brain infarcts and white matter lesions increase stroke risk in the general population. Stroke 2003; 34: pp. 1126-1129.
15. Boukura H., Kobayashi S., Yamaguchi S., et. al.: Discrimination of silent lacunar infarction from enlarged Virchow-Robin spaces on brain magnetic resonance imaging and pathological study. J Neurol 1998; 245: pp. 116-122.
16. Nakayama R., Uchiyama Y.: Development of new filter bank for detection of nodular pattern and line patterns in medical images. Syst Comp Jap 2005; 36: pp. 81-91.
17. Nakayama R., Uchiyama Y., Yamamoto K., et. al.: Detection of clustered microcalcifications on mammograms using new filter bank. Syst Comp Jap 2005; 36: pp. 68-79.
18. Nakayama R., Uchiyama Y., Yamamoto K., et. al.: Computer-aided diagnosis scheme using a filter bank for detection of microcalcification clusters in mammograms. IEEE Trans Biomed Engineer 2006; 53: pp. 273-283.
19. Cristianini N., Taylor J.S.: 2000.Cambridge University PressNew York
20. Theodoridis S., Koutroumbas K.: 1999.Academic PressLondon
21. Metz C.E., Herman B.A., Shen J.H.: Maximum likelihood estimation of receiver operating characteristic (ROC) curves from continuously distributed data. Stat Med 1998; 17: pp. 1033-1053.
22. Johnson R.A., Wicherm D.W.: 2007.Prentice HallEnglewood Cliffs, NJ
23. Chakraborty D.P.: Maximum likelihood analysis of free-response receiver operating characteristic (FROC) data. Med Phys 1989; 16: pp. 561-568.
24. Chan H.P., Doi K., Vyborny C.J., et. al.: Improvement in radiologists’ detection of clustered microcalcifications in mammograms—the potential of computer-aided diagnosis. Invest Radiol 1990; 25: pp. 1102-1110.
25. Jiang Y., Nishikawa R.M., Schmidt R.A., et. al.: Improving breast cancer diagnosis with computer-aided diagnosis. Acad Radiol 1999; 6: pp. 22-33.
26. Kobayashi T., Xu X.W., MacMahon H., et. al.: Effect of a computer-aided diagnosis scheme on radiologists’ performance in detection of lung nodules on radiographs. Radiology 1996; 199: pp. 843-848.
27. Shiraishi J., Abe H., Engelmann R., et. al.: Computer-aided diagnosis for distinction between benign and malignant solitary pulmonary nodules in chest radiographs: ROC analysis of radiologists’ performance. Radiology 2003; 227: pp. 469-474.
28. Li F., Arimura H., Suzuki K., et. al.: Computer-aided detection of peripheral lung cancers missed at CT: ROC analyses without and with localization. Radiology 2005; 237: pp. 684-690.