
Rationale and Objectives
To provide reference data for computer-aided joint space analysis (CAJSA) based on a semiautomated and computer-aided diagnostic system for the measurement of joint space widths (ie, proximal-interphalangeal joint), considering gender-specific and age-related differences.
Materials and Methods
A total of 869 subjects were enrolled (351 females/518 males) with radiographs of the hand. All participants underwent measurements of joint space distances at the proximal-interphalangeal articulation (JSD-PIP) of the second to fifth finger using CAJSA technology.
Results
The data verify a notable age-related decrease of CAJSA parameters, showing an accentuated age-related joint space narrowing in women. Additionally, males showed a significant wider JSD-PIP (+15.4%) compared with the female cohort for all age groups.
Conclusions
Our data present gender-specific and age-related normative reference values for computer-aided joint space analysis of JSD-PIP and provide a valid and reliable quantification of disease-related joint space narrowing, particularly in patients with osteoarthritis and rheumatoid arthritis involving the peripheral small hand joints.
Osteoarthritis and rheumatoid arthritis are joint-affecting disorders that have worldwide socioeconomic impact. Until relatively recently, measurements of joint space width were taken only of large joints, in particular the hip and knee ( ). However, recent advances in computer-aided diagnosis (CAD) have led to significant improvements in the field of radiologic diagnostic techniques of osteoarthritis and rheumatoid arthritis ( ).
In the last 5 years, two new CAD-systems have been developed for the quantification of metacarpal bone mineral density as well as joint space width of the metacarpal-phalangeal joints. Digital x-ray radiogrammetry (DXR) is a new operator-independent technique, providing automated measurements of cortical bone mineral density on the metacarpals using digitized radiographs ( ). Computer-aided joint space analysis (CAJSA) is a recently developed approach used for semiautomated measurements of joint space distances at the metacarpal-phalangeal articulation (JSD-MCP) of the first to fifth finger ( ).
Get Radiology Tree app to read full this article<
Get Radiology Tree app to read full this article<
Materials and methods
Patients
Get Radiology Tree app to read full this article<
Get Radiology Tree app to read full this article<
Get Radiology Tree app to read full this article<
Methods
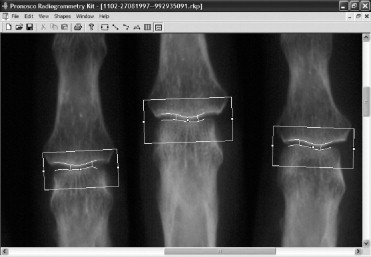
Measurement of Joint Space Width (By CAJSA)
Get Radiology Tree app to read full this article<
Get Radiology Tree app to read full this article<
Get Radiology Tree app to read full this article<
Get Radiology Tree app to read full this article<
Short-Term Precision of Joint Space Measurement (by CAJSA)
Get Radiology Tree app to read full this article<
Get Radiology Tree app to read full this article<
JSD-PIP II: 0.83% JSD-PIP III: 0.75% JSD-PIP IV: 0.85% JSD-PIP V: 1.02%
Get Radiology Tree app to read full this article<
Ethics
Get Radiology Tree app to read full this article<
Data Analysis
Get Radiology Tree app to read full this article<
Results
Age-Related Changes of CAJSA Parameters
Get Radiology Tree app to read full this article<
Table 1
Normative Values (Mean and Standard Deviation) for Joint Space Distance of the Proximal-Interphalangeal Joint in Women ( n = 351)
Age (years)n JSD (cm) PIP II PIP III PIP IV PIP V PIP Total Mean (SD) Mean (SD) Mean (SD) Mean (SD) Mean (SD) <10 12 0.19 (0.05) 0.19 (0.05) 0.18 (0.05) 0.16 (0.03) 0.18 (0.05) 10–15 16 0.17 (0.03) 0.16 (0.03) 0.15 (0.03) 0.14 (0.03) 0.16 (0.03) 16–20 42 0.14 (0.02) 0.14 (0.02) 0.12 (0.02) 0.11 (0.02) 0.14 (0.02) 21–25 45 0.13 (0.02) 0.12 (0.03) 0.11 (0.02) 0.10 (0.02) 0.12 (0.02) 26–30 35 0.13 (0.03) 0.12 (0.04) 0.11 (0.03) 0.10 (0.03) 0.12 (0.03) 31–35 32 0.13 (0.02) 0.12 (0.02) 0.11 (0.02) 0.10 (0.01) 0.12 (0.02) 36–40 22 0.12 (0.02) 0.12 (0.02) 0.10 (0.02) 0.10 (0.01) 0.11 (0.02) 41–45 22 0.12 (0.02) 0.11 (0.02) 0.10 (0.02) 0.10 (0.02) 0.11 (0.02) 46–50 24 0.12 (0.03) 0.11 (0.02) 0.10 (0.02) 0.10 (0.01) 0.11 (0.02) 51–55 24 0.11 (0.02) 0.11 (0.02) 0.10 (0.02) 0.09 (0.01) 0.10 (0.02) 56–60 16 0.11 (0.02) 0.11 (0.02) 0.09 (0.02) 0.09 (0.02) 0.10 (0.02) 61–65 11 0.11 (0.02) 0.11 (0.02) 0.09 (0.02) 0.09 (0.02) 0.10 (0.03) 66–70 14 0.10 (0.03) 0.10 (0.02) 0.09 (0.02) 0.09 (0.02) 0.10 (0.02) 71–75 7 0.10 (0.03) 0.10 (0.02) 0.09 (0.02) 0.09 (0.02) 0.10 (0.02) 76–80 9 0.10 (0.03) 0.10 (0.02) 0.09 (0.01) 0.09 (0.02) 0.10 (0.02) 81–85 12 0.10 (0.03) 0.10 (0.03) 0.09 (0.03) 0.09 (0.03) 0.10 (0.03) >86 8 0.10 (0.04) 0.10 (0.03) 0.09 (0.01) 0.09 (0.03) 0.10 (0.03) Total 351 0.12 (0.03) 0.12 (0.03) 0.11 (0.02) 0.10 (0.02) 0.11 (0.02)
JSD-PIP: joint space distance of the proximal-interphalangeal joint in cm; SD = standard deviation.
Table 2
Normative Values (Mean and Standard Deviation) for Joint Space Distance of the Proximal-Interphalangeal Joint in Men ( n = 518)
Age in years_n_ JSD (cm) PIP II PIP III PIP IV PIP V PIP Total Mean (SD) Mean (SD) Mean (SD) Mean (SD) Mean (SD) <10 15 0.21 (0.06) 0.20 (0.05) 0.20 (0.05) 0.19 (0.05) 0.20 (0.05) 10–15 26 0.19 (0.03) 0.19 (0.03) 0.17 (0.02) 0.15 (0.03) 0.18 (0.03) 16–20 96 0.16 (0.03) 0.16 (0.03) 0.15 (0.03) 0.13 (0.02) 0.15 (0.03) 21–25 82 0.14 (0.02) 0.15 (0.03) 0.13 (0.02) 0.12 (0.02) 0.14 (0.02) 26–30 60 0.14 (0.03) 0.14 (0.03) 0.13 (0.02) 0.12 (0.03) 0.13 (0.03) 31–35 46 0.14 (0.02) 0.14 (0.03) 0.13 (0.02) 0.11 (0.02) 0.13 (0.02) 36–40 38 0.14 (0.03) 0.14 (0.04) 0.12 (0.03) 0.11 (0.02) 0.13 (0.03) 41–45 36 0.13 (0.02) 0.14 (0.03) 0.12 (0.02) 0.10 (0.02) 0.12 (0.02) 46–50 28 0.13 (0.03) 0.14 (0.04) 0.12 (0.03) 0.10 (0.02) 0.12 (0.03) 51–55 20 0.13 (0.04) 0.13 (0.03) 0.12 (0.03) 0.10 (0.02) 0.12 (0.03) 56–60 14 0.12 (0.02) 0.12 (0.02) 0.10 (0.02) 0.09 (0.01) 0.11 (0.02) 61–65 15 0.12 (0.02) 0.12 (0.02) 0.10 (0.02) 0.09 (0.02) 0.11 (0.02) 66–70 12 0.12 (0.03) 0.12 (0.03) 0.10 (0.03) 0.09 (0.02) 0.11 (0.03) 71–75 8 0.12 (0.03) 0.12 (0.03) 0.10 (0.03) 0.09 (0.02) 0.11 (0.03) 76–80 11 0.12 (0.03) 0.11 (0.02) 0.10 (0.01) 0.09 (0.02) 0.11 (0.02) 81–85 3 0.11 (0.02) 0.11 (0.01) 0.10 (0.03) 0.08 (0.02) 0.10 (0.03) >86 8 0.10 (0.02) 0.09 (0.01) 0.08 (0.02) 0.07 (0.02) 0.09 (0.02) Total 518 0.14 (0.03) 0.14 (0.03) 0.12 (0.03) 0.11 (0.02) 0.13 (0.03)
JSD-PIP: joint space distance of the proximal-interphalangeal joint in cm; SD = standard deviation.
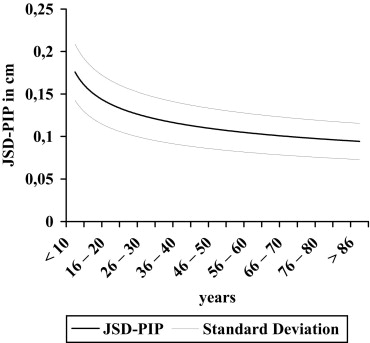
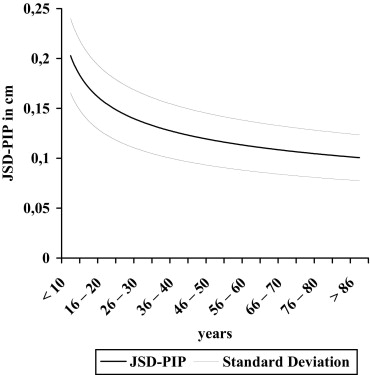
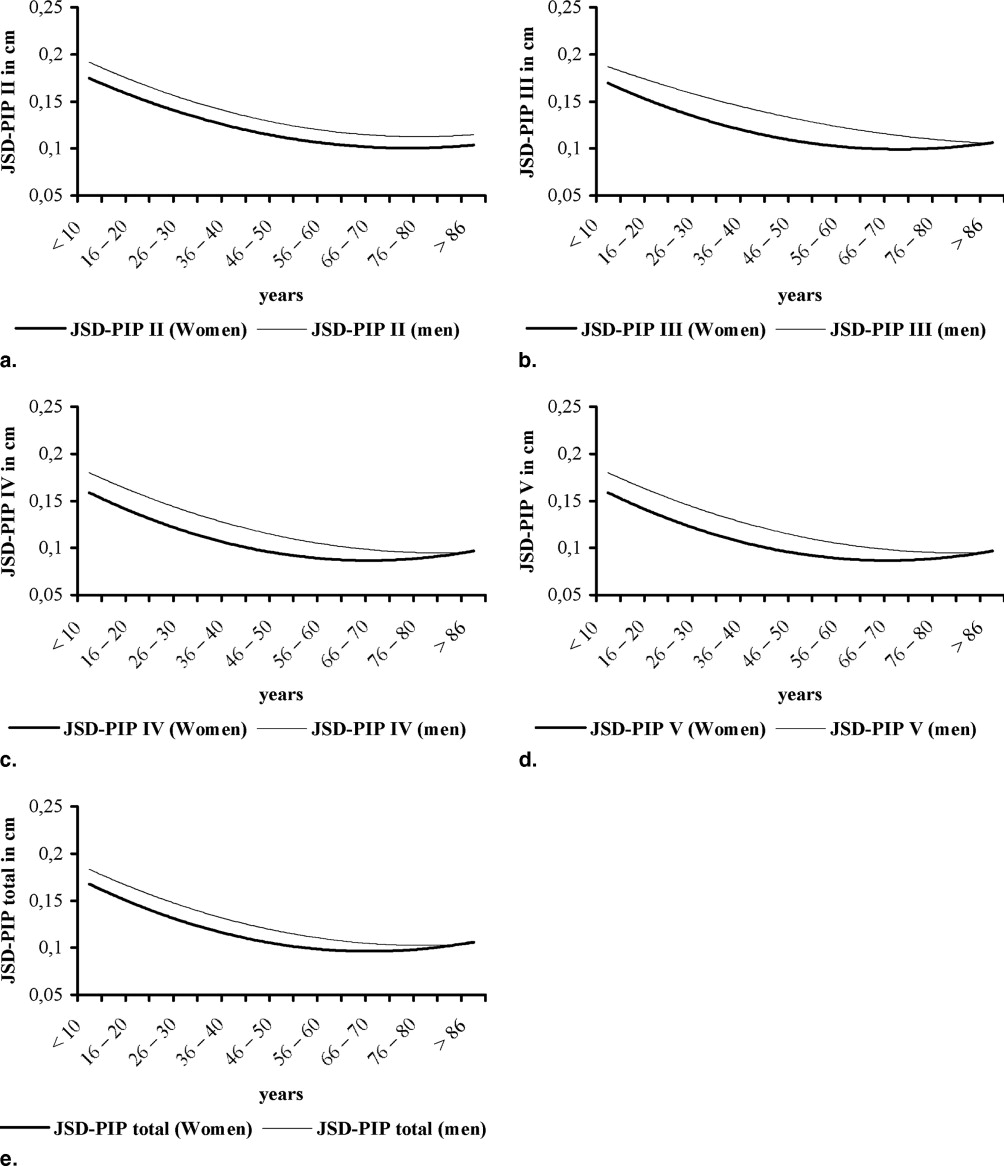
TABLE 3
Age-Related Relative Changes of JSD-PIP Between Men ( n = 518) and Women ( n = 351)
Age in years_n_ Men_n_ Women Reduction in % JSD-PIP total in cm JSD-PIP total in cm Mean (SD) Mean (SD) <10 15 0.20 (0.05) 12 0.18 (0.05) −10.0% ( P < .05) 10–15 26 0.18 (0.03) 16 0.16 (0.03) −11.1% ( P < .01) 16–20 96 0.15 (0.03) 42 0.14 (0.02) −6.7% ( P < .05) 21–25 82 0.14 (0.02) 45 0.12 (0.02) −14.3% ( P < .01) 26–30 60 0.13 (0.03) 35 0.12 (0.03) −7.7% ( P < .05) 31–35 46 0.13 (0.02) 32 0.12 (0.02) −7.7% ( P < .05) 36–40 38 0.13 (0.03) 22 0.11 (0.02) −15.4% ( P < .01) 41–45 36 0.12 (0.02) 22 0.11 (0.02) −8.3% ( P < .05) 46–50 28 0.12 (0.03) 24 0.11 (0.02) −8.3% ( P < .05) 51–55 20 0.12 (0.03) 24 0.10 (0.02) −16.7% ( P < .01) 56–60 14 0.11 (0.02) 16 0.10 (0.02) −9.1% ( P < .05) 61–65 15 0.11 (0.02) 11 0.10 (0.03) −9.1% ( P < .05) 66–70 12 0.11 (0.03) 14 0.10 (0.02) −9.1% ( P < .05) 71–75 8 0.11 (0.03) 7 0.10 (0.02) −9.1% ( P < .05) 76–80 11 0.11 (0.02) 9 0.10 (0.02) −9.1% ( P < .05) 81–85 3 0.10 (0.03) 12 0.10 (0.03) 0% ( P = NS) >86 8 0.09 (0.02) 8 0.10 (0.03) 11.1% ( P < .01)
JSD-PIP: joint space distance of the proximal-interphalangeal joint in cm; SD = standard deviation.
Get Radiology Tree app to read full this article<
Gender-Related Differences of CAJSA Parameters
Get Radiology Tree app to read full this article<
Get Radiology Tree app to read full this article<
Get Radiology Tree app to read full this article<
Discussion
Get Radiology Tree app to read full this article<
Impact of Short-Term Precision on CAJSA Measurement
Get Radiology Tree app to read full this article<
Comparison of JSD-PIP Regarding Gender and Age
Get Radiology Tree app to read full this article<
Get Radiology Tree app to read full this article<
Clinical Application of the JSD Measurement
Get Radiology Tree app to read full this article<
Get Radiology Tree app to read full this article<
Get Radiology Tree app to read full this article<
Get Radiology Tree app to read full this article<
Get Radiology Tree app to read full this article<
Get Radiology Tree app to read full this article<
Get Radiology Tree app to read full this article<
Get Radiology Tree app to read full this article<
Acknowledgments
Get Radiology Tree app to read full this article<
References
1. Dacre J.E., Huskisson E.C.: The automatic assessment of knee radiographs in osteoarthritis using digital image analysis. Br J Rheumatol 1989; 28: pp. 506-510.
2. Buckland-Wright J.C., MacParlane D.G., Lynch J.A., et. al.: Quantitative microfocal radiography detects changes in OA knee joint space width in patients in placebo controlled trial of NSAID therapy. J Rheumatol 1995; 22: pp. 937-943.
3. Duryea J., Li J., Peterfy C.G., Gordon C., et. al.: Trainable rule-based algorithm for the measurement of joint space width in digital radiographic images of the knee. Med Phys 2000; 27: pp. 580-591.
4. Conrozier T., Jousseaume C.A., Mathieu P., et. al.: Quantitative measurement of joint space narrowing progression in hip osteoarthritis: a longitudinal retrospective study of patients treated by total hip arthroplasty. Br J Rheumatol 1998; 37: pp. 961-968.
5. Böttcher J., Pfeil A., Rosholm A., et. al.: Computerized quantification of joint space narrowing and periarticular demineralization in patients with rheumatoid arthritis based on Digital X-ray Radiogrammetry. Invest Radiol 2006; 41: pp. 36-44.
6. Böttcher J., Malich A., Pfeil A., et. al.: Potential clinical relevance of digital radiogrammetry for quantification of periarticular bone demineralization in patients suffering from rheumatoid arthritis depending on severity and compared with DXA. Eur Radiol 2004; 14: pp. 631-637.
7. Stewart A., Mackenzie L.M., Black A.J., et. al.: Predicting erosive disease in rheumatoid arthritis. Rheumatology 2004; 43: pp. 1561-1564.
8. Böttcher J., Pfeil A., Mentzel H.J., et. al.: Peripheral bone status in rheumatoid arthritis evaluated by Digital X-ray Radiogrammetry (DXR) and compared with multi-site Quantitative Ultrasound (QUS). Calcif Tis Int 2006; 78: pp. 25-34.
9. Jawaid W.B., Crosbie D., Shotton J., et. al.: Use of Digital X-ray radiogrammetry in the assessment of joint damage in rheumatoid arthritis. Ann Rheum Dis 2006; 65: pp. 459-464.
10. Böttcher J., Pfeil A., Rosholm A., et. al.: Digital X-Ray Radiogrammetry combined with semi-automated analysis of joint space distances as a new diagnostic approach in rheumatoid arthritis—a cross-sectional and longitudinal study. Arthritis Rheum 2005; 52: pp. 3850-3859.
11. Böttcher J., Pfeil A., Rosholm A., et. al.: Computerized digital imaging techniques provided by digital radiogrammetry as new diagnostic tool in rheumatoid arthritis. J Digital Imag 2006; 19: pp. 279-288.
12. Larsen A., Thoen J.: Hand radiography of 200 patients with rheumatoid arthritis repeated after an interval of one year. Scand J Rheumatol 1987; 16: pp. 395-401.
13. Kellgren J., Lawrence J.: Radiological assessment of osteoarthrosis. Ann Rheum Dis 1957; 16: pp. 494-502.
14. Felson D.T., Zhang Y.: An update on the epidemiology of knee and hip osteoarthritis with a view to prevention. Arthritis Rheum 1998; 41: pp. 1343-1355.
15. Arokoski J.P.A., Jurvelin J., Vätäinen U., et. al.: Normal and pathological adaptation of articular cartilage to joint loading: review. Scand J Med Sci Sports 2000; 10: pp. 186-198.
16. Sowers M., Lachance L., Hochberg M., et. al.: Radiographically defined osteoarthritis of the hand and knee in young and middle-aged African American and Caucasian women. Osteoarthr Cartilage 2000; 8: pp. 69-77.
17. Chaisson C.E., Zhang Y., Sharma L., et. al.: Higher grip strength increases the risk of incident radiographic osteoarthritis in proximal hand joints. Osteoarthritis Cartilage 2000; 8: pp. S29-S32.
18. Lau E.C., Cooper C., Lam D., et. al.: Factors associated with osteoarthritis of the hip and knee in Hong Kong Chinese: obesity, joint injury and occupational activities. Am J Epidemiol 2000; 152: pp. 855-862.
19. Cooper C., Snow S., McAlindon T.E., et. al.: Risk factors for the incidence and progression of radiographic knee osteoarthritis. Arthritis Rheum 2000; 43: pp. 995-1000.
20. Hochberg M.C., Lethbridge-Cejku M., Plato C.C., et. al.: Factors associated with osteoarthritis of the hand in males: data from the Baltimore Longitudinal Study of Aging. Am J Epidemiol 1991; 134: pp. 1121-1127.
21. Hart D.J., Spector T.D.: The relationship of obesity, fat distribution and osteoarthritis in women in the general population. J Rheumatol 1993; 20: pp. 331-335.
22. Sturmer T., Gunther K.P., Breener H.: Obesity, overweight and patterns of osteoarthritis: the Ulm Osteoarthritis Study. J Clin Epidemiol 2000; 53: pp. 307-313.
23. Haara M.M., Manninen P., Kröger H., et. al.: Osteoarthritis of finger joints in Finns aged 30 or over: prevalence, determinants, and association with mortality. Ann Rheum Dis 2003; 62: pp. 151-158.
24. Lawrence J.S., Bremner J.M., Biers F.: Osteoarthritis. Ann Rheum Dis 1966; 25: pp. 1-24.
25. Mikkelsen W.M., Duff I.F.: Age-sex prevalence of radiographic abnormalities of the joints of the hand, wrist and cervical spine of adult resident of Tecumseh. J Chronic Dis 1970; 23: pp. 151-159.
26. Swanson A.B., Swanson G.G.: Osteoarthritis in the hand. Clin Rheum Dis 1985; 11: pp. 393-419.
27. van Saase J.L.C.M., van Romunde L.K.J., Cats A., et. al.: Epidemiology of osteoarthritis, Zoetermeer survey. Ann Rheum Dis 1989; 48: pp. 271-280.
28. Felson D.T.: The epidemiology of osteoarthritis.Kuettner K.F.Goldberg V.M.Osteoarthritis disorders.1994.American Academic Orthopaedic SurgeonsRosemont, IL:pp. 13-24.
29. Cauley J.A., Kwoh K., Egeland G., et. al.: Serum sex hormones and severity of osteoarthritis of the hand. J Rheumatol 1993; 20: pp. 1170-1175.
30. Oliveria S.A., Felson D.T., Reed J.I., et. al.: Incidence of symptomatic hand, hip, and knee osteoarthritis among patients in a health maintenance organization. Arthritis Rheum 1995; 38: pp. 1134-1141.
31. Hochberg M.C., Lane N.E., Pressman A.R., et. al.: The association of radiographic changes of osteoarthritis of the hand and hip in elderly women. J Rheumatol 1995; 22: pp. 2291-2294.
32. Hart D., Spector T., Egger P., et. al.: Defining osteoarthritis of the hand for epidemiological studies; The Chingford study. Ann Rheum Dis 1994; 53: pp. 220-223.
33. Spector T.D., Cooper C.: Radiological assessment of osteoarthritis: whither Kellgren and Lawrence?. Osteoarthritis Cartilage 1993; 1: pp. 203-206.
34. Gravallese E.M.: Bone destruction in arthritis. Ann Rheum Dis 2002; 61: pp. 84-86.
35. Hansch A., Sauner D., Hilger I., et. al.: Noninvasive diagnosis of arthritis by autofluorescence. Invest Radiol 2003; 38: pp. 578-583.
36. Hansch A., Frey O., Hilger I., et. al.: Diagnosis of arthritis using near-infrared fluorochrome Cy5.5. Invest Radiol 2004; 39: pp. 626-632.
37. Kalla A.A., Meyers O.L., Laubscher R.: Prevalence of metacarpal osteopenia in young rheumatoid arthritis patients. Clin Rheumatol 1995; 14: pp. 617-625.
38. Tan A.L., Grainger A.J., Tanner S.F., et. al.: High-resolution magnetic resonance imaging for the assessment of hand osteoarthritis. Arthritis Rheum 2005; 52: pp. 2355-2365.
39. Berg A., Singer T., Moser E.: High-resolution diffusivity imaging at 3.0 T for the detection of degenerative changes: a trypsin-based arthritis model. Invest Radiol 2003; 38: pp. 460-466.
40. Backhaus M., Kamradt T., Sandrock D., et. al.: Arthritis of the finger joints: a comprehensive approach comparing radiography, scintigraphy, ultrasound, and contrast-enhanced magnetic resonance imaging. Arthritis Rheum 1999; 42: pp. 1232-1245.
41. Sugimoto H., Takeda A., Hyodoh K.: Early-stage rheumatoid arthritis: prospective study of the effectiveness of MR imaging for diagnosis. Radiology 2000; 216: pp. 569-575.
42. Bird P., Conaghan P., Ejbjerg B., et. al.: The development of the EULAR-OMERACT rheumatoid arthritis MRI reference image atlas. Ann Rheum Dis 2005; 64: pp. 8-10.
43. Ostergaard M., Klarlund M., Lassere M., et. al.: Interreader agreement in the assessment of magnetic resonance images of rheumatoid arthritis wrist and finger joints—an international multicenter study. J Rheumatol 2001; 28: pp. 1143-1150.